Steven Madden Stock Chart Fibonacci Analysis 081525Trading Idea
1) Find a FIBO slingshot
2) Check FIBO 61.80% level
3) Entry Point > 26.4/61.80%
Chart time frame:B
A) 15 min(1W-3M)
B) 1 hr(3M-6M)
C) 4 hr(6M-1year)
D) 1 day(1-3years)
Stock progress:A
A) Keep rising over 61.80% resistance
B) 61.80% resistance
C) 61.80% support
D) Hit the bottom
E) Hit the top
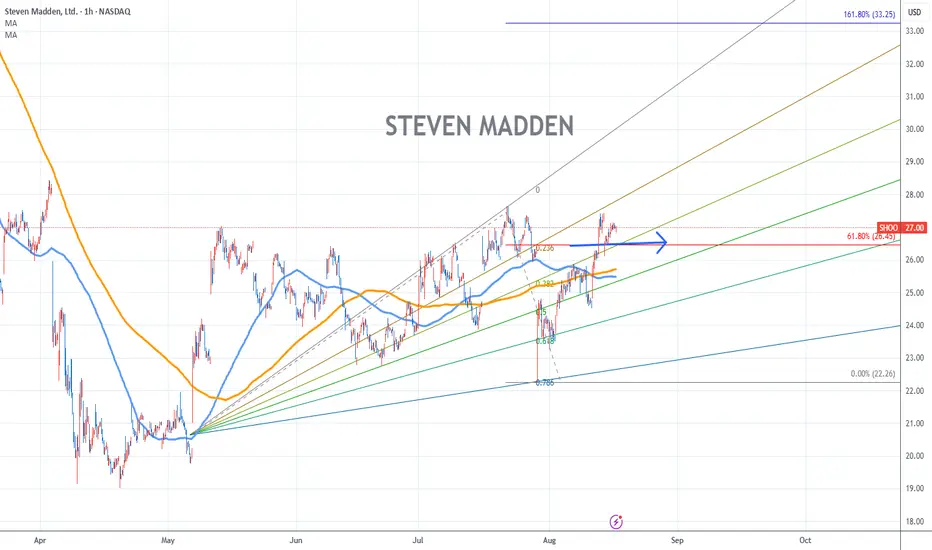
Stocks rise as they rise from support and fall from resistance. Our goal is to find a low support point and enter. It can be referred to as buying at the pullback point. The pullback point can be found with a Fibonacci extension of 61.80%. This is a step to find entry level. 1) Find a triangle (Fibonacci Speed Fan Line) that connects the high (resistance) and low (support) points of the stock in progress, where it is continuously expressed as a Slingshot, 2) and create a Fibonacci extension level for the first rising wave from the start point of slingshot pattern.
When the current price goes over 61.80% level , that can be a good entry point, especially if the SMA 100 and 200 curves are gathered together at 61.80%, it is a very good entry point.
As a great help, tradingview provides these Fibonacci speed fan lines and extension levels with ease. So if you use the Fibonacci fan line, the extension level, and the SMA 100/200 curve well, you can find an entry point for the stock market. At least you have to enter at this low point to avoid trading failure, and if you are skilled at entering this low point, with fibonacci6180 technique, your reading skill to chart will be greatly improved.
If you want to do day trading, please set the time frame to 5 minutes or 15 minutes, and you will see many of the low point of rising stocks.
If you want to prefer long term range trading, you can set the time frame to 1 hr or 1 day
SHOO trade ideas
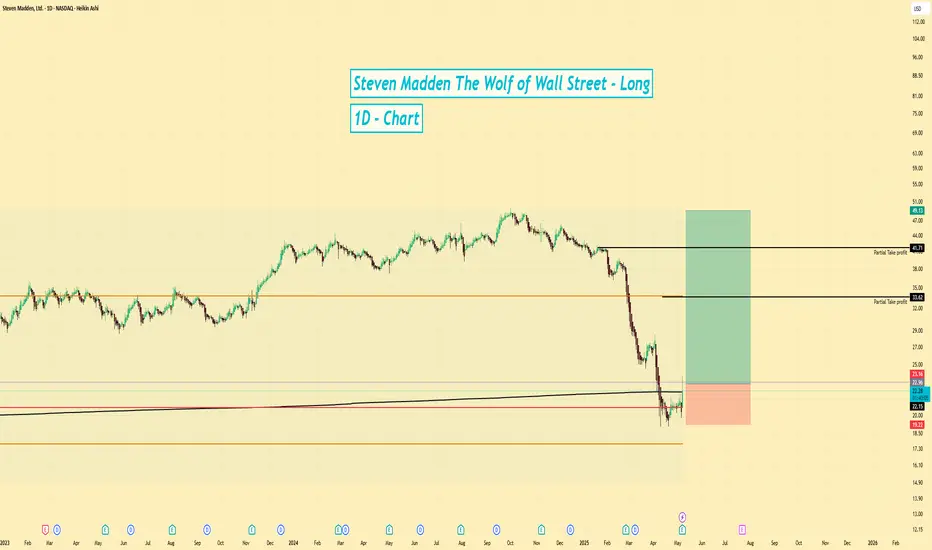
SHOO | Long | Accumulation Around VWAP + Value Setup |(May 2025)SHOO | Long | Accumulation Around VWAP + Value Setup | (May 2025)
1️⃣ Short Insight Summary:
Steve Madden (SHOO) is showing signs of accumulation near VWAP support, suggesting smart money could be positioning for a move higher. Strong fundamentals and a low debt profile make this setup appealing.
2️⃣ Trade Parameters:
Bias: Long
Entry: Current zone near VWAP – signs of accumulation during consolidation
Stop Loss: $19.22
TP1: $33.00
TP2: $41.00
3️⃣ Key Notes:
✅ Daily chart shows price stabilizing with volume near VWAP—classic accumulation setup.
✅ Strong fundamentals: Low P/E ratio (8.79), 4.17% dividend yield, solid earnings per share ($2.37), and beta of just 0.8 (less volatility).
✅ Free cash flow is about double its debt ($152M debt vs. over $300M+ in liquidity), which is a healthy balance sheet.
📈 Revenue and EPS expected to increase through Q3 2025, then soften slightly—but annual earnings trend remains positive.
👟 Operates in the fashion footwear and apparel space, serving consumers directly and via wholesale. This sector often sees seasonal tailwinds.
4️⃣ Optional Follow-up Note:
If price holds above the VWAP zone and breaks local resistance with volume, I’ll provide an update or scale in further. Watching how price reacts near $25–$27.
Please LIKE 👍, FOLLOW ✅, SHARE 🙌 and COMMENT ✍ if you enjoy this idea! Also share your ideas and charts in the comments section below! This is best way to keep it relevant, support us, keep the content here free and allow the idea to reach as many people as possible.
Disclaimer: This is not a financial advise. Always conduct your own research. This content may include enhancements made using AI.
SHOO trianglebreakout may appear soon. price touched decreasing trendline. be ready to act on price swing.

✅ STOCK REVIEW: $SHOOSHOO experienced a significant upsurge, climbing from $30.35 to $44.23 from September to December, followed by a typical pullback of approximately 10.67% from its peak to a low of $39.45.
This correction is viewed positively as it likely indicates the elimination of less committed investors.
Notably, on February 7th, SHOO's price action dipped below the January 4th low before swiftly rebounding close to its previous highs. Such movements suggest a potential setup for a pivot point, expected to form within a few days to a week.
BUY POINT
Indeed, SHOO broke out to new highs on February 23rd, entering at $44.40. Our current stop loss is set at $42.00, presenting a risk of -4.74%. A Reversal alert was activated by the day's end, which is typical; we anticipate the price to surpass this level shortly. With earnings announced next week, having a buffer to maintain the position through the report would be advantageous.

SHOO - symmetrical triangleInteresting opportunity for $NASDAQ:SHOO. Large price range in response out earnings. It wicked out of this symmetrical triangle, reversed when it ran into the VWAP from ATH, and then fell back to the VWAP from Februarys beginning of the formation. SHOO has slow but steady fundamental performance over the past 5 years, but isn't a strong fit with my long term holdings.
My gameplan:
Entry ~$34
TP ~$36.63, just below the measured move from the start of the formation and at strong resistance of the retrace from ATH
SL ~$32, at a break below the pattern.
www.youtube.com

SHOO 2523Bounced off a long term trend line
Higher low, seller exhaustion. Bull market has not been confirmed. Simply common retraces we could see. I look towards 50 percent corrections of the entire move . Will look into the lower time frames at a later time.

SHOO : two ways to buy shares (medium term)For Trade #1, refer to the linked related ideas below for reasons why I bought shares there
//The exit strategy (price close below the EMA ribbon) will be ignored if not already in profit and/or haven't hit 3R. Keep the trade on as long as the stoploss hasn't been hit yet
For Trade #2, TSI Shadow bullish crossover occured. I mark a line on the HIGH of that candle. I will wait 5EMA will cross over it, then I will buy some
shares
Every trade I will scale out once it hits 3R. I will the remaining position open until price close below the ribbon


