SHOP Technical Outlook: SMA Pullback and Bullish Structure📈 SHOPIFY, INC. (SHOP) — Swing Trade Profit Playbook
Exchange: NASDAQ
Market Type: US Stocks
Trade Style: Swing Trade
Bias: Bullish Continuation
🧠 Market Thesis (Clean & Professional)
SHOP is showing bullish momentum confirmation after a Simple Moving Average (SMA) pullback, signaling renewed buyer strength and trend continuation potential. Price action remains constructive above key averages, favoring buy-the-dip and layered accumulation tactics rather than chasing a single entry.
This setup is designed for controlled risk participation while respecting volatility and pullbacks.
🟢 Trade Plan – Bullish SMA Breakout
Trend Status: Bullish
Trigger: Price holding above the Simple Moving Average (trend confirmation)
🎯 Entry Strategy (Layered Execution Style)
Instead of a single entry, this plan uses a layered limit-order approach, allowing flexibility and better average pricing during intraday or short-term pullbacks.
Example Buy Layers:
$150
$155
$160
$165
📌 You may add or reduce layers based on your own risk tolerance and position sizing model.
📌 This approach helps reduce emotional execution and improves average cost efficiency.
🛑 Risk Management
Stop Loss Zone: $145
This level invalidates the bullish structure and protects capital if momentum fails.
⚠️ Risk is personal — adjust stops based on your own system, timeframe, and position size.
🏁 Profit Objective
Primary Target: $190
Why this level matters:
Strong historical resistance
Overbought reaction zone
High probability of profit-taking pressure
📌 Scaling out partial profits near resistance is encouraged for capital protection.
🔍 Confluence Summary (Why This Works)
✔ SMA pullback confirmation
✔ Higher-timeframe bullish structure
✔ Layered entries reduce execution risk
✔ Clear invalidation & upside target
🌍 Fundamentals & Macro Factors Supporting SHOP
Shopify remains a core infrastructure player in global e-commerce
Growth driven by merchant services, payments, and subscriptions
Beneficiary of improving consumer spending trends
US tech sector strength continues to attract institutional flows
📊 Macro tailwinds to monitor:
US interest rate expectations
Consumer spending data
Nasdaq risk-on / risk-off sentiment
🔗 Related Symbols to Watch (Correlation Check)
NASDAQ:QQQ → Nasdaq strength supports SHOP momentum
NASDAQ:AMZN → E-commerce sentiment bellwether
NASDAQ:META → Digital commerce & ad-spend correlation
$SHOPUSD (Crypto proxy sentiment) → Risk appetite alignment
📌 Strong QQQ continuation increases probability of SHOP follow-through.
⚠️ Important Notes
This is a structured swing-trade idea, not a prediction.
Markets can invalidate any setup — discipline and risk control always come first.
✨ “If you find value in my analysis, a 👍 and 🚀 boost is much appreciated — it helps me share more setups with the community!”
#SHOP #Shopify #SwingTrading #USStocks #NASDAQ #BreakoutTrade #LayeredEntries #TechnicalAnalysis #RiskManagement #TradingViewIdeas 🚀📈
Market insights

$SHOP - Deep Dive into the Premier High-Growth Commerce PlatformShopify Inc. stands as a preeminent selection for investors seeking high-growth equity exposure, consistently ranking among the top stocks to buy now due to its powerful execution, expansive market opportunity, and multiple emerging growth vectors. Recent analyst commentary underscores a growing conviction in the company's profitability trajectory and its ability to sustain exceptional growth rates well into the future.
Analyst Confidence: Reaffirmed Outlook and Profitable International Expansion
Citizens Financial Group reinforced its bullish stance on December 4th, reiterating a Market Outperform rating and a $185 price target. This affirmation followed Shopify's impressive third-quarter 2024 results, which demonstrated robust momentum with both Gross Merchandise Volume (GMV) and revenue expanding by over 30% year-over-year. A central pillar of Citizens' thesis is Shopify's accelerating and highly profitable growth in Europe.
The European segment has evolved into a critical and lucrative engine for Shopify. In Q3 2024, Europe contributed 21% of total revenue, a significant increase from less than 18% in the prior year. Crucially, Citizens emphasizes that this geographic shift is not merely a volume story but a substantial margin expansion story. Due to more favorable debit and credit card interchange fee structures, the gross profit margins Shopify earns on payment volume (GPV) from its European merchants on Basic, Grow, and Advanced plans could be approximately four times greater than those from comparable American retailers. Citizens characterizes this European expansion as "an underappreciated tailwind for profitability" and notes that Shopify retains ample runway to continue acquiring merchants across the continent. Furthermore, the firm highlighted Shopify's increasing marketing effectiveness in Europe, where the company is still in the early, high-growth-potential phase of capturing market share—a dynamic that contrasts with its more mature North American operations.
Long-Term Growth Catalysts: AI and Structural Market Share Gains
The bullish perspective extends beyond near-term geographic trends. Wells Fargo presents a transformative long-term view, describing Shopify as an "under-earning asset" with immense latent potential. The firm believes Shopify is uniquely positioned to capture significant "demand-generation economics" in an AI-powered future. As artificial intelligence revolutionizes online search and product discovery, Shopify's platform and vast merchant network could allow it to benefit directly from shifts in how consumers find and purchase goods. Wells Fargo's conviction is reflected in financial projections that are substantially above consensus, forecasting revenue and adjusted operating income estimates to surpass market expectations by more than 20% and 50%, respectively, by 2028.
Even analysts with a more measured near-term view express profound optimism about Shopify's decade-long trajectory. UBS, which maintains a Neutral rating, has outlined a powerful growth framework centered on four key pillars: International, Enterprise, In-store Point-of-Sale (POS), and Business-to-Business (B2B)—collectively termed "EII&B." UBS believes these pillars will be the primary drivers enabling Shopify to seize meaningful market share over the next ten years. Their detailed modeling projects that through 2035, Shopify can achieve a Compound Annual Growth Rate (CAGR) of 15% to 21% in GMV, accompanied by a 15% to 20% CAGR in gross profit. This underscores a belief in the company's durable, high-teens growth profile.
Company Profile and Investment Summary
Shopify Inc. is a Canadian multinational leader in commerce and financial technology. It provides a comprehensive, unified platform that empowers businesses of all sizes to start, run, and scale their operations seamlessly across online stores, physical retail locations, social media platforms, and digital marketplaces. By integrating essential tools for storefront design, payments, shipping, marketing, and customer engagement, Shopify offers a true all-in-one solution, reducing complexity for merchants and creating a powerful, sticky ecosystem.
Technical Perspective and Price Action
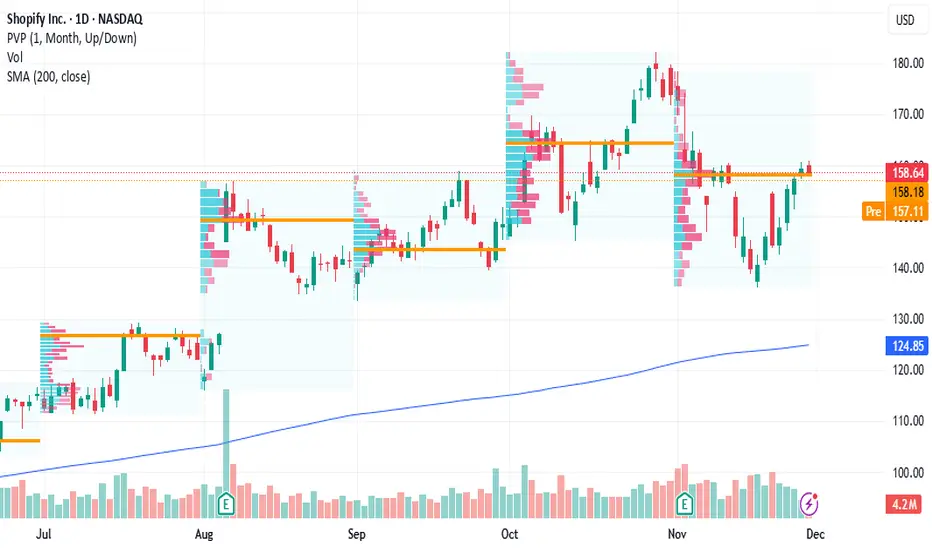
From a technical analysis standpoint, Shopify's stock chart reveals key levels that traders and investors monitor. The price has established a main support zone around the $140 level, which represents a critical area of buyer interest and potential consolidation. A secondary, stronger support zone is identified near $126.02, aligning with the 0.5 Fibonacci retracement level from a prior major move. On the upside, a significant take-profit target resides at $190, a level that aligns with recent analyst price objectives and would represent a decisive breakout to new highs.
In conclusion, Shopify Inc. presents a compelling investment case built on a foundation of strong current execution, a rapidly scaling and high-margin international business, and multiple long-term growth levers powered by AI, enterprise adoption, and offline commerce. While the stock commands a premium valuation reflective of its quality, analyst consensus points to a path where sustained high growth and expanding profitability can justify and potentially exceed its current market price, making it a cornerstone holding for growth-oriented portfolios.

$SHOP: Higher Low and Flat Base Set-UpOverview of Recent Price Action
SHOP recently experienced a pullback of approximately 25% from its all-time high (ATH). Such retracements are a typical pattern for stocks that have been in a sustained long-term uptrend. The recent dip allowed the stock to reset its base, which means that any subsequent upward movement could mark the beginning of a new stage two uptrend.
Technical Strength and Higher Low Formation
Notably, SHOP has established a higher low, indicating that the stock may be regaining strength. This technical development suggests a potential shift in momentum, which could attract additional buying interest as the stock stabilizes and positions itself for a possible breakout.
Position Entry and Current Set-Up
A half-sized position was initiated yesterday as SHOP reclaimed the 21-day Exponential Moving Average (EMA). An additional allocation was made today after the stock surpassed the 50-day Moving Average (DMA). Currently, SHOP is trading just below a flat base, with the anticipation that it may soon break out above this level.
Potential Price Target
While specific price targets are not typically set, it is reasonable to expect that the stock could attempt to challenge its previous all-time high. If SHOP achieves this, it would represent a gain of about 12% from the breakout point.
Risk Disclaimer
Readers are strongly encouraged to conduct their own analysis and adhere to their personal trading strategies. It is crucial to understand that all investments carry inherent risks. Making informed decisions is essential when allocating capital within the financial markets.

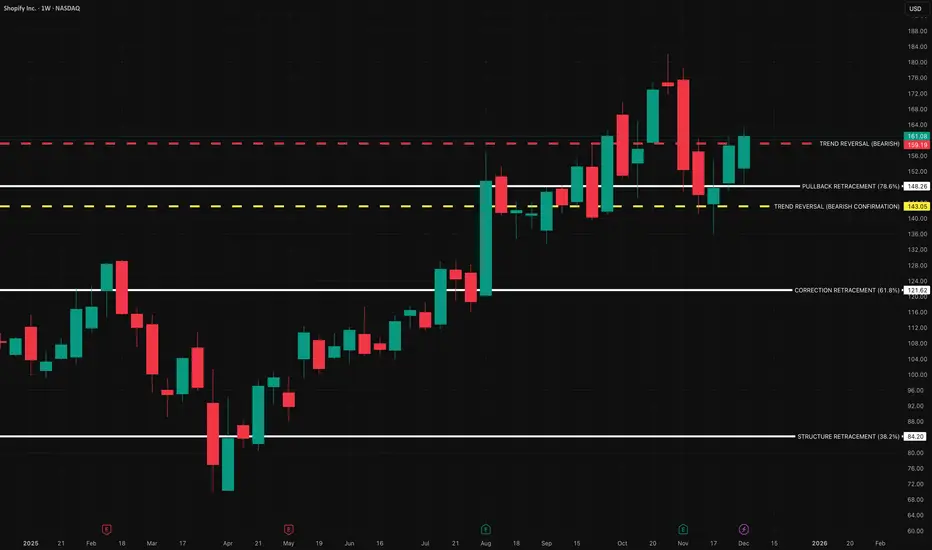
$SHOP | COVERAGE INITIATED — Personal Position Update [W49]COVERAGE INITIATED — Bullish Classification (Trend Shift Identified)
SHOP — WEEK 49 TREND REPORT | 12/05/2025
Ticker: NASDAQ:SHOP
Timeframe: W
This is a reactive structural classification of SHOP based on the weekly chart as of this timestamp. Price conditions are evaluated as they stand — nothing here is predictive or forward-assumptive.
⸻
Author’s Note — Personal Position Update
I initiated my own position on [ NASDAQ:SHOP ] during Week [ 49 ], entering at $ [ 161.08 ].
This decision follows my personal criteria: I only participate when my system identifies a verified structural trend shift supported by both a confirmed weekly flag and a qualifying candle state. This note reflects my activity only and is not a suggestion for anyone else.
As of this update, my position is currently up ~ [ 0% ] from my entry.
My structural exit level is $ [ 159.19 ] on a weekly-close basis. This level will continue to adjust upward automatically as the structure strengthens. If price closes below that threshold, my system classifies the trend as structurally compromised, and that is where I personally exit.
This update exists solely to document my own participation and the structural levels I monitor. It is not predictive and does not imply any future outcome.
⸻
Structural Integrity
1) Current Trend Condition [ Numbers to Watch ]
• Current Price @ $
• Trend Duration @ +0 Weeks
( Bullish )
• Trend Reversal Level ( Bearish ) @ $
• Trend Reversal Level ( Bearish Confirmation ) @ $
• Pullback Retracement @ $
• Correction Support @ $
⸻
2) Structure Health
• Retracement Phase:
Uptrend (operating above 78.6%)
• Position Status:
Healthy (price above both structural layers)
⸻
3) Temperature :
Neutral Phase
⸻
4) Momentum :
Bullish
⸻
Structural Alignment
UPWARD STRUCTURAL ALIGNMENT
This mark reflects a point where market behavior supported the continuation of the existing upward direction. It does not imply forecasting or targets — it simply notes where strength became observable within the current trend. Its meaning holds only while price continues to respect the broader structural levels that define the trend.
⸻
Methodology Overview
This classification framework evaluates directional conditions using internal trend-interpretation logic that references price behavior relative to its structural layers. These relationships are used to identify when price movement aligns with the framework’s criteria for directional phases, transition points, or regime shifts. Visual elements or structural labels reflect these internal interpretations, rather than explicit trading signals or preset indicator crossovers. This framework is observational only and does not imply future outcomes.
Shop inverse H&S to 250Shopify has printed an inverse head and shoulders pattern. Look for a rise to the psychological level of 250 before resistance and possibly higher (indicated on the chart by the vertical "B" line).

Shopify (NYSE: $SHOP) Hit by Cyber Monday OutageShopify (NYSE: NASDAQ:SHOP ) faced a major disruption on Cyber Monday as thousands of merchants were unable to log in or access point-of-sale systems during the busiest online shopping day of the year. The outage peaked around 11 a.m. EST, with more than 4,000 reports on Downdetector. Shopify confirmed that “selected stores” were experiencing issues and began rolling out fixes throughout the afternoon.
The timing of the outage intensified the impact. U.S. Cyber Monday sales were expected to reach $14.2 billion, up 6.3% from last year, driven by strong Black Friday momentum and increased adoption of AI-powered retail tools. For many small businesses relying on Shopify for payment processing, order management, and real-time analytics, the disruption caused delays during a critical revenue window. Shopify later stated it had found and fixed a login authentication error and saw “signs of recovery,” though some merchants continued to face intermittent issues.
While outages are not uncommon for digital commerce platforms under extreme demand, the incident highlights the operational risks Shopify must manage as competition intensifies and merchants demand better reliability during peak shopping cycles.
Technicals
SHOP remains in a broader bullish structure despite the recent pullback. The chart shows price retesting a long-term ascending trendline following a rejection from the $182 resistance zone. The retest aligns with previous structure support near the $138–$142 demand block. As long as price holds above the trendline, bulls remain in control. A bounce from this zone opens the path back toward $182, while a clean break below trendline support could expose lower support near $120. Momentum indicators show neutral positioning, suggesting room for a renewed move if buyers step in.

SHOP - Find a Support on Long Term Trend ChanelHello Everyone, Followers,
SHOPIFY is 3rd one for today.
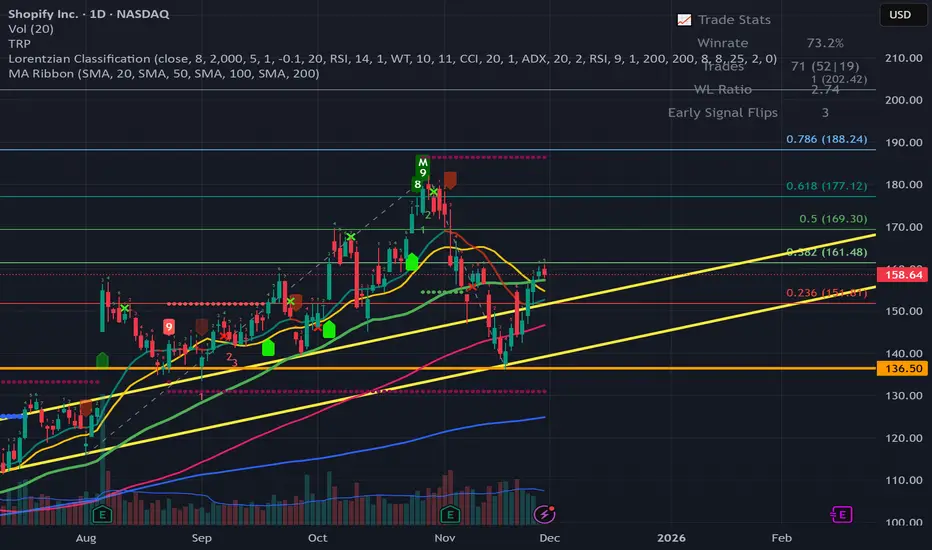
Shopify maintains a healthy structure inside its ascending trend channel.
🔍 Chart Highlights
- Price bounced strongly from the lower yellow trendline, defending long-term structure.
- SHOP is now facing resistance at 161 next resistance level is 169
- 100 MA and 50 MA are flattening — early signs of a possible trend reversal.
The MACD-style price action (higher lows + strong candles) supports short-term upward momentum.
🔹 Outlook
If SHOP breaks above 161 then 169 , the next target is 177 → 188.
Struggle at these levels may cause a pullback to 151 or even 136.50 .
🔹 My Plan
I monitor SHOP closely near 161.
A breakout confirms bullish continuation.
Pullbacks to the lower trendline remain attractive accumulation opportunities.
If you enjoy and like clean, simple analysis — follow me for more.
This is just my thinking and it is not invesment suggestion , please do not make any decision with my anaylsis.
Have a lovelly Sunday to all and Good Start a Week.
#SHOP #SPX500 #NASDAQ
Shopify bullish sentiment setting up for short-term gainsCurrent Price: $145.56
Direction: LONG
Confidence Level: 58% (Given the weak but present bullish cues from X sentiment combined with the absence of bearish conviction from professional traders, my confidence is modest but leaning to the upside)
Targets:
- T1 = $148.50
- T2 = $151.00
Stop Levels:
- S1 = $144.00
- S2 = $142.50
**Wisdom of Professional Traders:**
This synthesis combines the collective insights of professional traders with the real-time signals from X sentiment. Even though the traders’ analysis leaned more toward discussing strategic consumer demand timing rather than issuing a firm directional call, the lack of bearish commentary, paired with bullish chatter from market participants online, points to an opportunity to take a long position in Shopify for the upcoming week.
**Key Insights:**
Here's what's driving this: the professional traders I’m watching are interpreting seasonal events like Small Business Saturday as growth catalysts to enhance customer engagement and revenue. When traders focus on consumer spending patterns, especially during strong retail periods, it often underpins bullish bias in e-commerce-related stocks.
What caught my attention is that despite no clear technical price levels mentioned, the trading community sentiment from X was distinctly bullish. This suggests that traders are anticipating a bounce or short-term rally fueled by holiday season demand optimism. While there are no “hard” resistance breakouts cited, the absence of warnings about downside pressure is tipping my bias toward the long side.
**Recent Performance:**
Over the past week, Shopify has been moving sideways around the mid-$140s range, consolidating gains from its prior run-up. The $145 mark has held as a stable base, showing resilience despite broader market fluctuations. This steady support is often the kind of level where an upside push can emerge, especially during periods of strong retail activity.
**Expert Analysis:**
Several professional traders focused on strategic timing of promotions and understanding customer buying cycles, rather than voicing technical bearish concerns. This kind of qualitative outlook — seeing strength in seasonality and event-driven traffic — tends to support bullish setups in retail-heavy platforms like Shopify.
The bullish tilt from X sentiment, even from limited tweet volume, reinforces that traders in the social sphere are positioning for an upswing. The collective trader view I’m reading here is: no major downside triggers visible right now, room for a small upside play within the week.
**News Impact:**
While no major earnings news dropped in the past few days, the ongoing holiday shopping season acts as a supportive backdrop. Shopify, as a core infrastructure for online merchants, benefits disproportionately from increased sales volumes during November-December. Even minor digital marketing or promotional headlines can act as incremental catalysts at this time of year.
**Trading Recommendation:**
Here’s my take: With weak but consistent bullish cues, no technical breakdown chatter, and a supportive seasonal backdrop, opening a long position around $145.56 is reasonable for this week. I’m watching for a move toward $148.50 (T1) and a possible extension to $151 (T2), keeping stops tight at $144.00 and $142.50 to control risk given the modest confidence level.
Shopify Breakout of ChannelShopify NASDAQ:SHOP is painting a breakout on the daily timeframe from the descending channel.
The next area of resistance is sitting right at the mid-channel trendline of the ascending channel.
Watch for the first test at around 165, clearing the path to the main target around 195 at the top of the channel.

SHOP in BUY ZONEMy trading plan is very simple.
I buy or sell when at either of these events happen:
* Price tags the top or bottom of parallel channel zones
* Money flow volume spikes beyond it's Bollinger Bands
So...
Here's why I'm picking this symbol to do the thing.
Price in buying zone at bottom of channels
Money flow momentum is spiked negative and under bottom of Bollinger Band
Entry at $143.85
Target is upper channel around $180 but may close at moving average at $156

Shopify is holding its ground within a strong ascending channelShopify Inc. NASDAQ:SHOP is holding its ground within a strong ascending channel on the daily timeframe.
After facing resistance near $250, price pulled back to retest the lower boundary of the channel around $223, a level that could now act as key support.
As long as it stays above this trendline, the structure remains bullish with potential to retest $250 in the near term.
If momentum picks back up, Shopify could be gearing up for another powerful run toward the upper channel.

SHOP QuantSignals V3 Earnings 2025-11-03SHOP QuantSignals V3 Earnings 2025-11-03
SHOP Earnings Signal | 2025-11-03
• Direction: NEUTRAL | Confidence: 55%
• Entry Plan: Open | Expiry 2025-11-07
• Strike Focus: $167.50
• Entry Range: $7.55
• Target 1: $11.03
• Stop Loss: $5.15
• Implied Move: $20.75 (12.0%)
• 24h Move: -2.15%
• Flow Intel: Bearish (High P/C Ratio) | PCR 2.82
• 🔴 HIGH RISK WARNING: Use only small position size due to lower confidence and high uncertainty.
• Earnings Date: 2025-11-04 | Estimate: $0.34
⚖️ Compliance: Educational earnings analysis for QS Premium members only. Not financial advice.
🎯 TRADE RECOMMENDATION
Direction: BUY PUTS
Confidence: 55%
Conviction Level: SPECULATIVE
🧠 ANALYSIS SUMMARY
Katy AI Signal: Katy AI shows NEUTRAL bias with 50% confidence but indicates a bearish target of $171.63 (below current $173.19) with a stop loss at $175.79, suggesting slight downward pressure despite neutral overall rating.
Technical Analysis: RSI at 77.7 indicates overbought conditions with potential reversal risk. Price declined -2.15% in past 24h with above-average volume (1.5x), showing selling pressure. EMA alignment remains bullish but momentum shows signs of exhaustion.
News Sentiment: Mixed signals with analysts noting Shopify is "Priced for Perfection" setting high bar for earnings. Recent news highlights earnings focus but lacks clear bullish catalysts. Neutral-to-cautious pre-earnings sentiment.
Options Flow: Strong bearish signal with Put/Call Ratio of 2.82 (High P/C Ratio) indicating heavy put buying. Unusual activity at $100 put strike shows institutional hedging against downside. Implied move of 12.0% ($20.75) suggests significant volatility expected.
Risk Level: HIGH - Neutral AI signal with conflicting technicals and extreme volatility expected. Earnings beat rate only 50% adds uncertainty.
💰 TRADE SETUP
Expiry Date: 2025-11-07 (4 days)
Recommended Strike: $167.50
Entry Price: $7.35 - $7.75
**Ta
Image
QS Analyst
APP
— 10:49 AM
rget 1: $11.03 (50% gain from entry)
Target 2: $14.70 (100% gain from entry)
Stop Loss: $5.15 (30% loss from entry)
Position Size: 2% of portfolio
⚡ COMPETITIVE EDGE
Why This Trade: Combines overbought technicals with heavy put flow indicating institutional caution, despite neutral AI rating. High PCR of 2.82 suggests smarter money positioning for downside.
Timing Advantage: Earnings volatility capture with 4-day expiry maximizes theta decay while capturing post-earnings movement. Overbought RSI provides technical edge.
Risk Mitigation**: Conservative strike selection ($167.50 put has -0.382 delta) provides buffer against whipsaw. Tight stop loss limits losses if reversal doesn't materialize.
🚨 IMPORTANT NOTES
Katy AI shows NEUTRAL bias (50% confidence) - this is a speculative trade based on technical overbought conditions and options flow rather than strong AI conviction
High implied volatility (142-148%) means expensive options - rapid time decay risk
Earnings beat rate only 50% - high binary outcome risk
Consider smaller position size given speculative nature
Monitor pre-market movement closely for early exit signals
📊 TRADE DETAILS 📊
🎯 Instrument: SHOP
🔀 Direction: PUT (SHORT)
🎯 Strike: 167.50
💵 Entry Price: 7.55
🎯 Profit Target: 11.03
🛑 Stop Loss: 5.15
📅 Expiry: 2025-11-07
📏 Size: 2.0
📈 Confidence: 55%
⏰ Entry Timing: N/A
🕒 Signal Time: 2025-11-03 13:49:38 EST
🔴 HIGH RISK WARNING: Use only small position size due to lower confidence and high uncertainty.

$SHOP: A 4-Year Pattern Breakout Before EarningsWith the AI bubble looking frothy, investors are hunting for the next big rotation. The consumer holiday play looks like the perfect switch, and all eyes are on $SHOP.
This is looking like a clean breakout from a massive 4-year rounding bottom—a pattern this big is a major deal.
The setup couldn't be more critical:
• Catalyst: Earnings are tomorrow (Nov 4) pre-market.
• Sector: AMZN just hit a record high. The e-commerce holiday season is the clear narrative right now.
• History: SHOP has a strong track record of beating revenue estimates for the last two years.
• Momentum: The stock is already up over 60% YTD and the RSI is high, showing strong buying interest.
• High Beta: The stock's beta is over 3.5. This thing is built to move on a catalyst.
You have a long-term technical break, a major sector rotation, and a huge earnings catalyst all hitting at the same time. This is a powerful combination. Watching this one very, very closely today.

SHOP | Consensus Dealer Price Target $185Shopify ripped through its pivot on Friday, but dealers indicate that the run has further to go. Watch for continued strength.

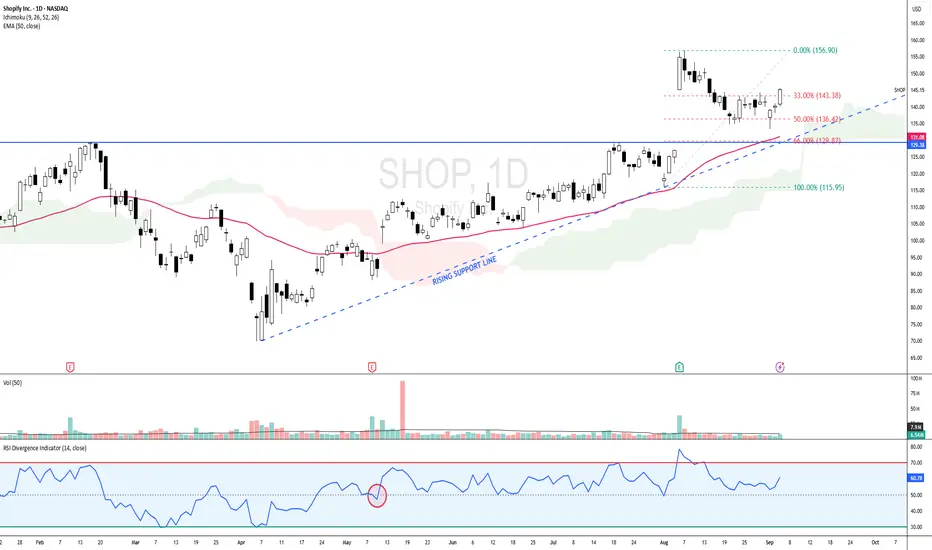
SHOP - BULLISH SCENARIO since 12 MAY 2025 SHOP - CURRENT PRICE : 145.15
SHOP is bullish as the share price is above 50-day EMA. Price action on 12 MAY 2025 is considered starting of bullish scenario because supported by several key indicators :
Share price gap up
Price broke out 50-day EMA
Price moving above ICHIMOKU CLOUD
RSI moving above 50
From 1 August (near 50-day EMA support) to 6 August, the stock recorded a strong upward rally. Following this advance, prices entered a corrective phase and retraced approximately 50% of the prior upswing. According to Dow Theory, such a retracement is considered a normal and healthy correction within an ongoing uptrend. Retracements in the range of one-third to two-thirds of the prior move are typical, with the 50% level often serving as a natural equilibrium point where buyers re-enter the market. Sustaining above the 50% retracement level would reinforce the bullish structure, while a recovery from this zone could pave the way for a retest of the recent highs. However, a decisive break below the 61.8% retracement may imply weakening momentum and a deeper corrective phase.
Take note that until now the share price is still above 50-day EMA and ICHIMOKU CLOUD while RSI also moving steadily above 50 level. There is also rising support line - strengthening bullish outlook.
ENTRY PRICE : 141.00 - 145.50
TARGET : 159.00 and 175.00
SUPPORT : 50-day EMA (CUTLOSS below 50-day EMA on closing basis)
SHOP - all time highs incomingSHOP - Stock is approaching recent highs at $167.69. looking strong for a possible breakout. Stock making a cup shaped reversal on the daily. Company to report earnings early next month. Looking for calls above $167.69 for a move towards $170 and $177(all time highs).

SHOP Breakout Watch – Bulls Eyeing $169 Zone!
Shopify (SHOP) is testing key resistance near $167, forming a bullish ascending structure.
A breakout above could trigger momentum toward $169–$170.
Holding above $164 keeps the short-term trend strong — below it, a retest of $160 is possible.
📊 Bias: Bullish above $164 – breakout confirmation awaited.
🎯 Targets: 167 / 169.5
🛑 Support: 164 / 160

SHOP BullishContinues to trade within this ascending wedge. Both times we saw an intraday wick trade below and then close within the channel, prices ripped higher. It looks like Shopify is finally ready to break all time highs with a daily close above this wedge, looking above 170+. Targeting $200+ into earnings

Keep your Eye on SHOPThere are so many Bullish patterns on this chart, I don't see how it will stay down. The weekly has an even Bigger pattern not included in this.

Shopify - Bears will get wrecked!☎️Shopify ( NASDAQ:SHOP ) will soon break out:
🔎Analysis summary:
In 2021, Shopify created the previous all time high which was followed by a drop of more than -80%. But over the course of the past couple of years, Shopify managed to regain most of its strength. Therefore an all time high breakout will happen after the bullish break and retest.
📝Levels to watch:
$150, $120
SwingTraderPhil
SwingTrading.Simplified. | Investing.Simplified. | #LONGTERMVISION

Buying ShopifyI'm looking to start building a position in Shopify again. Last chart i did on this played out very well. My two green horizontals are based off monthly support levels. Low 80s to mid 60s are great areas to add. I become very interested below $70, maybe earning provides the fuel to get there.

SHOP has one more seller to BuyHello I am the Cafe Trader.
Today we are going to be looking at Shopify, Thanks to a request from a follower.
Couple things to note here. This is a Massive range for a decent stock.
With a bottom of 23.61, and a high of 176.34 some may wonder if we might see some more downside before testing the highs (rightfully so).
Today we are going to look at some long term prices I think are suitable for your personal risk tolerance. as well as two possible short term scenarios and how you can navigate them.
Enough talking let's get into the charts.
Long Term
These prices are chosen from current market participants. I've measured them in order of your own conviction.
Aggressive = 122 (Top of Demand)
Fair Price = 99-102 (Concentrated demand)
Steal = 70-81 (Top of Strong Buyers)
Short Term
I'm going to be honest here, I don't particularly like the positioning of the range to go long here. That Strong Supply area is still very active, and we may have to hit that concentrated demand before having enough strength to get through that supply.
As this stands though, Bulls are in control. We have that trend break with real buyers, this is looking to hit top of supply in it's current context.
If at all we close above that strong supply (especially on friday) This is a great case to have a continuation.
If we cannot get above this strong supply after a test or two more, this is going to put pressure on the buyers.
Green Scenario
Entry 122
Stop 111.50
1st TP 141
Final TP 145.50
Red Scenario
If bulls make a big push and fail back below the strong supply, Bulls will be trapped, and This will put alot of pressure on the "Top of Demand".
Entry = close of the candle that is the false breakout.
Stop = Depends on how big the wick was on the false breakout. I'll assume about 131.50. but if its a huge wick, it will need to be higher. I'll update this depending.
1st TP = 106
Final = 102.5
That's all for SHOP Stay tuned for updates and more charts!
Happy Trading!
@thecafetrader
@livelclark

SHOP watch $126.79-127.28: Major Resistance may start a RetraceSHOP surged into a significant resistance at $126.79-127.28.
Zone of a Golden Genesis fib paired with a Covid Simulus fib.
Looking for a Break-n-Retest or Dip-to-Fib for long entries.
.
