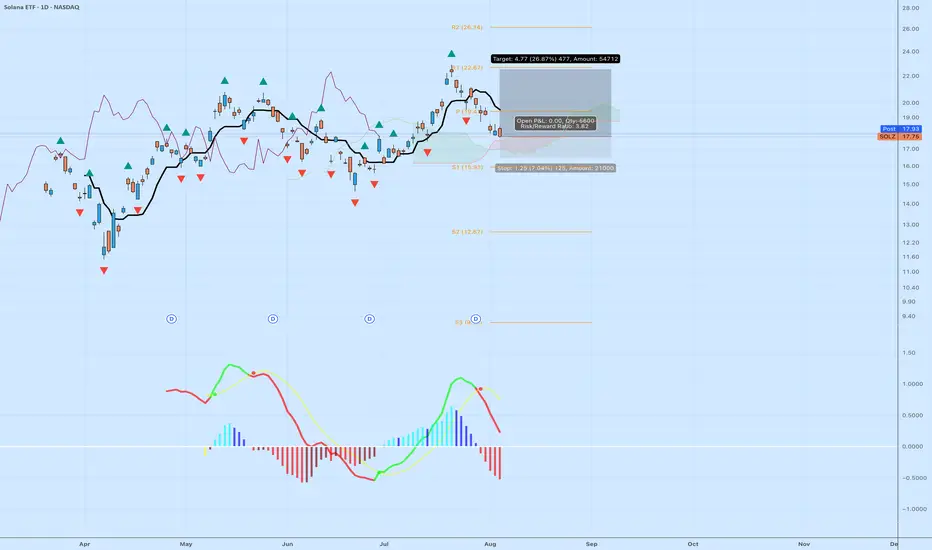
$SOLZ – Ichimoku Cloud Long SetupThis chart shows a potential long opportunity forming on NASDAQ:SOLZ using Ichimoku principles.
The price has pulled back into the Ichimoku Cloud (Kumo), which often acts as dynamic support during an uptrend. The cloud is still bullish, with Senkou Span A above Span B, indicating the longer-term
Key stats
About Solana ETF
Home page
Inception date
Mar 20, 2025
Structure
Open-Ended Fund
Replication method
Synthetic
Dividend treatment
Distributes
Distribution tax treatment
Ordinary income
Income tax type
Capital Gains
Max ST capital gains rate
39.60%
Max LT capital gains rate
20.00%
Primary advisor
Volatility Shares LLC
Distributor
Foreside Fund Services LLC
SOLZ aims for returns corresponding to 100% of Solanas (SOL) price movements by investing in cash-settled Solana futures contracts and other Solana-linked financial instruments, rather than directly holding SOL. These positions trade on Commodity Futures Trading Commission (CFTC)-registered exchanges. To maintain exposure, the fund rolls its contracts forward by exiting positions near expiration and replacing them with later-dated contracts. The fund manages its exposure through a wholly owned Cayman Islands subsidiary, capping investments at 25% of total assets at quarter-end. Investments may include reverse repurchase agreements, swaps, other Solana-linked investments, and Sol-referenced indexes. Additionally, the fund holds US Treasuries, investment-grade corporate debt, and money market instruments to collateralize its positions.
Related funds
Classification
Symbol
Geography
Global
What's in the fund
Exposure type
Mutual fund
Bonds, Cash & Other100.00%
Mutual fund99.98%
Cash0.02%
Top 10 holdings
Summarizing what the indicators are suggesting.
Oscillators
Neutral
SellBuy
Strong sellStrong buy
Strong sellSellNeutralBuyStrong buy
Oscillators
Neutral
SellBuy
Strong sellStrong buy
Strong sellSellNeutralBuyStrong buy
Summary
Neutral
SellBuy
Strong sellStrong buy
Strong sellSellNeutralBuyStrong buy
Summary
Neutral
SellBuy
Strong sellStrong buy
Strong sellSellNeutralBuyStrong buy
Summary
Neutral
SellBuy
Strong sellStrong buy
Strong sellSellNeutralBuyStrong buy
Moving Averages
Neutral
SellBuy
Strong sellStrong buy
Strong sellSellNeutralBuyStrong buy
Moving Averages
Neutral
SellBuy
Strong sellStrong buy
Strong sellSellNeutralBuyStrong buy
Frequently Asked Questions
An exchange-traded fund (ETF) is a collection of assets (stocks, bonds, commodities, etc.) that track an underlying index and can be bought on an exchange like individual stocks.
SOLZ trades at 19.54 USD today, its price has risen 3.99% in the past 24 hours. Track more dynamics on SOLZ price chart.
SOLZ net asset value is 19.52 today — it's risen 15.90% over the past month. NAV represents the total value of the fund's assets less liabilities and serves as a gauge of the fund's performance.
SOLZ assets under management is 82.05 M USD. AUM is an important metric as it reflects the fund's size and can serve as a gauge of how successful the fund is in attracting investors, which, in its turn, can influence decision-making.
SOLZ fund flows account for 84.65 M USD (1 year). Many traders use this metric to get insight into investors' sentiment and evaluate whether it's time to buy or sell the fund.
Since ETFs work like an individual stock, they can be bought and sold on exchanges (e.g. NASDAQ, NYSE, EURONEXT). As it happens with stocks, you need to select a brokerage to access trading. Explore our list of available brokers to find the one to help execute your strategies. Don't forget to do your research before getting to trading. Explore ETFs metrics in our ETF screener to find a reliable opportunity.
SOLZ invests in funds. See more details in our Analysis section.
SOLZ expense ratio is 0.95%. It's an important metric for helping traders understand the fund's operating costs relative to assets and how expensive it would be to hold the fund.
No, SOLZ isn't leveraged, meaning it doesn't use borrowings or financial derivatives to magnify the performance of the underlying assets or index it follows.
Yes, SOLZ pays dividends to its holders with the dividend yield of 1.13%.
SOLZ trades at a premium (0.09%).
Premium/discount to NAV expresses the difference between the ETF’s price and its NAV value. A positive percentage indicates a premium, meaning the ETF trades at a higher price than the calculated NAV. Conversely, a negative percentage indicates a discount, suggesting the ETF trades at a lower price than NAV.
Premium/discount to NAV expresses the difference between the ETF’s price and its NAV value. A positive percentage indicates a premium, meaning the ETF trades at a higher price than the calculated NAV. Conversely, a negative percentage indicates a discount, suggesting the ETF trades at a lower price than NAV.
SOLZ shares are issued by Corpus Partners LLC
SOLZ follows the No Underlying Index. ETFs usually track some benchmark seeking to replicate its performance and guide asset selection and objectives.
The fund started trading on Mar 20, 2025.
The fund's management style is active, aiming to outperform its benchmark index by actively selecting and adjusting assets. The goal is to achieve returns that exceed those of the index the fund tracks.