TSLA Golden Zone Test: Cup & Handle Breakout Ahead?📊 Market Breakdown
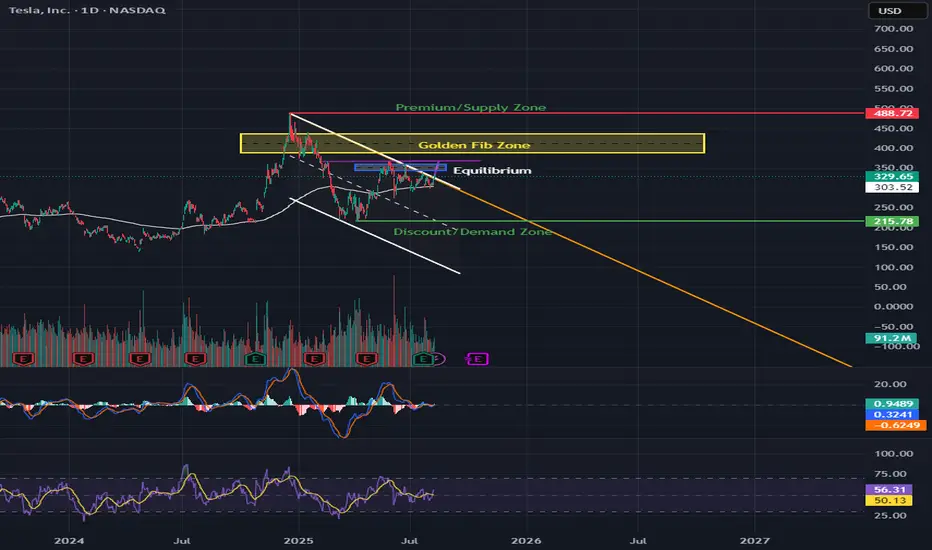
TSLA is trading at $329.65 and is caught between major zones — the Golden Fib Zone ($365–$385) above and the Equilibrium ($294) below.
Trend: Price recently broke out of a descending trendline but is still inside a bigger channel.
Pattern Watch: There’s a potential cup & handle forming. If confirmed, this could be the fuel that launches us toward the $365–$385 resistance area.
Momentum: MACD is flattening near zero (possible bullish crossover brewing), and RSI at 56 gives us room to push higher before overbought territory.
🛒 CALLS (Bullish Scenario)
Buy Zones:
🎯 Aggressive Entry: Bounce from $320–$325 support
✅ Confirmation Entry: Daily close above $340 with strong volume
Take Profits:
1️⃣ $365 – First target at the start of Golden Fib Zone
2️⃣ $385 – Fib Zone top and key resistance
3️⃣ $488 – Long-term premium/supply zone
Stop-Loss: $315 (just below recent support)
Why This Works: A breakout above $340 also breaks the handle of the cup, unlocking room to run toward $365+.
🛑 PUTS (Bearish Scenario)
Sell Zones:
🚨 Rejects $340 resistance with heavy selling
📉 Breakdown and daily close under $315
Take Profits:
1️⃣ $294 – Equilibrium
2️⃣ $250 – Key psychological level
3️⃣ $215–$220 – Discount/Demand Zone
Stop-Loss: $330 (above rejection point)
Why This Works: A failed breakout with a close under $315 breaks short-term bullish structure, opening the door for a drop back toward $294 equilibrium.
🔍 Technical Highlights
Cup & Handle Potential: Neckline around $340; break = bullish continuation.
EMA 200 ($219.82): Still far below, showing this is more of a swing/mid-term momentum play.
Volume: Recent spikes suggest institutions are active at these levels.
Macro Watch: TSLA moves with tech sentiment; keep an eye on NASDAQ trend.
⏳ Option Expiration Strategy:
1 Week: For quick bounce or rejection plays at $340
2 Weeks: Breakout targeting $365
3 Weeks: Full push toward $385–$488 supply zone
TSLA trade ideas
TESAL HEADING TO $500+ RANGE ANALYSIS HERE Afternoon Trading Fam
So here is our in-depth look at Tesla: Currently the monthly trend is bullish giving us levels of $500 and above.
Locally though we can break this $338 top expect to see $444 and $480 getting hit next
If we need to correct and we break the lows of $319 expect to see the levels of $307 then $301 being hit
Happy Trading
Trade Smarter Live Better
Kris

Trading TSLA1:39 am 8/8/25Bullish Entry: 324.00 / 328.00 Bullish Stop 330.00 Bullish Target 330.00
Bearish Entry: 318.00 / 316.00 Bearish Stop 321.50 Bearish Target 312.00.....................Note: Supply zone 335.50/338.00

TSLA pivot points suggesting imminent breakoutTSLA is in a tightening pattern, which can of course break either bullish or bearish. given the overall trend and market conditions, I have a bullish lean on it. After doing some pivot point analysis this evening I have shifted the bull break odds even higher in my mind, and not only that, I believe the bull break may be imminent this week.

TSLA: 321.20Bullish Entries: 322.00 / 323.00 (high activity) Target:
328.00 / 330.00 Stop:
319.00 TSLA needs to close the earning gap at 332.69. Its continuation price of 332.00/336.00 is within the supply zone. Be very careful.

TSLA WEEKLY OPTIONS SETUP
### 🚗 TSLA WEEKLY OPTIONS SETUP (2025-07-28)
**Big Call Flow. Low VIX. Can Bulls Hold \$325?**
---
📊 **Momentum Overview:**
* **Daily RSI:** 48.2 🔻 → *Neutral-to-Weak*
* **Weekly RSI:** 57.1 🔻 → *Still bullish zone, but falling*
⚠️ **Interpretation:** Momentum is softening, trend in question.
📉 **Volume Context:**
* **Volume Ratio:** 1.3x ⬆️ (vs. last week)
* **Price Change:** -0.77% despite that volume
🔍 *Distribution Alert:* Institutions may be selling into strength.
📈 **Options Flow:**
* **Call/Put Ratio:** **1.70** = 🚨 *Bullish flow confirmed*
* **Volatility (VIX):** 15.16 🟢 Favorable for directional plays
✅ Strong setup for options traders riding short-term momentum
---
### 🧠 **Weekly Sentiment Scorecard:**
* ✅ **Bullish Signals (2):** Options Flow, Volatility
* ⚠️ **Neutral Signals (2):** Daily & Weekly RSI
* ❌ **Bearish Signal (1):** Volume pattern = distribution risk
**Overall Bias:** 🟢 *Moderate Bullish*
---
### 🔥 **TRADE SETUP IDEA:**
🎯 **Strategy:** Long Call Option
* 📌 **Instrument:** TSLA
* 💵 **Strike:** \$355C
* 📅 **Expiry:** Aug 1, 2025
* 💸 **Entry:** \~\$0.75
* 🎯 **Profit Target:** \$1.50
* 🛑 **Stop Loss:** \$0.45
* 🔒 **Key Support to Watch:** \$327.50 — lose that = exit fast
📈 **Confidence Level:** 65%
⚠️ **Gamma Risk:** High → trade small, manage tight.
---
### 📦 TRADE\_DETAILS (JSON Format for Algo/Backtest):
```json
{
"instrument": "TSLA",
"direction": "call",
"strike": 355.0,
"expiry": "2025-08-01",
"confidence": 0.65,
"profit_target": 1.50,
"stop_loss": 0.45,
"size": 1,
"entry_price": 0.75,
"entry_timing": "open",
"signal_publish_time": "2025-08-01 09:30:00 UTC-04:00"
}
```
---
### 🧭 **Quick Notes for Traders:**
* ✅ Bulls have short-term edge — but **momentum is fading**
* ⚠️ If TSLA breaks below **\$325**, exit fast.
* 🔍 Watch for fakeouts: options flow is bullish, but volume says “not so fast.”
---
📊 TSLA \$355C → Risk \$0.75 to potentially double 📈
💬 Will this hold, or is it a bull trap before a dump? 👀
Comment below ⬇️ and follow for Monday updates!
---
**#TSLA #OptionsFlow #WeeklyTrade #TradingSetup #GammaRisk #AITrading #TeslaStock #UnusualOptionsActivity #SmartMoneyMoves**

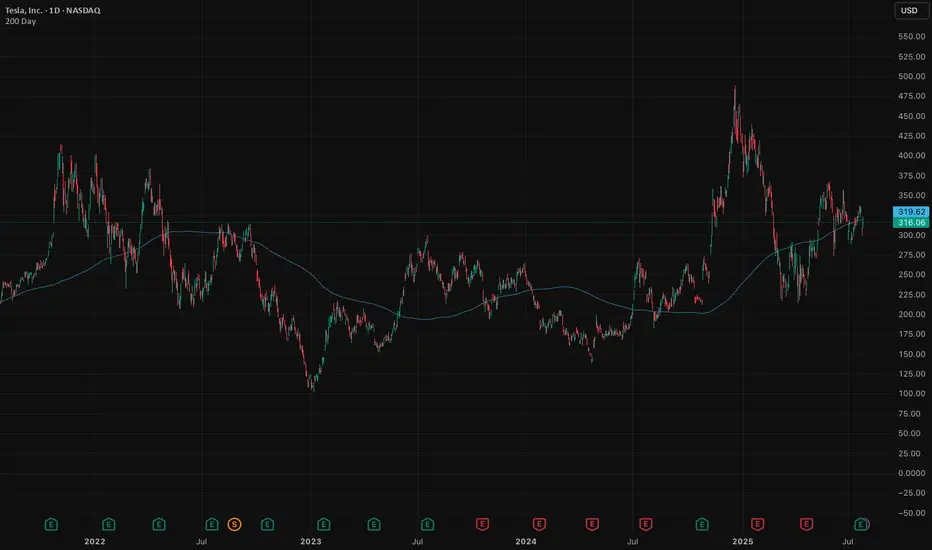
Tesla in the waiting room as revenue slidesTesla is a global innovator that is changing the world. As a general rule, many investors have a saying: Never bet against Elon. They're not wrong. Elon delivers. But the short term is messy.
The stock is hovering around its 200-day moving average, a critical test. Break lower and we could see $290, maybe $260. That’s not panic, it's just price catching up to reality.
The auto business is deep in a downcycle. Q2 deliveries fell 14%, with revenue down 12%. Profits squeezed. Classic cyclical move. Nothing new here. But it’s weighing on momentum.
The upside isn’t about cars, it's autonomy, robotaxis, AI (Grok in cars). That’s where Tesla becomes a $2 trillion company. Musk knows it and is building for the future (100,000 GPU super cluster). He’s already shifting the story.
But that future is 6–12 months out, maybe longer.
In the meantime, we sit in the waiting room. Auto volumes need to stabilise. Robotaxi needs scale. Optimus requires proof and some definitive timeframes to get the market excited. That creates a 3–6 month narrative gap. Markets hate gaps.
Earnings last week were among the softest (though expected). EPS fell 23%. Free cash flow almost vanished. No real catalysts until next quarter. If the broader market sells off, which looks likely, Tesla takes more heat.
But let’s not lose the plot. Tesla is still Tesla. Long-term vision remains. Musk’s execution record is unmatched. Bet against him and you lose, eventually.
Short term, expect weakness. Patience required. If the stock breaks $315 with conviction, we’d expect further weakness before the real upside re-emerges.
Wait, watch, then pounce.
The forecasts provided herein are intended for informational purposes only and should not be construed as guarantees of future performance. This is an example only to enhance a consumer's understanding of the strategy being described above and is not to be taken as Blueberry Markets providing personal advice.
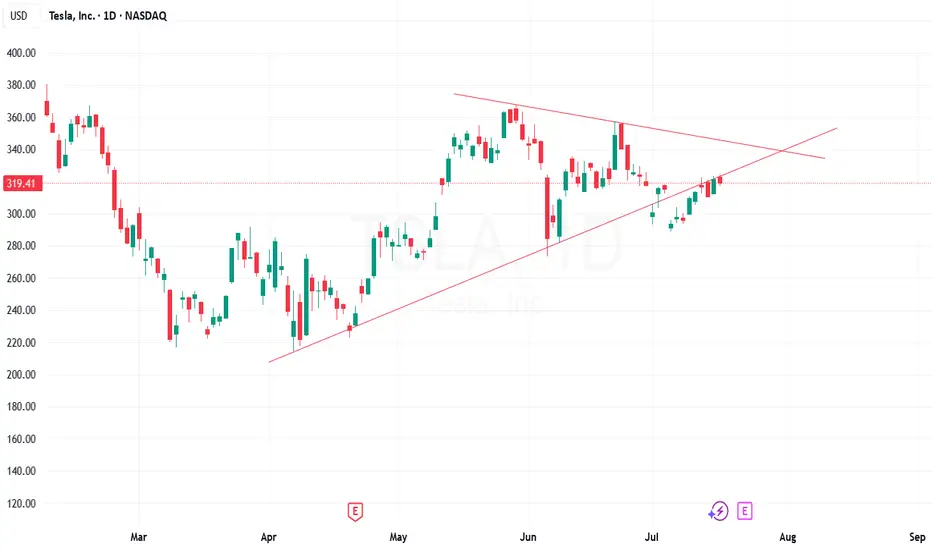
Inflection point"Tesla is at a binary point on the chart. The stock is wedged tightly between the red, downward-sloping resistance line (upper boundary) and the green, upward-sloping support line (lower boundary)—the classic apex of an asymmetrical triangle.
At this stage:
A breakout above the red resistance would be a clear bullish signal, potentially starting a new upward trend.
A rejection at resistance and breakdown below the green support would signal bearish momentum, with likely downside toward lower Fibonacci levels like 272.77 or 213.97.
With price at this inflection zone, the next decisive move—either up or down—will likely define Tesla’s short-to-medium-term trend. This is a textbook example of a binary technical situation: whichever direction is confirmed next, that’s likely to dictate the coming weeks' price action." (Some help from Perplexity)
$TSLA is in an accumulation phase.A classic Wyckoff scenario is playing out, offering a prime opportunity if you have the nerve for it.
Support: The key support zone is $300 - $305. As long as this holds, the bullish thesis is intact.
Resistance: The primary target is the top of the multi-month accumulation range, around $370 - $380. A breakout above this would signal the start of a major new markup phase.
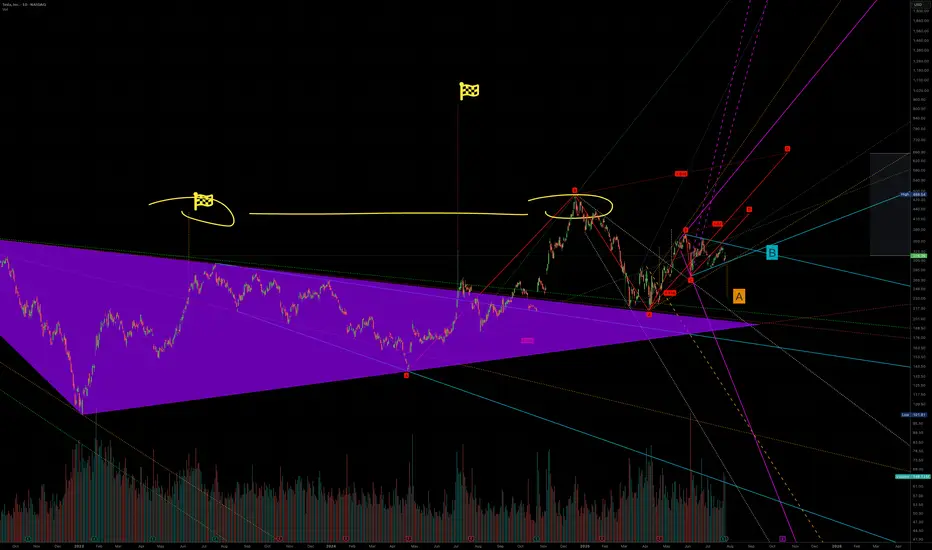
A to 236 or B killing A to 420Tesla is one of those stocks that is heavily manipulated algorithmically. When we were in an uptrend and needed a little push, a large fractal was created that could break a previously formed structure which should have taken us to $236(A). Interestingly, a very strong symmetrical triangle has emerged, influencing this upward movement, and the final price—due to some mystical reason—seems to be $420(B). It’s also worth noting that this whole move is being influenced by another similar structure whose target is above $600. So, if we analyze everything that’s happening, a 12% drop in sales means nothing compared to what Tesla will gain from robots, restaurants, and robotaxis, which I call RRR
CUP AND HANDLE $TSLA TO $515 MINIMUMThe cup and handle is a bullish chart pattern commonly used by traders to spot potential buying opportunities. It features a rounded "cup" formation followed by a slight downward drift forming the "handle." This pattern typically signals a continuation of an upward trend once the handle completes its consolidation phase.
ROBOTAXI BOOM
BUY NOW NASDAQ:TSLL NASDAQ:TSLA

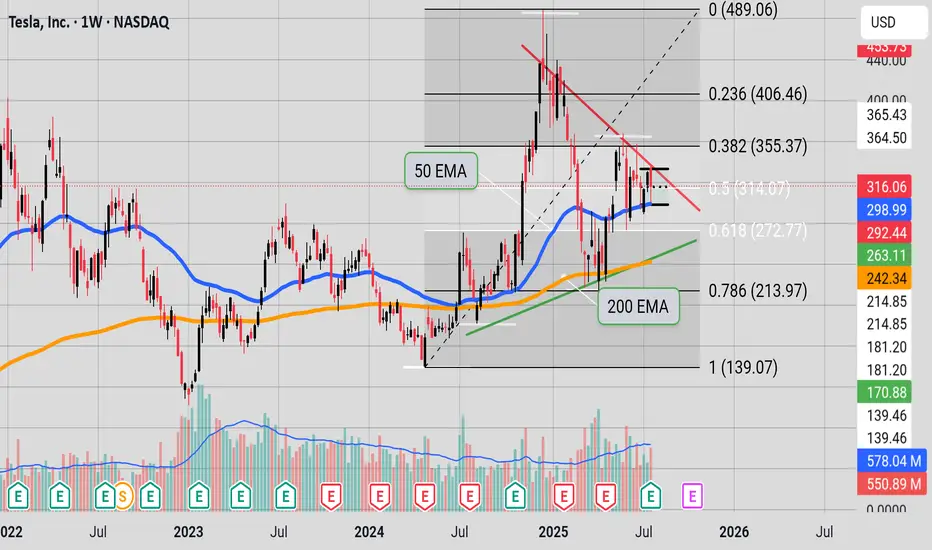
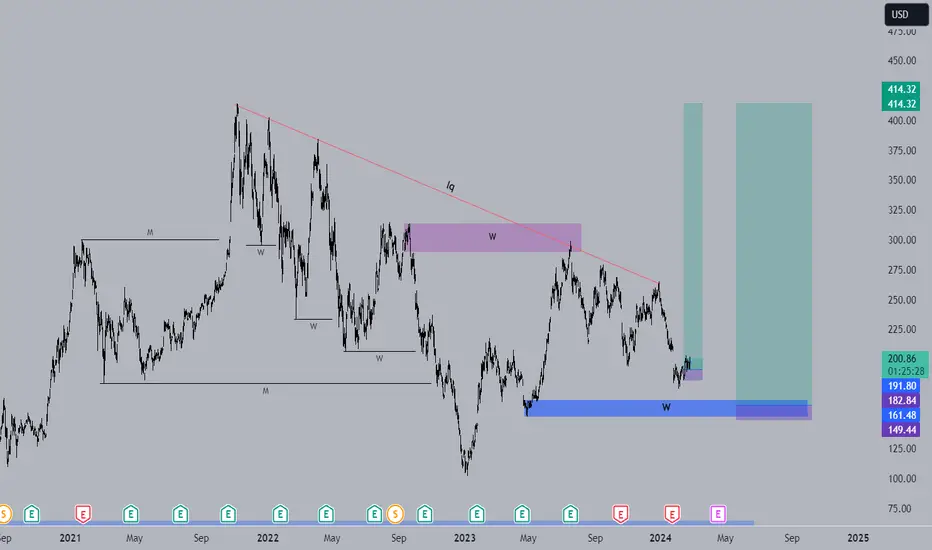
Cup & HANDLE + Mini Double Bottom: $TSLA to $610 ScenarioI maintain a bullish stance on Tesla ( NASDAQ:TSLA ), supported by a compelling combination of technical patterns and strong fundamental drivers. The current chart setup reveals a Cup and Handle formation complemented by a Mini Double Bottom, both of which are classic bullish continuation patterns. These suggest a potential breakout scenario that could drive NASDAQ:TSLA to $610 by year-end.
Technical Roadmap:
Gap Fill to $408: Anticipated earnings momentum, particularly from the Robotaxi segment, is likely to propel the stock to fill the previous gap at $408.
Consolidation at $450: Following the gap fill, I expect a consolidation phase forming a “box” around the $450 level.
Breakout to $610: A decisive breakout above $450 could trigger a strong rally toward the $610 target.
***Current Key Catalysts Supporting the Bullish Thesis:
Robotaxi Expansion: Tesla’s autonomous driving initiative is gaining traction, with Robotaxi developments expected to significantly boost revenue and margins.
India Market Entry: Tesla’s upcoming launch in India opens access to one of the world’s largest and fastest-growing EV markets.
In-House Chip Development & Dojo 2 Expansion: Continued investment in AI infrastructure and custom silicon enhances Tesla’s competitive edge in autonomy and robotics.
Tesla Diner Launch: The near-completion of Tesla’s themed diner adds to brand visibility and customer engagement.
Global EV Adoption: Tesla continues to benefit from rising EV demand across multiple international markets.
Optimus Robot Hype: Growing interest in Tesla’s humanoid robot project could unlock new revenue streams and investor enthusiasm.
Favorable Macro Trends: A declining interest rate environment supports higher valuations for growth stocks like Tesla.
Institutional Accumulation: Recent trading activity suggests that institutional investors are accumulating shares within the current range.
Grok AI Integration: The integration of Grok AI into Tesla vehicles could enhance user experience and differentiate Tesla’s infotainment ecosystem.
Investment Strategy:
I recommend initiating or increasing exposure to NASDAQ:TSLL (leveraged Tesla ETF) ahead of the upcoming earnings report. This could offer amplified returns if the bullish scenario plays out. Consider accumulating further on any dips, particularly during the consolidation phase around $450.
BUY NOW NASDAQ:TSLA NASDAQ:TSLL

Next Volatility Period: Around August 21
Hello, traders.
Please "Follow" to get the latest information quickly.
Have a nice day today.
-------------------------------------
#TSLA
We need to see if it is rising along the rising channel.
The key is whether it can rise with support near 311.48 to break out of the downtrend line.
The key is whether it can rise along the short-term uptrend line and break through the short-term downtrend line after passing through this volatility period around July 25.
Therefore, we need to see whether it can rise above the 347.21-382.40 range with support near 311.48.
The next volatility period is expected to be around August 21.
-
The important thing is to maintain the price above the M-Signal indicator on the 1M chart.
If not, there is a possibility of a long-term downtrend.
Therefore, if it shows support in the 268.07-311.48 range, it is a time to buy.
-
Thank you for reading to the end.
I hope you have a successful trade.
--------------------------------------------------

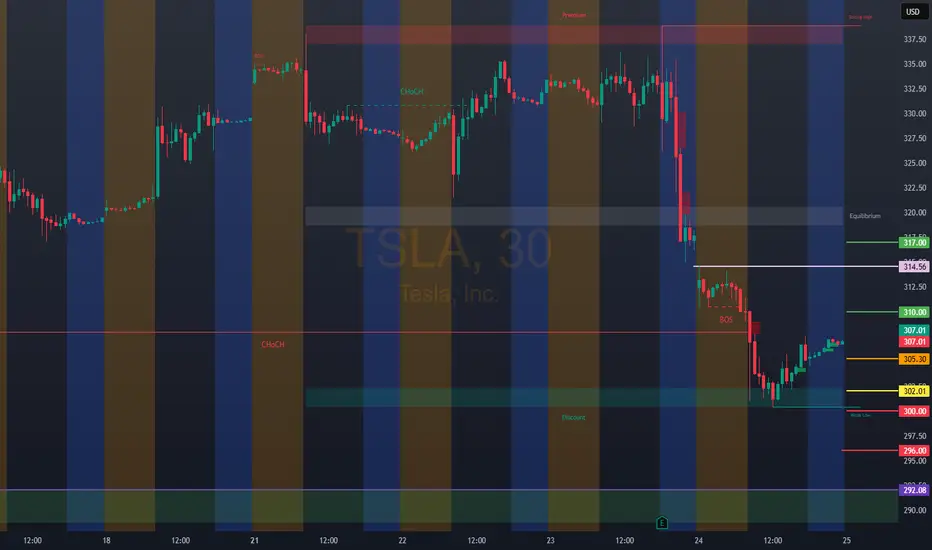
TSLA: 305.30
This idea is supported by entry price and institutional rebound.
Strong institutional breakout. Bullish Entry 2 — Institutional breakout + momentum.
Entrada: 310.00/317.00
SL: 308.00
TP1: 314.00
TP2: 316.00
Bearish Entry 2 — Strong institutional breakout
Entry: 300.00
SL: 302.00
TP1: 296.00
TP2: 292.00
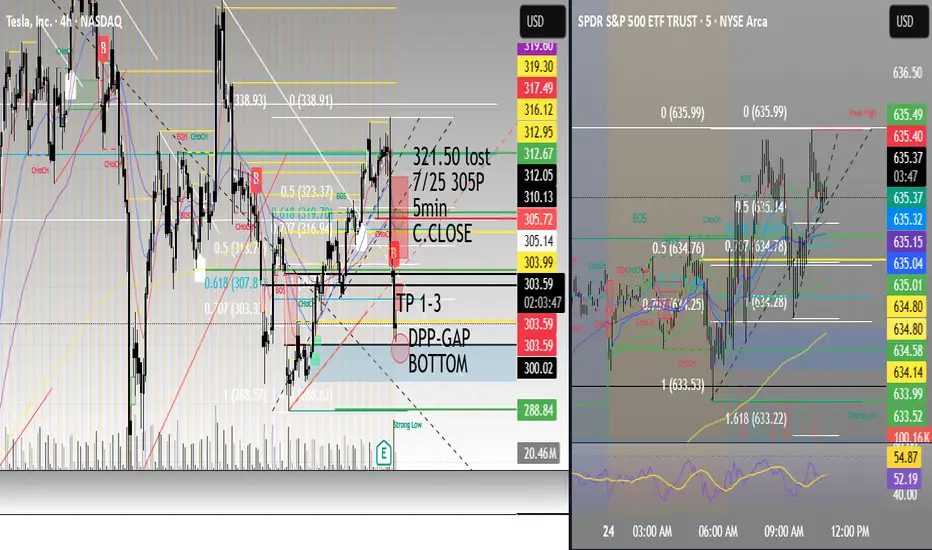
Two Trades to go Bullish on TSLAHello, I’m The Cafe Trader.
We’ve been tracking the MAG 7, and Tesla is the next focus for our short-term options or swing trade strategy.
I’m looking at two scenarios that are likely to play out with TSLA over the next few weeks.
For fundamental and long-term analysis, check my other article on TradingView.
⸻
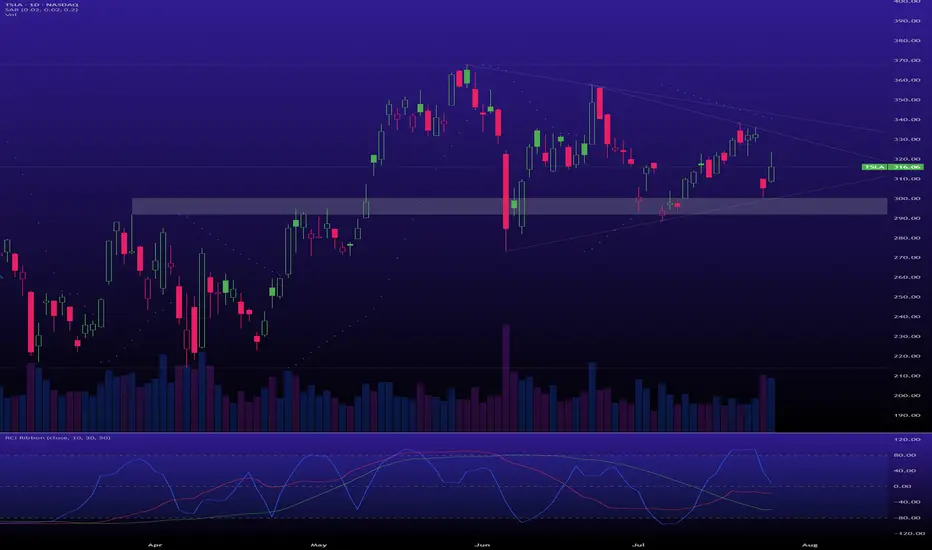
Even though we’re sitting near the middle, bulls have just pushed into a bearish liquidity level (marked “Bottom of Supply”). We don’t know how much supply is left here, but the fact that bulls are pressing in suggests the bears are losing steam. This doesn’t mean price won’t pull back—it just means bearish follow-through may be weaker.
With that in mind, here are the two main scenarios:
⸻
1. Green Arrow — Bullish Test of Sellers
– Stock
If bulls keep the pressure on, we may see a test of the “Big Sellers” zone. The reaction there will tell us a lot.
If we see a sharp rejection (a quick tag followed by a flush) or a fake breakout that reverses, I’d approach longs more cautiously.
However, an aggressive entry long around the “Top of Demand” (around $321) could make sense, especially considering how buyers have been stepping in. This setup is primed to retest highs.
– Options
Pricing will be key here—especially post-earnings (EOD).
I’d look 2 weeks out. If you can snag a 335C for $5.00–$7.00, that’s solid.
Target profit would be into the Big Sellers zone. If we get a strong move before then that nets 3R–5R, I’d take it.
⸻
2. Red Arrow — Bearish Reaction + Big Buyer Support
– Stock
If earnings disappoint, we could see a shift in momentum. That said, big buyers should step in around $295.
This is actually the more likely scenario in my view.
From there, I’d look for a swing back up into the 330–350 range.
We’ll need to see how sellers handle the drop—are they aggressive, or is it just a lack of buyer interest?
Either way, this could align well with long-term buy zones.
– Options
On a flush to $295, I’d look for 3–5 day expiration calls around the 305 strike. @ a price between $1.50–$1.70 (look for 2-3R)
After the bounce, I’d expect a pause or retest of the uptrend line.
Then I’d look 2–3 weeks out for the 325C or 330C, ideally between $3.00–$5.00.
I’ll keep an eye on option pricing and update if we reach that level.
⸻
That’s all for short-term TSLA.
Follow for more charting and trade ideas.
📲 @thecafetrader

Bitcoin, SPX, Ethereum, Tesla: Whats Next? BTC appears to be showing distribution signs.
I do believe BTC local top is in, but alt coins like Ethereum can still push a bit higher.
Ethereum short around 3900-4000 looks promising
Tesla fell sharply on the back of cash flow burn and expenditures.
Investors are also fearful of sales decline and loss of EV credits.
SPX hit major long term resistance today. Coupling this with a depressed Vix we are likely setting up for a pullback in the market.
Small caps saw distribution today on the back of rising yields. A failed breakout observed on IWM chart.

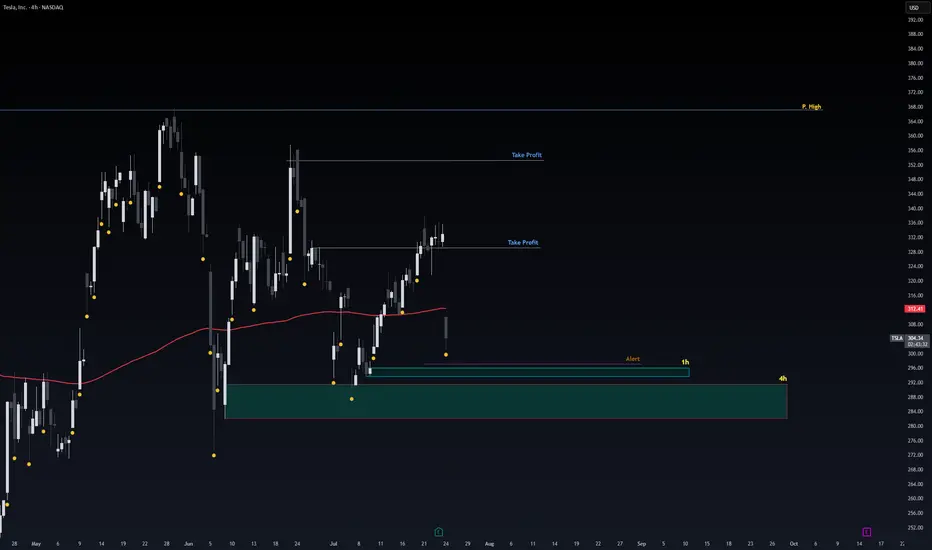
Safe Entry Tesla1h & 4h Green Zones are safest entry Zones.
Stop loss Below.
Note: 1- Potentional of Strong Buying Zone:
We have two scenarios must happen at The Mentioned Zone:
Scenarios One: strong buying volume with reversal Candle.
Scenarios Two: Fake Break-Out of The Buying Zone.
Both indicate buyers stepping in strongly. NEVER Join in unless one showed up.
2- How to Buy Stock (safe way):
On 1H TF when Marubozu/Doji Candle show up which indicate strong buyers stepping-in.
Buy on 0.5 Fibo Level of the Marubozu/Doji Candle, because price will always and always re-test the
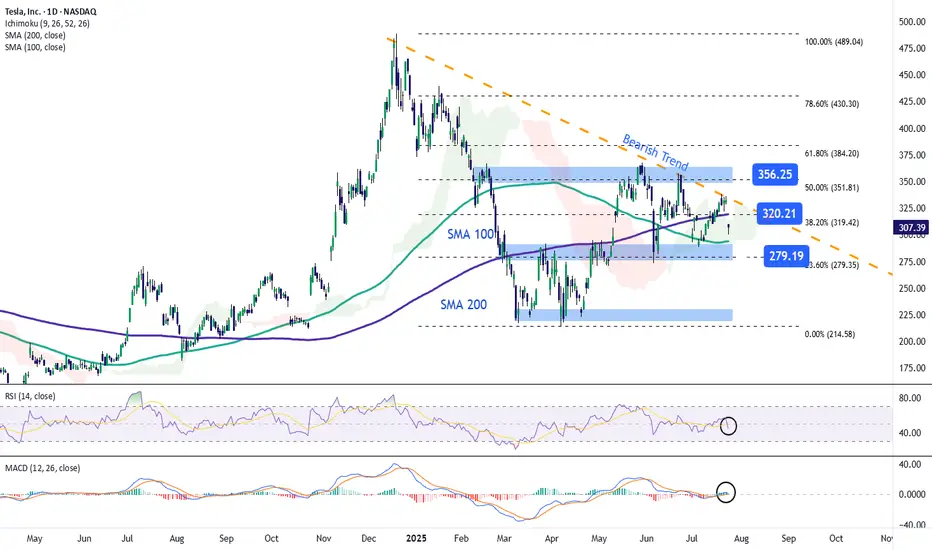
Tesla Stock Returns to the $300 ZoneShortly after reporting earnings, Tesla stock fell more than 9% in the final hours of trading. This new bearish move is mainly due to the company’s earnings per share (EPS) of $0.40, which missed expectations of $0.43, and revenue of $22.5 billion, below the projected $22.74 billion. These figures indicate that Tesla failed to meet market expectations, triggering a sustained downward trend in the stock. This move could extend further unless new catalysts emerge to restore investor confidence.
Downtrend Remains Intact
Recent price action has been clearly bearish and continues to reinforce a downtrend that began forming in late December. So far, there has been no significant bullish correction to challenge this structure, making the bearish pattern the dominant technical setup in the short term.
Technical Indicators
RSI: The indicator remains below the neutral 50 level, suggesting that selling momentum continues to build. If the downward path persists, bearish pressure may grow stronger in upcoming sessions.
MACD: The MACD histogram is currently hovering around the zero line, showing signs of technical indecision. However, if it crosses clearly below zero, it would confirm a more sustained bearish momentum.
Key Levels to Watch:
$356 – Major Resistance:
This level corresponds to the 50% Fibonacci retracement. A break above this zone could threaten the current downtrend.
$320 – Nearby Resistance:
Aligned with the 200-period simple moving average and the 38.2% Fibonacci level, a close above this point could reignite bullish sentiment and trigger a short-term upward move.
$280 – Key Support:
This is a critical support level, aligned with the 23.6% Fibonacci retracement. A breakdown here could extend the ongoing bearish trend.
Written by Julian Pineda, CFA – Market Analyst
TSLA, revenue decline/textbook technical setup.TSLA, revenue decline/textbook technical setup.
Confluence of major levels, how to take a well defined short trade with puts.
Clean as it gets.
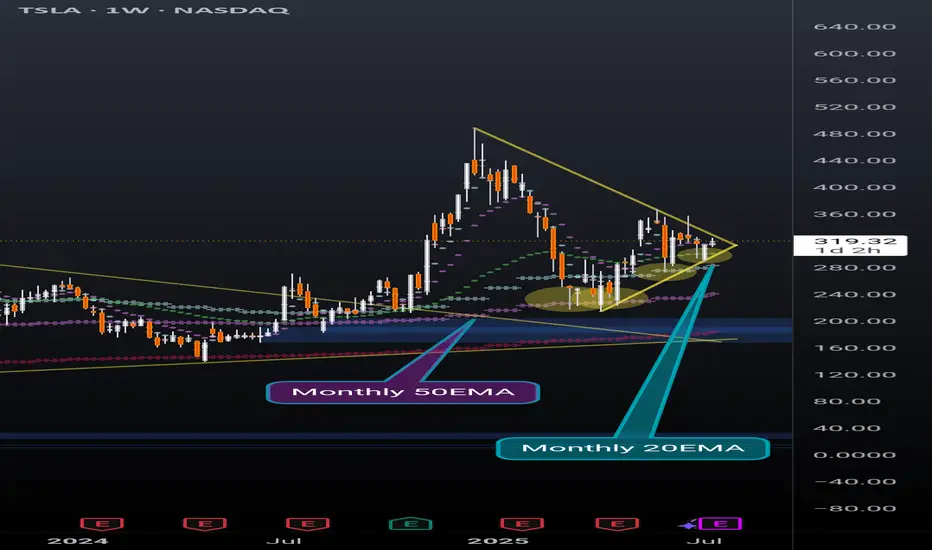
TSLA weekly coiling into something powerfulNever doubt the power of TSLA. Recently broke out of a huge pennant, and now nearing the end of another pennant while simultaneously holding support above the daily 20EMA(overlayed on this weekly chart).
Also recently found support off of the monthly 20EMA (overlayed on this weekly chart) and took 2 direct hits on the monthly 50EMA (overlayed on this weekly chart) before that and rallied up. It will take a lot to crush this setup but anything can happen. Possibly a longer pennant formation.
I'm just a cat not a financial advisor.
TSLA Honey Ticking Bull Trap! UPDATE 1This is an updated chart, as I keep being prompted to reach "My Target" by TV.
No matter how bad things get for Elona and TSLA, there are always people who are willing to pile in and buy at any price. The problem is the chart is showing lower highs, as TSLA no longer attracts the people needed to boost price, just like TSLA the brand. As a result, people keep getting honey ticked.
Don't Get HONEY TICKED!
As I always say, never EVER!! Invest in toxic people like Elona. They always blow themselves up in the end. It's in their nature!
Click Boost, Follow, subscribe, and let's reach 5,000 followers. ;)

Expected to go in Bearish Mode - Keep watchDaily candle clearly says, retracement from the triangle breakout line completed. It showing as reversal.