TSSI Swing tradeReasoning:
Bouncing off a rising 30Week MA
Strong relative strength
Swing Traders (2-6 Week Holds)
Buying rule : Watch out for a buy stop, this helps avoid fake moves!
Entry: Full position on breakout
Profit Taking: Sell 1/3 at Goal 1
Final Exit: Remainder at Goal 2
Selling is done partially because we never know what is going to happen, so sell as money goes in your favor - Mark Douglas
Market insights

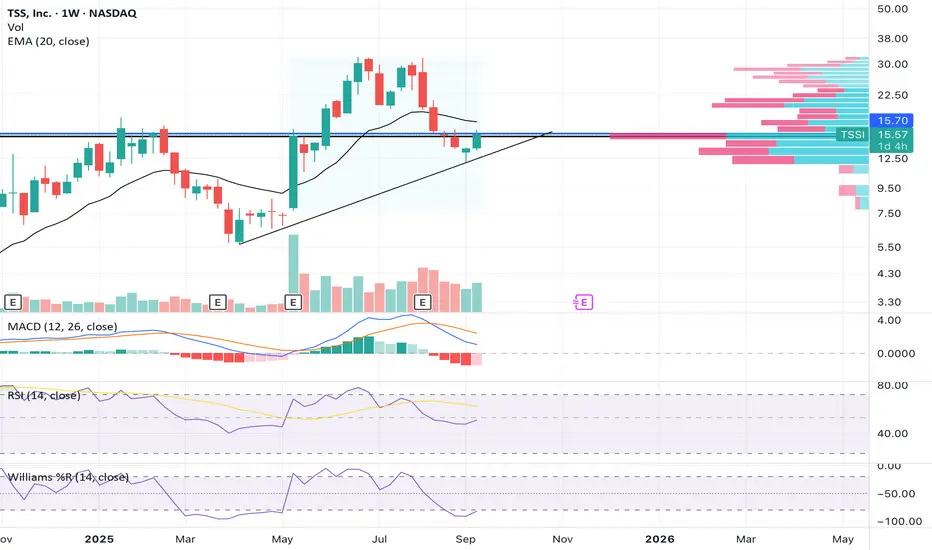
TSSI: breakout watchAlot of things starting to look good on the weekly and really like the space. RSI and Williams% starting to tick higher, volume shelf which coincides with the support/resistance flip zone being tested, hammer candle at the trendline last week and a theme thats 'in play'. MACD could look better although the histogram is narrowing. Expect some rightward chop before a break above SR/volume shelf. It's early, so just a starter position.
Also, doesnt seem to be on many radars.
TSSI BACK TO 28 BY 2026 Why TSS, Inc. (TSSI) Could Rocket Back to $28 by 2026: AI-Driven Bull Case TSSI’s trading at $18.38 today (Sep 23, 2025, per the finance card above), down from its $31.94 year-high, but with explosive AI infrastructure demand and a Dell partnership, $28 (52% upside) by EOY 2026 is in sight. Here’s the catalyst-fueled case:AI Boom & Dell Contract: Q2 '25 revenue soared 520% YoY to $62.8M, driven by a multi-year Dell deal for AI server racks. Procurement segment (80%+ revenue) eyes $200M+ in '26, with Georgetown facility scaling output. Analysts project 50% YoY growth to $220M+, pushing EPS to $0.15–$0.20.
Analyst Upgrades & Targets: Roth MKM and Singular rate "Buy" (Sep '25), with consensus PT $16.50–$22 (20–60% upside). Walletinvestor forecasts $20.40 by Jun '26, but Reddit bulls and Intellectia eye $30–$81 on 2x sales valuation, hitting $28 easily.
Technical Breakout: The finance card above shows TSSI above its 200-day MA ($13–$14 range), with RSI (35.28) neutral, poised for a momentum flip. Weekly MACD signals bullish crossover, and $18 support holds firm. Break above $20 resistance targets $28, per TradingView’s setup.
Market Tailwinds: $1T AI/data center market by 2030 fuels TSSI’s niche in systems integration. $20M debt financing (Jul '25) funds capacity, with NASDAQ uplisting boosting liquidity. Volatility (13.35%, beta 4.28) risks dips, but $150M shelf offering signals growth bets.

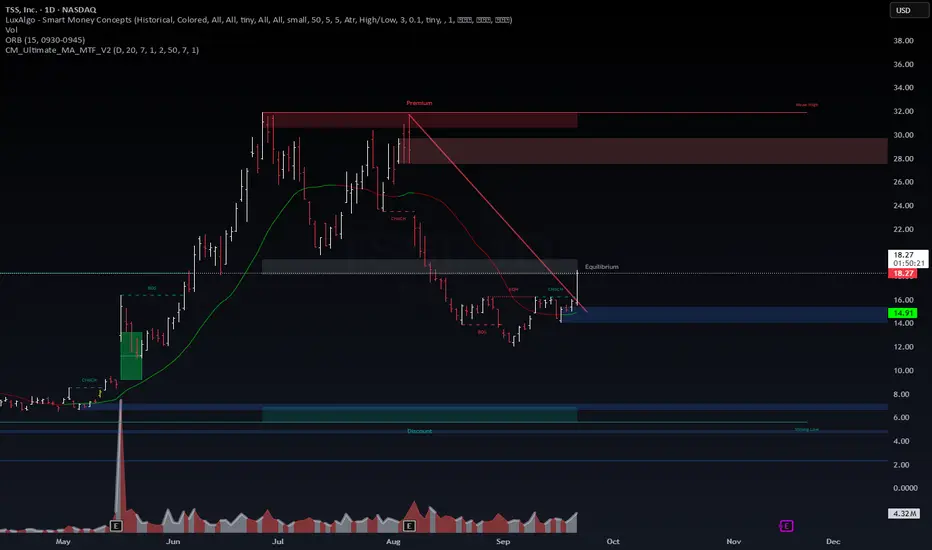
TSSI: Another Breakout in the market's I am finding plays!NASDAQ:TSSI | Daily – Decision at the downtrend line
Context: Multi-week downtrend (lower highs/lows). Recent bounce off demand 14.9–14.0; price now testing the descending trendline into a light supply / equilibrium area.
Resistance / supply: 18.8–19.6 (trendline confluence), 22.0, 27–29, then 31–33 (weak high).
Support / demand: 16.0, 14.9–14.0 (key), then 12.0; deeper pocket toward 8–9 if momentum breaks.
Bull path: Daily close > 19.0 with rising volume and hold → targets 22 then 27–29.
Bear path: Rejection at the trendline → 16.0 → 14.9–14.0 retest; breakdown <14 opens 12.
Plan: I’ll wait for a daily confirmation; risk ≤1% per idea, targets ≥2R. No chasing into supply.
Original technical analysis; no external sources (APA 7: N/A). Not financial advice.
Thoughts on TSSIHere's a short video on TSSI on my view and thoughts from a swing trading view and also an investing view. Hope you find value in it. Thanks!!

Potential 23% Move in TSSIThere is a high change of reversal in TSSI. This is due to a number of factors:
1. Both the 30min and 150min time frames are showing that the price is overextended to the downside on the custom Data Distribution script. (Yellow dots)
2. The custom USI script has shown a buy signal on the 30min chart. (Background changed to green)
3. There was a good reversal candle on the 30min chart.

TSSITSSI had the last two months of fantastic price gains and could be a little overbought now. Looking for a small pull back before the next setup signal.

New Setup: TSSITSS, Inc., a dynamic player in the IT sector, recently turned profitable and now trades at 1.6% below its estimated fair value. With a $20 million credit facility secured for expanding AI-enabled technologies and added to major indices like NASDAQ Composite, TSS seems poised for growth.

TSSI to $81 or higherOverview
Total Site Solutions, Inc. ( NASDAQ:TSSI ) is an information technology company that provides software and services to its clients. They are involved in the setting up, maintenance, and deployment of various technological hardwares and softwares that assist their clients in remaining competitive.
Technicals
TSSI is up by 1,257.6% since May 2024. While no substantial trading patterns may be available to assist with navigation, fibonacci retracement levels could help in finding entry and exit points.
If the share price can garner significant support between $11.55 and $12.25 then a potential bull flag may be in development.
Fundamentals
I like to do my research before investing in a company to make sure they are either profitable or have consistent revenue growth, even if the technicals look like a good opportunity at face value. I pulled annual reports as far back as 2020 in addition to reviewing all 2024 quarterly reports. Here is what I found:
Annual Revenue has consistently increased since 2021-Q4 (average annual gain of 16.72%)
Annual Gross Profit has consistently increased since 2021-Q4 (average annual gain of 19.06%)
Annual Net Income has consistently increased since 2022-Q4 (average annual gain of 147.87%)
The annual reports provoke confidence but it was the quarterly reviews that sealed the deal for me. After comparing the accumulative (Nine Months Ended) totals to the 2023 Annual Report, here is what I found:
YTD Revenue has increased by 80.37% since 2023-Q4 Annual Report
YTD Gross Profit has increased by 37.60% since 2023-Q4 Annual Report
YTD Net Income has increased by 5,390.54% since 2023-Q4 Annual Report
Price Target
There are approximately 24,587,000 outstanding shares according to the Q3-2024 quarterly report, leaving the current market cap around $307M. At a modest market cap of two billion then this would leave TSSI's share price near $81.
Now whether or not I would consider selling at this price range is completely dependent on the health of the company at that moment in time. If TSSI can continue its trajectory and growth, then this roller coaster ride could extend beyond the $81 price target.
