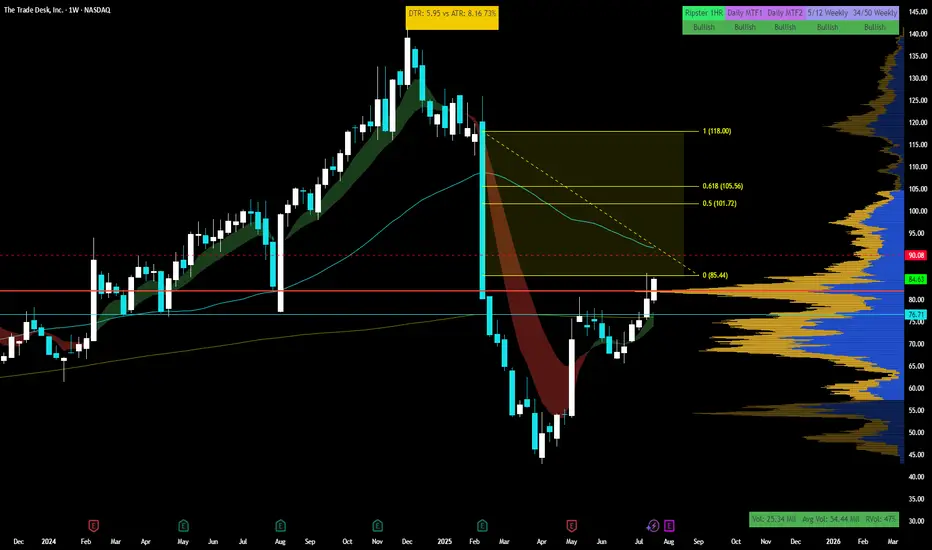
$TTD is ready to move into triple digits - Lock n load Pretty straight forward in the face setup.
Here are pros-
+Got added to s&p500
+massive volume shelf from multi year above 80 which we are above
+beautiful gap from q1 2025 to ride from $85 to $120
++Relative strength strong vs spy for 55 period(thats what I use)
+++ $100 Psych level is a MAGNET - it will pull !!
cons-
-200sma above that cleanlu aligns with a multi month resistance and 0.5 fib from ATH to bottom in april 25
-- If software earnings are poopy then definitely bumpy ride up but all software names and cybersecurity names are all having good chart pattenrs meaning earning is good for q2 and all want to pop
How to play-
+Sized up and risk that gap below neat 21ema
+take 60% off at 200sma + watch behavior if flags next day add back in else ride to the 0.5 fib in the gap
+take 30% off at $100
+ride the rest to $120 or untill 21 breaks
(IF IF IF 9ema holds steady then keep runners)
Today is 7/23/2025 so lets see what tomorrow brings- Good luck if get on the train but manage risk first everything else later !
TTD trade ideas
TTD Oversold Bounce Play — Call Option for Next Week🔥 TTD Oversold Bounce Play — Call Option for Next Week**
The Trade Desk (TTD) is deep in oversold territory (RSI daily 19.6, weekly 33.4) with 3.7x volume surge last week — signaling heavy institutional activity. While the macro bias leans bearish, a speculative bullish flow (call/put ratio 1.42) hints at a potential short-term rebound.
**🛠 Trade Setup:**
* **Instrument:** TTD
* **Direction:** CALL (LONG)
* **Strike:** \$59.00
* **Expiry:** 2025-08-15
* **Entry Price:** \$0.60
* **Profit Target:** \$1.20 (2x gain)
* **Stop Loss:** \$0.36
* **Size:** 1 contract
* **Entry Timing:** Market open
* **Confidence:** 65%
**📊 Key Factors:**
* Extreme oversold conditions
* Surge in weekly volume
* Speculative bullish options flow
* Risk of counter-trend move against broader bearish trend
**⚠ Risks:**
* Strong longer-term bearish momentum
* Low open interest = high volatility in premiums
---
**#TTD #TheTradeDesk #OptionsTrading #CallOptions #WeeklyOptions #OversoldBounce #BullishSetup #RSI #TechnicalAnalysis #TradingView #VolatilityPlay #SwingTrade #OptionsStrategy**

TTD crashIn the long term, this stock is in a side cycle and after seeing the top, it starts moving towards the bottom and goes through the natural market cycle, but very fast and intense.
The first support area for this stock is $48-50 and if it encounters strong buyers, it will move towards $69 and after correction to $125-127.
But if the bottom area is broken correctly, the target of this big and fast drop will be a price return to 19.
Be with me to enter and exit on time
Every boost and follow is a double motivation to continue

I'm ready to size up TTDIf you've been following me you know i've got TTD at a good price. I'm ready to size up position if we get a sell off in the next few weeks. The 9 take profit is coming up, sell could come sooner, but i'm looking for a test of previous levels (green horizontals) before the next leg up. I also continue to passively DCA into this.

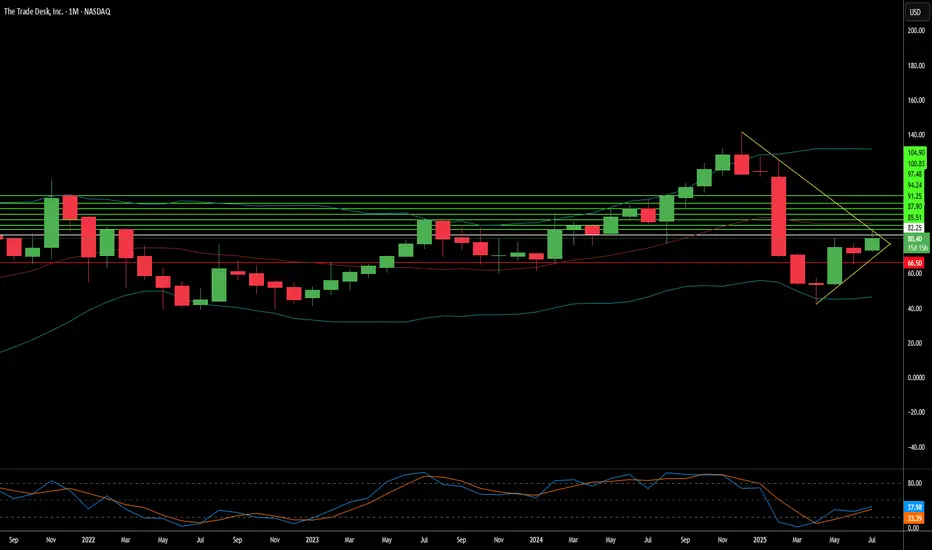
breakdown of TTD monthly chartPotential Target Levels
If bullish momentum continues:
First target: $60.09 (minor resistance before 0.382 Fib)
Second target: $64.51 (Fib 0.382 + close to SMA 20)
Third target: $74.89 (Fib 0.5, major resistance zone)
Extended target: $86.93 (Fib 0.618)
If bearish reversal occurs:
Support 1: $53.64 (Fib 0.236 + SMA 100)
Support 2: $50.70–$49.99 (SMA 50 zone)
Support 3: $41.20 (recent swing low)
Given the monthly chart setup, a close above $60.09 with volume could open the door for $64.50+ as the next leg up. But if it fails to hold $53.60, downside pressure may retest the $50 area.

The 5 different types of Professional TradersLearn what each professional trader group trades, how they trade, when they trade and why they trade.
There are:
Sell Side Institution Floor Traders
Buy Side Institution Floor Traders
Proprietary Desk Traders (prop)
Specialist Professional Traders
Independent Professional traders.
Each type of professional trades differently. Each has a different agenda for trading a particular stock.
Sell Side Floor Traders trade short term to generate income for the big Money Center Banks.
Buy Side Floor Traders are long term investors for mutual funds and ETFs and other derivatives and manage the quantity of shares held for all of the 4000 -6000 stocks their Buy Side company is holding.
Specialists usually are trading one stock or an industry.
Independent Professional Traders trade at home for themselves. Most are former Sell Side floor traders. This group is growing in numbers as more floor traders opt to go rouge and trade for themselves.
You need to learn how to identify which professionals are in a stock with tells you the intent of the trade and the probable hold time.
Learn to trade with the professionals rather than against them.

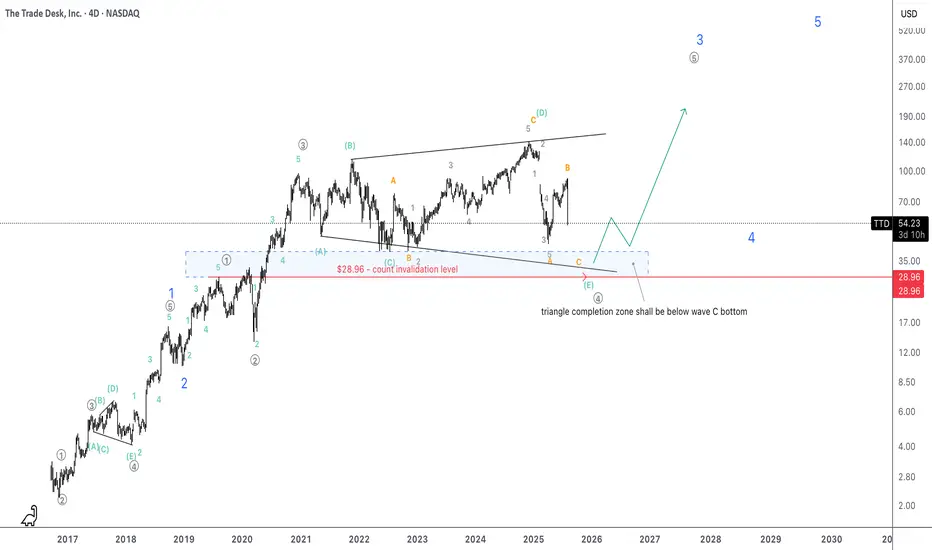
TTD poised to take off as expanding triangle completesIt is magnificent how the current triangle proves EW fractal aspect since there was an expanding triangle at the same wave degree within blue wave 1.
I'd put SL at around $29 where grey 4 (with the current triangles wave E) would overlap grey wave 1.
Magnitude of the unfolding grey wave 5 might be immense if this count is correct.
Short term, TTD, obviously goes further down to complete wave E and I will start buying in the blue area and in the mean tome will monitor 5 wave structure of C of E.
TTD Dropping HaRd / NoT DonE!Because the universe said so... We must be patient, unless executing B Wave for profit.
Note:
40% in oNe DaY!

Attempting to fill up the huge bearish gap - TTD USNASDAQ:TTD has formed a bullish cup and handle and it is confirmed after the stock has broken above the flag/handle. Currently, the stock has closed above the first gap resistance line at US$85.65. Ichimoku shows a clear three bullish golden cross.
Momentum is strong over the long-term after MACD histogram remain positive. Stochastic oscillator has also risen steadily. Directional movement index is strong on the bulls.
Target is at 180.00 over the longer-term period.
The Trade Desk: Why the Sudden Surge?The Trade Desk (TTD) recently experienced a significant stock surge. This rise stems from both immediate market catalysts and robust underlying business fundamentals. A primary driver was its inclusion in the prestigious S&P 500 index, replacing Ansys Inc. This move, effective July 18, immediately triggered mandated buying from index funds and ETFs. Such inclusion validates TTD's market importance and enhances its visibility and liquidity. This artificial demand floor, coupled with TTD's $37 billion market capitalization, underscores its growing influence within the financial landscape.
Beyond index inclusion, TTD benefits from a significant structural shift in advertising. Programmatic advertising is rapidly replacing traditional media buying, expected to account for nearly 90% of digital display ad spending by 2025. This growth is driven by advertisers' need for transparent ROI, publishers avoiding "walled gardens" through platforms like TTD's OpenPath, and AI-driven innovation. TTD's AI platform, Kokai, greatly lowers acquisition costs and enhances reach, resulting in over 95% client retention. Strategic partnerships in high-growth areas like Connected TV (CTV) further reinforce TTD's leadership.
Financially, The Trade Desk demonstrates remarkable resilience and growth. Its Q2 2025 revenue growth of 17% outpaces the broader programmatic market. Adjusted EBITDA margins hit 38%, reflecting strong operational efficiency. While TTD trades at a premium valuation - over 13x 2025 sales targets-its high profitability, substantial cash flow, and historical investor returns support this. Despite intense competition and regulatory scrutiny, TTD's consistent market share gains and strategic positioning in an expanding digital ad market make it a compelling long-term investment.
TTD is giving a second chance A few days ago, we mentioned that NASDAQ:TTD could have reached a great buying level around the $44 area. After a recent rally, we’re now seeing a typical bullish continuation pattern. If the flag breaks to the upside, you’ll have a new opportunity to join the upward move.
Once again, a tight stop loss (SL) of 3–4% gives you the potential for a 30% rally. It’s important to consider taking profits before the $100 level, where we see major resistance.

$TTD | Smart Money Accumulation or Just a Dead Cat Bounce?WaverVanir International LLC Analysis
🧠 Weekly Chart | Smart Money Concepts (SMC) | June 25, 2025
After a dramatic markdown, The Trade Desk (TTD) has bounced sharply off a major strong low / demand zone (~$40–$45). We’re currently trading near $69.80, building bullish momentum toward the equilibrium zone at $80.55.
🔍 Technical Highlights:
🔴 CHoCH and multiple BOS confirm prior bearish control.
🟢 Price swept liquidity under March lows — classic smart money accumulation pattern.
🟡 Targeting Equilibrium Zone (~$80.55) → Potential reversal or distribution area.
🔺 Above that, inefficiency exists toward $134.09 Premium Zone — ideal for a liquidity grab.
📉 If rejected, expect another markdown targeting the original discount zone.
🔮 Key Levels:
✅ Support: $45.00 | Strong Low
🎯 TP1: $80.55 | Equilibrium
🎯 TP2: $134.09 | Weak High (Liquidity Zone)
❌ Invalid Below: $37.00
🧠 Possible Catalysts Ahead:
Q2 2025 Earnings (Expected late July) – Guidance revision could be a major driver.
AdTech Sector Rotation – Market rebalancing between Meta, Google, Roku, TTD.
Macro Pressure – Rising rates, liquidity tightening, and ad-spending revisions.
AI Integration Narrative – TTD may get a valuation bump from alignment with AI/ML targeting.
M&A Speculation – Strategic acquisition or partnership in programmatic space.
📌 Summary:
Accumulation appears underway, but SMC tells us to wait for signs at equilibrium and weak high zones. Monitor volume behavior and institutional tracks. Patience and precision will separate traders from liquidity.
#Hashtags:
#TTD #SmartMoneyConcepts #WaverVanir #TradingView #EquilibriumZone #LiquidityGrab #VolumeProfile #MarketStructure #SwyngSetup #AdTech #AIStocks #ProgrammaticAds #Fibonacci #VWAP #TrendReversal

TTD Swing Trade Plan – 2025-06-06🐻 TTD Swing Trade Plan – 2025-06-06
Bias: Moderately Bearish
Timeframe: 5–7 trading days
Catalysts: Weak daily trend, below EMAs, oversold conditions may delay move
Trade Type: Naked put option
🧠 Model Summary Table
Model Bias Strategy Strike Premium Target(s) Stop-Loss Confidence
Grok Moderately Bearish $71 PUT $1.00 +50% –25% 75%
Claude Moderately Bearish $67 PUT $0.93 $2.50 $0.65 75%
Llama Moderately Bearish $67 PUT $0.94 $1.13 $0.47 72%
Gemini Moderately Bullish $75 CALL $1.04 $1.55 / $2.10 $0.50 70%
DeepSeek Moderately Bullish $75 CALL $1.06 $1.60 $0.75 75%
✅ Consensus: Short-term oversold, but longer-term bias remains bearish
⚠️ Disagreements: Bounce vs. continuation; call vs. put structure
🔍 Technical & Sentiment Summary
Trend: Daily/weekly charts bearish (below EMAs); 15m shows divergence
Support Zones: $70.34–$70.68
Resistance / Max Pain: $73.90 and $75
Volatility: VIX at 17.6 – supports risk-taking
News: Neutral to slightly negative; no strong catalyst noted
✅ Final Trade Setup
Parameter Value
Instrument TTD
Strategy PUT (SHORT)
Strike $67
Expiry 2025-06-20
Entry Price $0.94
Profit Target $1.40
Stop Loss $0.65
Size 1 contract
Entry Timing At open
Confidence 75%
💡 Rationale: Daily bearish structure supported by three models. Downside continuation setup if oversold bounce fails to hold $71.
⚠️ Key Risks & Considerations
Short-term bounce may occur from 15m bullish divergence
Max Pain at $75 may cause gravitational upward drift
Liquidity Note: $67 put has low OI and volume → wider spreads
Theta decay increases rapidly next week — act fast if trade stalls
Unexpected news could invalidate bearish setup quickly
📊 TRADE DETAILS SNAPSHOT
🎯 Instrument: TTD
🔀 Direction: PUT (SHORT)
🎯 Strike: $67.00
💵 Entry Price: $0.94
🎯 Profit Target: $1.40
🛑 Stop Loss: $0.65
📅 Expiry: 2025-06-20
📏 Size: 1 contract
📈 Confidence: 75%
⏰ Entry Timing: Open
🕒 Signal Time: 2025-06-06 13:13:23 EDT

Long on $TTD ; It should test 75-80 range- Many good news have come for NASDAQ:TTD in the last 2 weeks and one of that is Judge ruling against Google Ad business which might lead to relaxed rules by Google which will help other advertisers expand their TAM
- Netflix ads should allow DSPs like NASDAQ:TTD to get more investment dollars flowing through their platform.
- EPS is growing massively in FY 2027/2028.
- I'm not sure if we could get all time high before 2027 but firmly believe NASDAQ:TTD should test 200 weekly SMA.

$TTD Breakout After Earnings | Gapped Up w/ Volume Surge📊 Summary for TradingView Post:
NASDAQ:TTD exploded +11% post-earnings, gapping above key resistance and closing strong with massive volume.
Price cleared multiple supply zones with conviction, now sitting above $79 with eyes on $82.74 and $86.43.
Buyers showed up heavy. This is no random push—structure confirms strength.
Still bullish unless it fills the gap below. Watching for continuation or controlled retest.

$TTD stock has been in a steady uptrend!📊 The Trade Desk ( NASDAQ:TTD ) – Stock Analysis
🔍 Fundamental Analysis
1. Company Overview:
Name: The Trade Desk Inc.
Ticker: TTD
Sector: Technology / Advertising
Business Model: The Trade Desk is a leading demand-side platform (DSP) for digital ad buyers, enabling programmatic advertising across various channels such as display, video, audio, and connected TV (CTV).
2. Key Financial Metrics (as of Q1 2025):
Market Cap: ~ SGX:40B (approx.)
Revenue (TTM): ~$2.2B
Net Income (TTM): ~$180M
P/E Ratio: ~80–100 (varies with market sentiment)
Free Cash Flow (TTM): Strong positive cash flow
Debt: Low, strong balance sheet with over SEED_TVCODER77_ETHBTCDATA:1B in cash
3. Growth Drivers:
CTV Advertising Growth: TTD is a major player in connected TV, which is rapidly growing as consumers move away from linear TV.
Unified ID 2.0 (UID2): A privacy-conscious alternative to cookies, gaining adoption and positioning TTD as a forward-thinking leader in ad tech.
International Expansion: Continues to grow operations in Europe and Asia.
AI and Data-Driven Targeting: Offers better targeting for advertisers, increasing ROI and retention.
4. Risks:
High Valuation: Valued at a premium; leaves little room for error.
Competition: Faces competition from Google, Amazon Ads, and other ad-tech players.
Macroeconomic Sensitivity: Advertising budgets often shrink in recessions or uncertain environments.
📈 Technical Analysis
1. Price Action & Trend:
Current Price (May 2025): ~$88 (hypothetical for this analysis)
YTD Performance: +22%
52-week range: $60 – $94
Trend: The stock has been in a steady uptrend since late 2023, forming higher highs and higher lows.
2. Key Technical Indicators:
200-Day EMA: Bullish crossover occurred months ago; price is trading well above it.
50-Day EMA: Acts as dynamic support; price has bounced off it multiple times.
Relative Strength Index (RSI): ~65 → not overbought yet, but nearing the upper end.
MACD: Bullish divergence; histogram and signal line indicate strong momentum.
Volume: Increasing on green days, suggesting strong institutional interest.
3. Support & Resistance:
Support Levels: $82 (short-term), $75 (medium-term)
Resistance Levels: $94 (recent high), then potential psychological level at $100
🧠 Summary
Factor Analysis
Valuation High, but justified by growth potential
Growth Potential Strong, driven by CTV and UID2
Profitability Profitable, strong FCF, low debt
Technical Trend Bullish, healthy uptrend above key EMAs
Risk Level Moderate–High due to valuation and macro sensitivity

TTD eyes on $54.xx: Major Resistance to be flipped to SupportTTD dumped even before tariffs but trying to recover.
Now testing a major resistance zone at $54.21-54.34
If rejected then watch next support zone $51.26-51.43
Previous Analysis that called the top:
================================================


TTD The Trade Desk Options Ahead of EarningsIf you haven`t bought TTD before the recent rally:
Now analyzing the options chain and the chart patterns of TTD The Trade Desk prior to the earnings report this week,
I would consider purchasing the 55usd strike price Calls with
an expiration date of 2025-6-20,
for a premium of approximately $6.70.
If these options prove to be profitable prior to the earnings release, I would sell at least half of them.

Google Ruling Could Be Very Bullish for TTDA U.S. judge has found Google guilty of illegally monopolizing the digital advertising technology markets. The monopolization of both the demand and supply sides has been a long-standing concern for the rest of the digital advertising sector.
This ruling may significantly benefit The Trade Desk (TTD), as it operates as an independent demand-side platform. The digital advertising market is projected to exceed $600 billion in 2025, and Google currently believed to be controls nearly 30% of that. Even a 5% slip in Google’s market share, with TTD capturing just 10% of that shift, could nearly double TTD's revenue. As a result, this ruling is can be considered very bullish for TTD, both in the medium and long term.
Technically, TTD recently tested the $40 level, a key support that has held since Q4 of 2020, indicating the stock is currently in a strong demand zone. With this news, the likelihood of that support holding and a bullish reversal increases.
Analyst consensus reflects an 85.8% upside potential. If the bullish scenario plays out, the horizontal level at $60 and the 200-day moving average could serve as key medium-term targets. From current levels to the 200-day SMA, the potential return is close to 50%.

TTD could return 200% in the next yearsThe Trade Desk is this big American tech company that basically helps advertisers buy digital ads in a super smart, automated way. They run a platform (called a DSP, or Demand Side Platform) where brands and agencies can set up, manage, and optimize their ad campaigns across tons of channels—like websites, mobile apps, streaming TV, audio, you name it. They’re pretty much the biggest independent player in this space, competing with giants like Google and Amazon.
Now, about the stock crash ,things have been rough lately. Their share price tanked, and here’s why:
First off, their latest financial results were kind of a letdown. For the first time in over eight years , they didn’t hit their own revenue targets. Investors hate surprises like that, so the stock dropped hard, almost 30% in a single day.
On top of that, they’ve been rolling out a new AI-powered platform called Kokai, but apparently, there were some hiccups with the launch. The company admitted they messed up a bit on execution, which didn’t help investor confidence.
Another thing: their stock had gone up a ton last year, it more than doubled at one point. So when the results disappointed, people freaked out and started selling. The valuation was super high, and the market just corrected itself, wiping out a huge chunk of their market cap.
There’s also some bigger-picture stuff going on.
The ad industry is getting more competitive, with Google and Amazon pushing hard, and there are worries about the economy slowing down. Plus, new privacy rules and regulations are making things trickier for digital ad companies in general.
All this led to a bit of a panic, with people selling off their shares and the price dropping even more because of technical trading stuff.
Fortunately, the price stopped near the previous lows where there is a major support and this could be a masive opportunity for mid to long term investors seeking a low risk entry with a +200% returns opportunity. A Stop Loss under the supports would be fine to keep your money safe.
In short, The Trade Desk is still a major player in digital ads, but they hit a rough patch because of disappointing results, some mistakes with their new tech, and a reality check on their sky-high stock price. Some people still think they’ll bounce back if they fix these issues, but for now, it’s been a wild ride!

$TTD load at 29-33NASDAQ:TTD first time ever, weekly RSI is < 30. There is a price where you just buy and forget regardless of technicals. That area looks like 29-33 to me.

Opening (IRA): TTD May 16th -70C/October 17th 32.5C LCD*... for a 26.10 debit.
Comments: At or near 52-week lows. Buying the back month 90 delta and selling the front month that pays for all of the extrinsic in the long. (The October 17th 32.5C is shown at the 50 strike to fit it on the chart).
Metrics:
Buying Power Effect: 26.10 debit
Break Even: 58.60/share
Max Profit: 11.40
ROC at Max: 43.7%
10% Max: 2.61
ROC at 10% Max: 10.0%
In this particular case, I'll look to take profit at 110% of what I put it on for and/or roll out the short call if it hits 50% max. Earnings are on 5/14, so my preference would be to take it off before then ... .
* -- Long Call Diagonal.
