🖕 NatGas Update Until there is some form of bounce and waves 1-2 of the new trend are shaped it is risky to call the bottom.
One option could be that the ugly diagonal was extended wave 1. A recent consolidation looks like a neat barrier triangle that usually happens in waves b, x or 4. It it is 4 that means wave 5 should be shorter than wave 3. If it is b we are charting something bigger and yet unclear.
NATGAS trade ideas

NATURAL GAS : DEEP CRABNATURAL GAS: DEEP CRAB
to Watch: EMA.50 and EMA.200
+ Fibonacci levels
+ ICHIMOKU levels

Time to buy gas?Here is a quick plan for Natural Gas. I will look more into this later.
I believe it's almost there but don't forget that you are looking at a monthly chart.
open.spotify.com

🟡 Natgas UpdateIt has not been long for gas to shape what I see as ending diagonal. The uncertainty about which scenario we are in will stay for some time.

🖕 NatGas UpdateToday the market has invalidated the previous scenario with contracting triangle and now I am looking at 3 versions of a single scenario with [a ] [b ] [c ] flat.
The chart is in category FAFO - f..ck around and find out.

🟢 Natgas UpdateNatgas has followed the Local Alternative scenario and formed a symmetrical triangle.
The triangle is running meaning there is only direction possible (on the condition that it is a triangle and not something else).
I will keep the idea in the green bucket of confidence.

Natural Gas - Keylevels - DailyNatural Gas remains in a downward trend, we are getting closer to winter, and demand will increase.
Why doesn't the price increase more?
Or...why doesn't the price increase according to your expectations?
Simple..
The story of the war has calmed down and the FUD on prices has decreased and in addition to that, the main factor is that in several countries in EUROPE, the price of gas is capped, so that regardless of demand and supply, the price on the bill remains the same .
My opinion is that if this winter we see Natural Gas between 4-6 dollars, it would be advisable to mark our profits and wait for next year.

🟢 NatGas UpdateA couple of scenarios I am tracking right now. This is not exhaustive. A more pronounced pullback is also possible where wave is already finished and we are in wave down. However, it is too early to elaborate on it.

Cup and Handel in play NATGATPlease check out this potential cup and handle on the daily.
If this plays out, expecting the move to be the depth of the cup
to the lip. Target 3.60 - 3.70. I have a wide stop at 3.02.
Let me know your thoughts

🟡 NatGas Local Alternative In addition to previously posted chart there is another alternative of the same scenario where consolidation wave is much smaller.

🟢 NatGas UpdateAfter such wild swings I have somewhat restored my confidence in the count where according to my analysis we are in the midst of correction, hence volatility and uncertainty.
Wave x is plotted in 2 scenarios - triangle and expanded flat. I would say that flat is the preferred one based on the sctructure of waves a and b that tempt me to label both of them as wxy.
In a triangle only one wave can be complex wxy or a nested triangle. Other waves must be simple abc zigzags.

XNG Natgas RecoverAs in my preliminary analysis, Natgas took 3.65 as resistance. The target should be in the area of the 0.5 retacement and I would assume that the path shown is very likely.

Gas xngusd#Gas - H4
📣 Looking at the 4-hour timeframe, if the support level at 3.405 is broken, it may indicate a potential price decline towards the 3.130 range.
⛔ Stop Loss: 3.640

Natural Gas - Big moves aheadNATGAS has been putting in consecutive higher highs for the better part of a month. This is indicative of a further move up as called over a month ago. Until this trend is broken we remain bullish and are looking to break the first resistance which should then lead us to 3.5$ very quickly.
BULLISH

NatGas Creeping BullisH !Hi friends, Sharing one day chart of Natural gas for my trading idea in it, As we can see that price is consolidated in parallel channel from many weeks and now trying to break channel resistance so if it will break resistance and if close above resistance we can see above marked target can arrive in coming sessions, Price has come here so far by making higher lows and now trading above from last swing high so we can assume it is starting of trend reversal in it One Triangle breakout already occurred inside in channel.
I don't think there is any need to write a long description because charts have their own language, you just have to understand it.
This is not and trade or investment advice. This idea is meant for learning only.
Best Regards happy trading- Amit

Programmed?I think at the very least this is Destined for the 200 EMA on the weekly...
Expecting a bumpy ride to get there (the don't call it "The Widow Maker" for no reason, but tbh looking at these impulsive candles it could blast up there pretty quick 🤔

🖕 NatGas Update The steepness of the rise made me construct another alternative. If the price starts consolidating we are likely to keep going up. Next few hours will show the way.
If the price makes a U turn in the next half an hour I will be tempted to short with a tight SL. Not advice.
Colour coding for reference
🟢 - green represents those in which I am reasonably confident (does not mean bullish).
🟡 - yellow, I can see a possible count, but ready to reconsider at any moment.
🖕 - just f..king around to find out (if Tradingview continues to ban them, I'll show another finger)

Reviews on NATGASJust a review on NATGAS and the direction I would want to see it pull towards.
Disclamer: Poor audio quality.

🟢 NatGas UpdateI believe we are on track with what I posted previously. At his moment I think the odds for near term (next two weeks) bearish case are rising.
I will give this idea a green label based on my growing confidence in the bigger picture which allows me expect only few combinations in the near term
Colour coding for reference
🟢 - green represents those in which I am reasonably confident (does not mean bullish).
🟡 - yellow, I can see a possible count, but ready to reconsider at any moment.
🖕 - just f..king around to find out (if Tradingview continues to ban them, I'll show another finger)

Natural Gas Futures: Too high, too fast?? Natural Gas price flirts with a fresh 2023 high (www.fxstreet.com)
Natural Gas prices jump to $3.42 as tension builds around possible invasion. The US Dollar reclaims its status as King Dollar

XNGUSD, DailyNatural gas had broken the trading range and achieved $3.6 per contract. Given the situation in the commodity markets, natural gas may continue moving higher after testing the $3.2-$3.4 level.

XNGUSD, DailyNatural gas had broken the trading range and achieved $3.6 per contract. Given the situation in the commodity markets, natural gas may continue moving higher after testing the $3.2-$3.4 level.

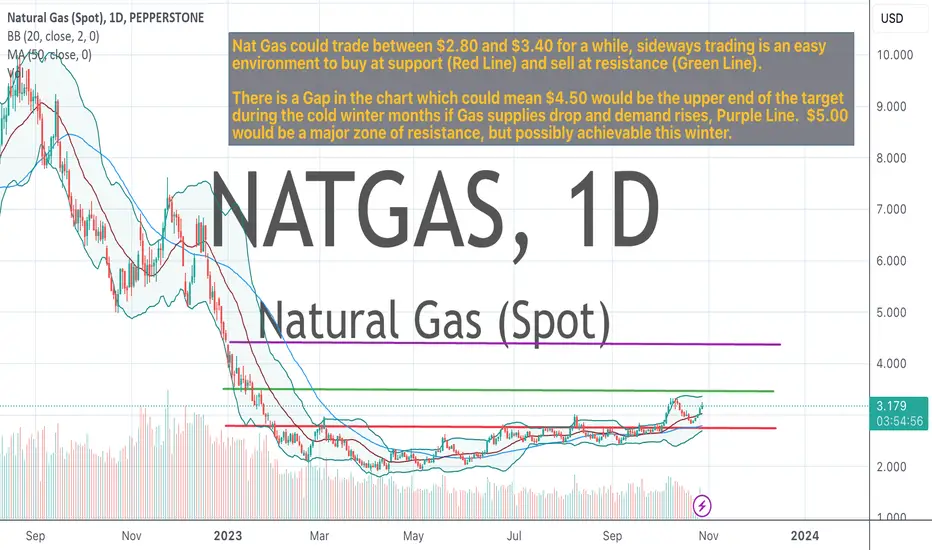
NatGas Trade - Bullish Med TermNat Gas could trade between $2.80 and $3.40 for a while, sideways trading is an easy environment to buy at support (Red Line) and sell at resistance (Green Line).
There is a Gap in the chart which could mean $4.50 would be the upper end of the target during the cold winter months if Gas supplies drop and demand rises, Purple Line. $5.00 would be a major zone of resistance, but possibly achievable this winter.