Natgas long term target 4Natural Gas (NATGAS) | 4H Chart Analysis
We are seeing a strong technical setup developing on Natural Gas. Price has recently bounced off a key ascending trendline support around the 3.00–3.10 area, with clear higher timeframe structure still intact.
Trade Plan:
Entry: Around 3.10, after confirmi
No news here
Looks like there's nothing to report right now

Waiting for $3: Patience Before Positioning in GasYes, the attempt to catch the bottom in natural gas ended in failure. Let it be a lesson for the future. Just because something looks cheap and low doesn’t mean it can’t go even lower — and the question is whether your margin and nerves can handle the drawdown. In short — it's a bad path.
It’s to


XNGUSD Technical Update – What the Chart Is Telling Us NowIn this video, I break down the current XNGUSD (Natural Gas) chart using pure price action analysis on the daily timeframe.
This update builds on my previous post, where I shared a comprehensive outlook supported by fundamentals, including supply/demand imbalances, geopolitical risks, and long-term

XNGUSD POSSIBLE LONG OPPORTUNITY
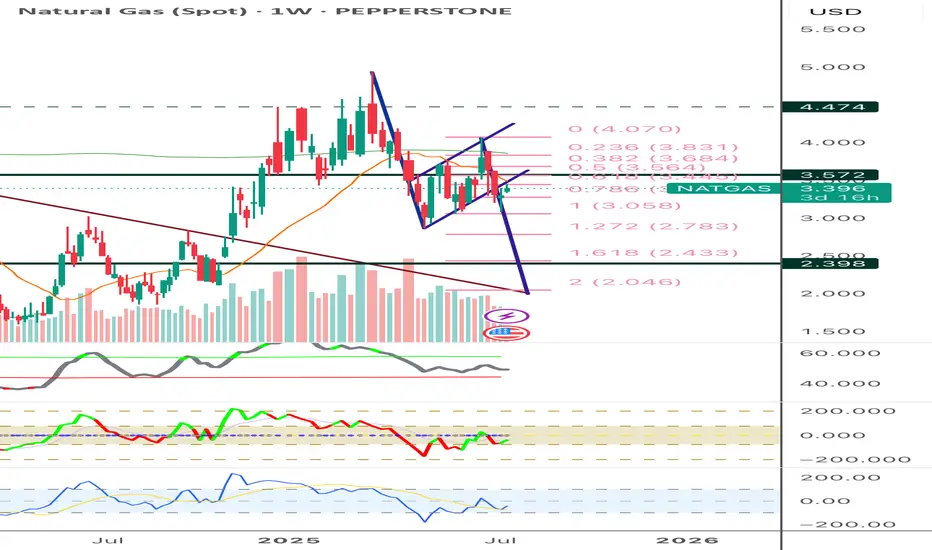
Us natural gas has been falling since June 20th and stopped a decline nearby the 3.3900 level with minor false breakouts of it. Currently we observe the reversal bullish wedge pattern, which is supported by a divergency on rsi on 4-h timeframe. Yesterday natural gas trading session opened with a g

NATURAL GAS formed Head and Shoulders patternCAPITALCOM:NATURALGAS
🔍 From a longer-term perspective, I noticed that a Head and Shoulders pattern 🪖🩻 is about to form. This pattern has been forming since December 2024 and in the long term 🕰️ means no good for those who play long here 📉.
🙋♂️ Personally, I will stay aside for now and observe

Natural Gas is in the Buying DirectionHello Traders
In This Chart NATGAS HOURLY Forex Forecast By FOREX PLANET
today NATGAS analysis 👆
🟢This Chart includes_ (NATGAS market update)
🟢What is The Next Opportunity on NATGAS Market
🟢how to Enter to the Valid Entry With Assurance Profit
This CHART is For Trader's that Want to Improve Their Te

Natural Gas Spot Well trying to read this complex correction again and assuming this is larger x wave or f wave if diametric in intermediate degree and time confirmation yet to come if next high previous fall not passed with in that time, then new low again possible, Let see. Not a sebi registered analyst, just per

NATURAL GAS - REBOUND FROM THE MAJOR TRENDLINE AND ANOTHER LONG CAPITALCOM:NATURALGAS
Last week on Wednesday and Thursday we observed the false breakout of the major trendline. Eventually, Thursday ended up bullish, gaining 4.8% day-to-day. On Friday the asset has been trading majorly sideways, retesting the major trendline (pic 1). Technically, looks like

See all ideas
Displays a symbol's price movements over previous years to identify recurring trends.