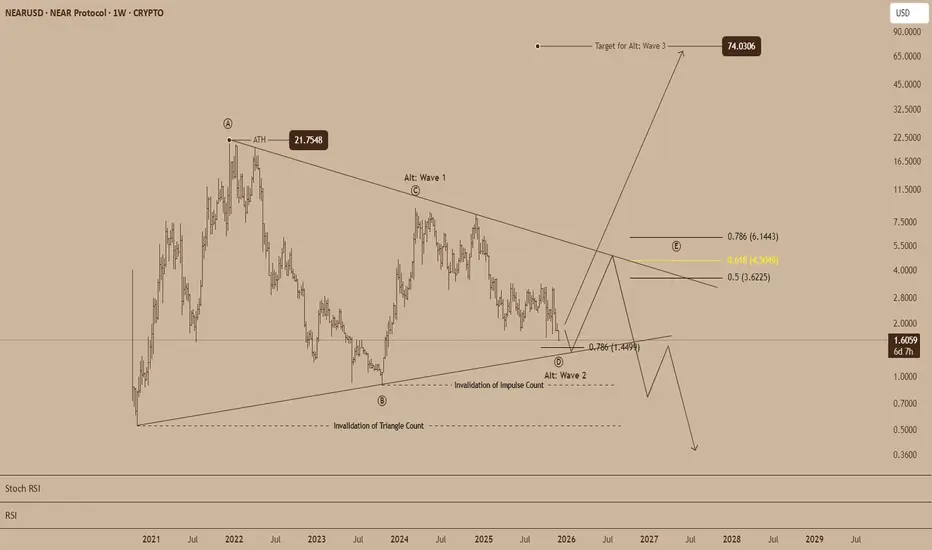
NEAR Protocol Tests Long-Term Support as Triangle Pattern Nears NEAR Protocol is approaching a critical juncture, with its multiyear structure tightening toward a decision point that could determine the token’s long-term trajectory. The current pattern resembles a maturing contracting triangle, a formation that typically concludes with a sharp directional break.
The price has continued to drift toward the lower boundary of the structure, which has been respected since early 2021. This trendline now sits near the 0.786 retracement level at $1.449, a key support region that has emerged as the focal point for Wave D. If buyers defend this area, the broader triangle count remains intact and would set the stage for a final Wave E rebound into the $3.62 to $6.14 retracement cluster. Within that region, the 0.618 level at $4.5049 stands out as the midpoint target for a corrective lift before the pattern compresses fully.
The larger bullish alternative suggests that NEAR may already be completing an extended Wave 2. A sustained hold above the lower support line would allow for the possibility of a substantial Wave 3 advance. The projected target for this alternative scenario lies far above current levels, near $74.03, which corresponds to a major Fibonacci extension and would imply a powerful long-term trend reversal.
However, the stakes are high. A breakdown beneath the triangle’s lower boundary would invalidate the structure entirely and signal that the market is shifting into a deeper corrective phase. The chart marks an invalidation level beneath the broader support zone, and a decisive breach could accelerate losses toward sub-dollar territory, potentially revisiting levels not seen since the earliest stages of the token’s history.
For now, NEAR trades at the midpoint between risk and opportunity. The structure is tightening, momentum indicators show oversold conditions, and the price is resting on a multi-year support line. Whether this zone marks the foundation for a major turnaround or the start of a prolonged decline will depend on how price behaves around the crucial $1.449 region as the triangle nears its conclusion.
Trade ideas
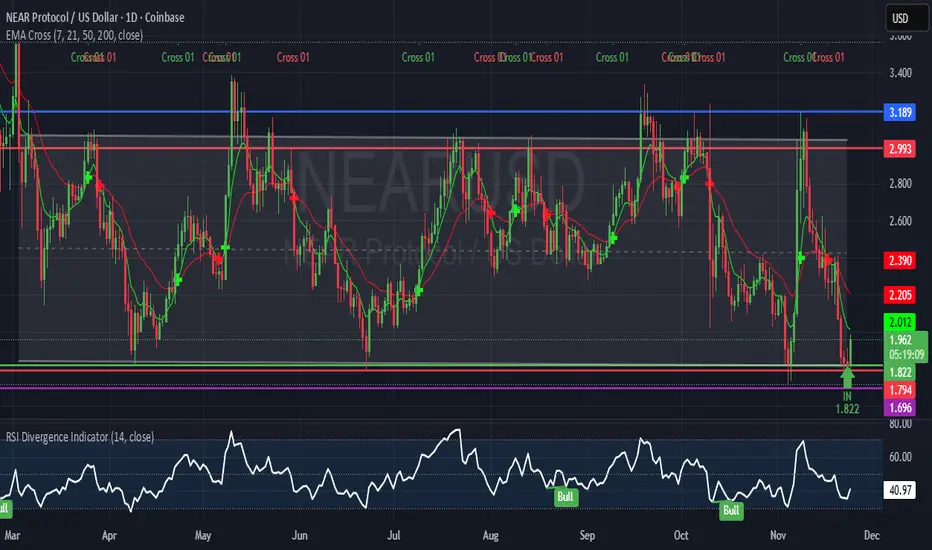
NEAR/USD Spot Long! 11-23-2025This is a good chart to trade!
Ascending putting in higher lows on the week/all chart!
I got in on 11-23-25 at $1.822
Low of the parallel channel good entry!
High of the parallel channel is around 3.15 good exit!
#37 has been around 5 years with a 2.53B market cap!
Keep an eye on this crypto project!
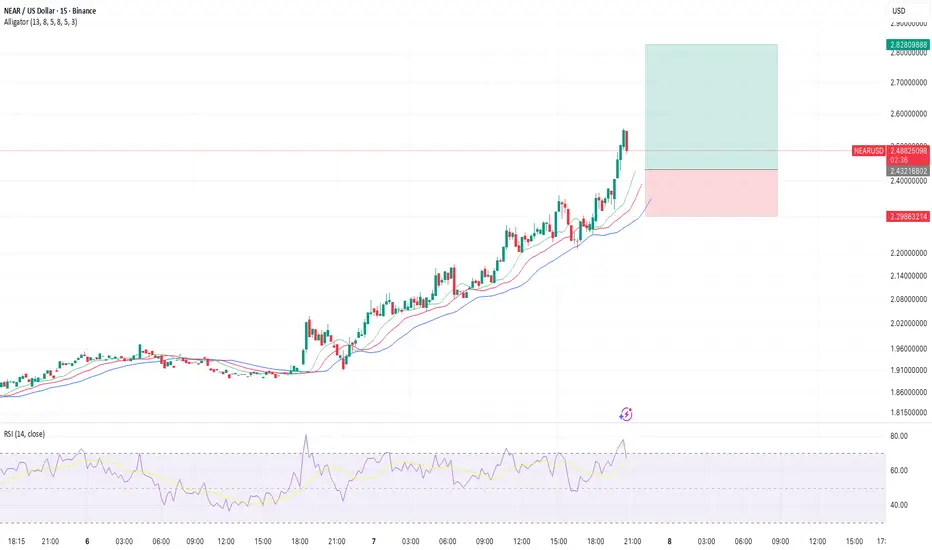
NEARUSD, 1H, 1:3 RRRUsing FVG (Fair Value Gap), it would reap a RR of 1:3. Entry point 2.432, SL 2.298, and TP around 2.828
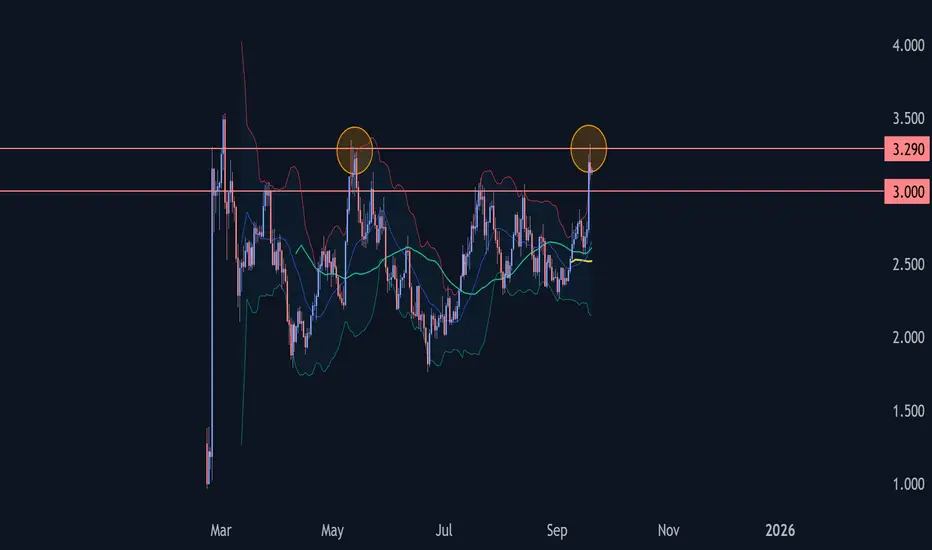
NEAR Wave Analysis – 19 September 2025
- NEAR reversed from resistance zone
- Likely to fall to support level 3.000
NEAR cryptocurrency recently reversed down from the resistance zone between the resistance level 3.290 (former strong support from 2024, which stopped the previous wave 2 in May) and the upper weekly Bollinger Band.
This resistance zone was further strengthened by the 38.2% Fibonacci correction level of the previous weekly downward impulse from the start of 2025.
NEAR cryptocurrency can be expected to fall to the next round support level 3.000 (former resistance from July and August).
Can we see NEAR at $8 before 2025 end?It's a blockchain for AI that's been doing a lot of work these days and pushing many things on X, making it a wild card in the AI category. This crypto saw its deepest depth in price but still held above $2, making it fundamentally strong, as it didn't mark a new low for its token, that's a big deal, you know.
Now, if you see technically, I arranged two charts for you to see. One is daily, and the other is weekly. Let's talk about weekly. It reveals that a high institutional footprint marked by FRVP POC at $3.5 is very critical because it's a major supply, which was once a demand area.
The good part is NEAR is riding the horse with a daily chart symmetrical triangle breakout and has been approaching this level, thinking it will flip and sustain. If this is sustained, that means if $3.5 is sustained, then we can see a rally to $8 pretty soon. I hope you get my point, guys, so if you want, you still have time before it's still cheap, don't FOMO and DYOR, it's no financial advice, just my own viewpoints.

Near moving above invh&s w/ a double bottom neckline just aboveThe inverse head and shoulders breakout not yet fully confirmed, but price is currently comfortably above its neckline. In hitting the inverse head and shoulders full target, it should also validate the double bottom breakout as well. *not financial advice*

BTCUSD & NEARUSDBTCUSD has been trending higher and higher after it formed a bullish diamond pattern and I found NEARUSD formed the same chart pattern as of today 19 Sep 2025.

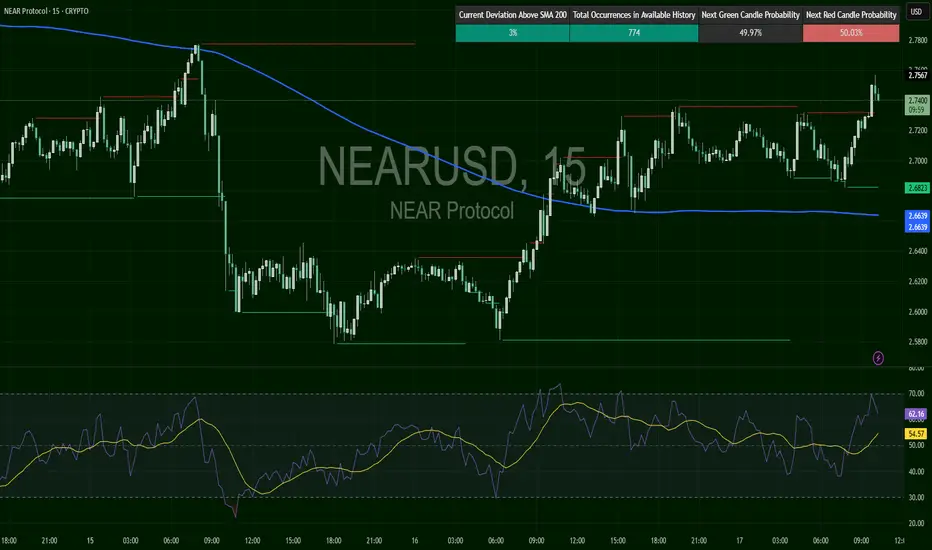
NEAR/USD – Bullish Push🟢 LONG above $2.75 – target $2.80
NEAR trades at $2.75, breaking above SMA200 ($2.66). Resistance sits at $2.76–2.80, support at $2.68. RSI at 65, nearing overbought but still constructive. Bulls showing strength, continuation likely if $2.75 holds.
📖 Keywords: #NEARUSD #NEARProtocol #CryptoBreakout #MomentumTrade
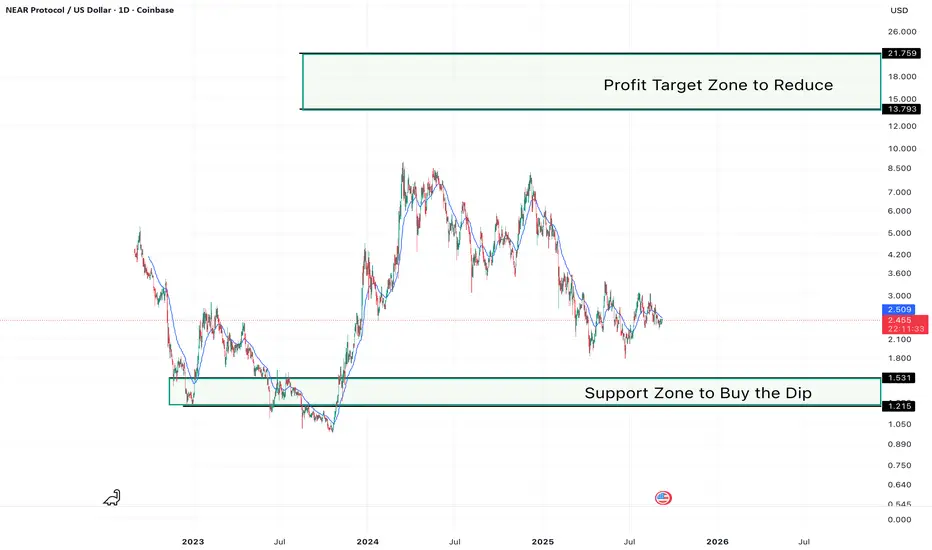
NEAR 10x Ahead?NEAR is holding steady after its retrace, with a clear support zone at $1.21–$1.53 for buying dips. If accumulation continues, the next profit target zone is $13.79–$21.75, offering strong risk-to-reward potential for long-term holders.
Patience on entries near support could pay off big as momentum builds.
NEAR1D Liquidity Levels in Play, $2.62 Breakout or $1.82 Sweep?NEAR is consolidating at $2.40 under a heavy downtrend resistance line, with price stuck between key liquidity levels.
The $2.436 golden pocket aligns with resistance, while a stronger barrier sits at $2.616 (Fib 0.5). If bulls can reclaim these zones, price may run toward $2.80–3.00.
On the downside, liquidity sits first at $2.310, then deeper at $1.823, a major level where buyers previously defended strongly. The Fib 0.786 at $2.180 provides additional support inside this lower range.
The Stoch RSI is oversold, suggesting a short-term bounce is possible, but until liquidity above $2.436–2.616 is taken, downside pressure remains intact.
📌 Key Liquidity Levels:
Upside: $2.436, $2.616, $2.80
Downside: $2.310, $2.180, $1.823
⚡ Follow for more NEAR liquidity-based chart breakdowns.

NEAR – Double Correction Setup Near Protocol CRYPTO:NEARUSD is currently pulling back from its July peak, unfolding within an #ElliottWave Double Three (WXY) structure.
Price is now approaching the equal legs zone at $2.26–$2.07, a key area where a bounce is expected this month.

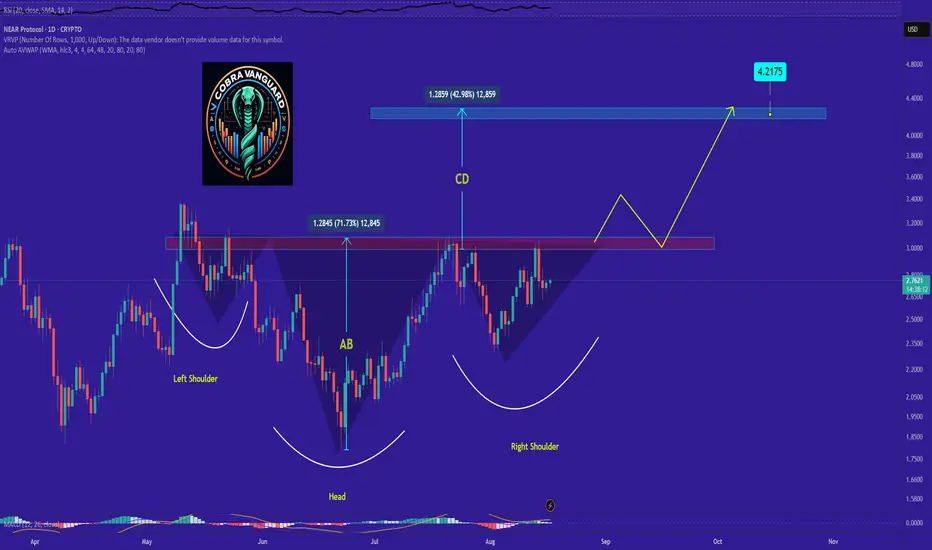
we shall see a good amount of increase in NEAR price !It seems the price is forming a head and shoulders pattern, which, if correct, suggests a good price increase in the coming days. However, we should wait for the pattern to fully complete.
Best regards CobraVanguard.💚
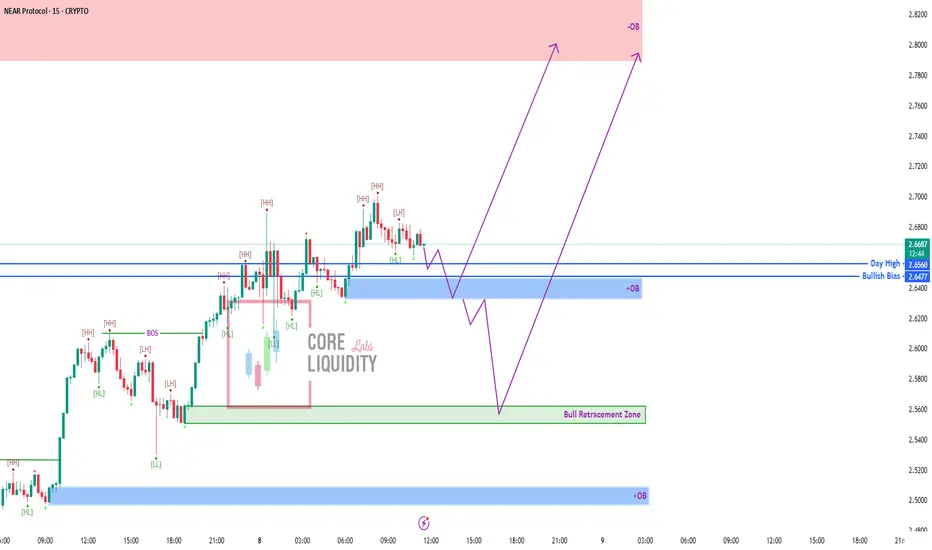
NEAR/USDT 15M – OB Support & Bull Retracement SetupPrice is consolidating above the Bullish Bias zone with potential liquidity sweep opportunities before targeting the upper OB.
📌 Scenarios:
1️⃣ Hold above OB support → continuation toward 2.80–2.82 supply zone.
2️⃣ Sweep into Bull Retracement Zone → bullish reaction → strong move to upper OB.
🔹 Market structure shows BOS + HH/HL continuation pattern.
🔹 Key watch zones: OB support at 2.65 and Bull Retracement Zone for entries.
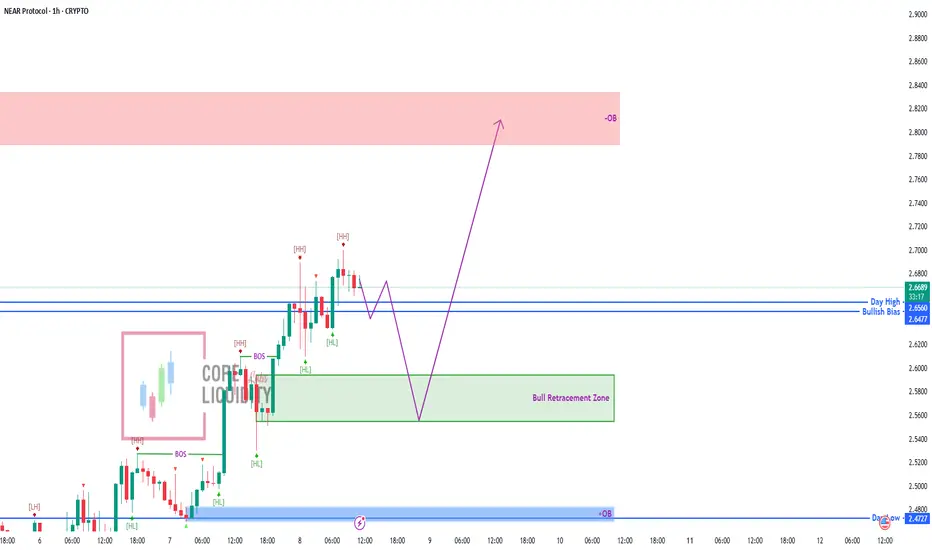
NEAR/USDT 1H – Bullish Retracement Before OB TargetPrice is trading above the Bullish Bias zone after forming higher highs and higher lows. Current structure suggests a potential pullback before continuation toward the upper OB.
📌 Scenario:
Retracement into Bull Retracement Zone → bullish reaction → push toward upper OB near 2.83–2.85.
🔹 Structure shows BOS confirmations with strong bullish momentum.
🔹 Key zones to watch: Bull Retracement Zone for entry, upper OB for target.
NEAR Protocol Ready to Break Out? 3:1 R:R Swing Trade Setup!Wait for a breakout from this bull flag pattern. This swing trade setup targets the next higher high and offers a 3:1 risk-reward ratio —
Entry at $3.056
Stop Loss at $2.665
Target at $4.248.
This is for educational purposes only.

NEARUSDT📊 1H Analysis – NEARUSDT
Strategy: 🐊 Alligator Strategy
Trend: 📈 Strong Uptrend
📝 Trade Plan
🎯 Entry Point (EP): 2.835
🛡️ Stop Loss (SL): 2.713
💰 Take Profit 1 (TP1): 2.962
Risk Reward 1:1

NEARUSDT NEARUSDT – Bullish Reversal Trade Setup
Entry: $2.78
SL: $1.81
TP1: $3.90
TP2: $4.96
Trail for Extension: $5.50–$6.00
Structure & Logic:
Previous Lower Low (LL) and Lower High (LH) sequence broken.
Higher High (HH) now confirmed — signaling trend reversal.
Strong Bullish Engulfing + Hammer at Higher Low area.
Dow Theory shift in play, signaling long opportunity.
Trade Plan:
Partial at TP1
TP2 for full target
Trail SL above TP2 for potential $5.5–6.0 move
Risk-managed entry: ~1:1 , 1:2

NEAR Protocol: High-Risk, High-Reward Setup With 40:1 R:R PotentThis setup carries a very high risk for NEAR Protocol. However, if it plays out—driven by BTC breaking to a new all-time high—the risk-to-reward ratio could reach 40:1.
Entry 2.764
Stop loss 2.618
Target 8
For educational purposes only.

Global plan for NEAR In this idea I marked the important levels for this week
Looking globally at the whole picture, we can expect the next 4 months of growth. The price is in the correction phase after a long fall.
Locally there are a couple of scenarios of movement and everything is pointed out and explained in the video
Write a comment with your coins & hit the like button and I will make an analysis for you
The author's opinion may differ from yours,
Consider your risks.
Wish you successful trades! MURA

At the 50 EMAPrice made a recent DOJI candle at the resistance of a downward parallel channel, it's also wrestling with the 50 EMA in purple. Volume appears at the time declining. Stochastic RSI is very overbought. Price needs to surpass the 2.75 and price needs to make Higher Highs and Higher Lows from the 3.026 price level for a trend change.

NEAR, Butterfly Pattern Near has put up a butterfly pattern along with a descending wedge. There is a divergence setting up on the OBV. R:R is 2:1 Alt cap is also in a descending wedge. 50% off load @ TP1, another 30% at TP2. SL of 20% = to 2% of acct.

Dead Cat Demand Zone? - Double Bearish Bull Setup ImminentCHARTS:
The recent drop confirms a strong uptrend to the downside. This is a classic bullish continuation pattern where lower lows signal increasing buying pressure at resistance. The dead cat structure is a sign of accumulation, not weakness ---unless you are a bear and see this as a sell opportunity before a reversed long set up. Expect a breakout to $54–$76 within the week(s).
ALWAYS REMEMBER:
You must go up before you go down, never down before you go up, unless you were already down, in which case you’ve technically already gone up—just downward.
I'm not a financial advisor.

NEARUSD Huge bullish divergence targeting $7.000NEAR Protocol / NEARUSD is trading inside a 1 year Channel Down.
The price is lately inside a smaller Channel Down that failed today and got rejected on the 1day MA50.
The 1day RSI howver has been on a Channel Up in the meantime, which is a huge bullish divergence and resembles the mid September 2024 rejection.
That was on the larger scale though a bottom for the Channel Down that initated a big rally to its top.
Buy and target $7.000.
Follow us, like the idea and leave a comment below!!
