NEAR Market OverviewAt the moment, we can see that the price is in an ABC correction. So far, it has only reached the 0.382 Fibonacci level and is currently sitting near the weekly pivot point at $2.58 . We're closely watching the price action here, as it's possible the price will extend to the 0.5 Fibonacci level at $2.672 , react from resistance, and then move down toward the $2.145 level.
If the price successfully breaks through and consolidates above, we could see a move up toward the resistance zone at $2.86–$3.029 .
NEARUSDT trade ideas

NEAR 1H – Retest in Motion, But Will Bulls Hold 2.50?NEAR broke above its prior consolidation zone, retested it briefly, and surged higher toward the 2.63 area. Price is now pulling back, with the 2.50–2.52 support zone acting as the first key area for bulls to defend.
If the retest holds, the bullish path toward 2.70+ remains in play, following the projected stair-step structure. Failure to hold this zone could shift momentum toward the 2.45 mid-level support before any recovery attempt.
Key watchpoints:
– Break & retest structure at 2.50–2.52
– 2.70 upside target if momentum continues
– Stoch RSI resetting from overbought, offering potential for another push

NEAR 4H – Squeezed Into Support, But Will the Bounce Stick? NEAR is being compressed between a major descending trendline and a historically strong demand zone on the 4H.
The setup is classic:
🔻 Lower highs = sustained bearish pressure
🔹 Flat support = buyer interest around $1.50–$2.00
🔄 Stoch RSI is flipping from oversold, hinting at possible relief
A clean break below this support would invalidate the setup — but if buyers defend again, we may see a sharp reversal.
⚠️ Watch for:
– Bullish divergence or high-volume bounce
– Break and retest of the trendline for confirmation
– Stop hunts below support before reversal (wick traps)

NEAR 4H Golden Pocket Bounce, Will Recovery Push Past 0.5 Fib?NEAR has rebounded strongly from the 0.618 Fib level within the golden pocket, reclaiming ground toward the 0.5 Fib near 2.46. A sustained breakout above this midpoint would strengthen bullish momentum and open the path toward 2.80+, while rejection here could send price back to retest the 2.31 zone. Momentum is recovering, but bulls still need confirmation to flip the mid-Fib into support.

NEAR 8H – Higher Low Formed, But Can Bulls Target 3.10 Next?NEAR is showing signs of a long-term structural shift after bouncing cleanly from a major demand zone and printing a higher low above trendline support. The current 8H structure reflects a steady recovery with three clear upside targets already mapped from the most recent breakout sequence.
With the ascending trendline holding and demand respected, this remains a long-term bullish setup — but continuation depends on reclaiming short-term resistance around $2.60.
Target zones:
– Target 1: $2.68
– Target 2: $2.90
– Target 3: $3.10 (supply zone retest)
Invalidation sits below the trendline (~$2.30), and confirmation comes with momentum through Target 1.
Well-structured recovery play — patience required, but technicals remain intact.

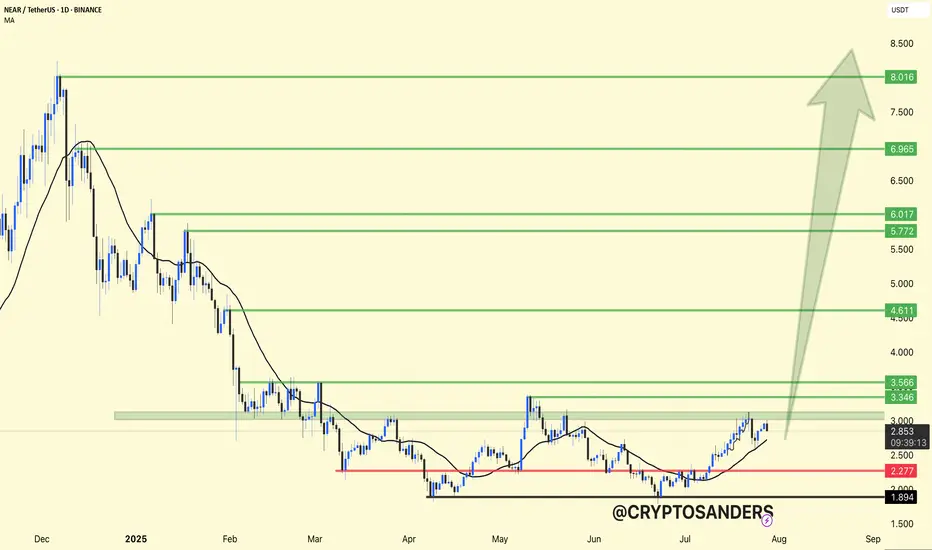
NEAR/USDT Daily Chart Update & Long Setup:NEAR has broken out of its accumulation zone and is now trading above the key support level of $2.27, with a clean higher-low structure forming.
Support Zone: $2.27
Immediate Resistance: $3.34 – $3.56
Breakout Confirmation Target: $4.61 → $5.77 → $6.96 → $8.01+
Long Trade Setup (Swing Idea):
Entry: $2.80–$2.95
Stoploss: Below $2.27
Targets:
• TP1: $3.56
• TP2: $4.61
• TP3: $6.01
• TP4: $8.00+ (in bullish momentum)
Trend Bias: Bullish above $2.27
Momentum Indicator: Price above MA, signaling potential continuation.
Stay updated and manage your risk accordingly.
DYOR | NFA
Short on NEAR, but with caution!The technical setup is very clear and strong. The resistance level is well-defined. The fundamental news, while positive, is not reporting the kind of extreme, immediate buying pressure we saw with ENA. The news about developer activity is a long-term positive, but it doesn't invalidate a potential short-term pullback from a major resistance level.
Therefore, the technical setup is compelling enough to take the trade, but we must be strict with our risk management because the underlying fundamentals are healthy.
let's break it down!
Technical Analysis
Let's start with the chart. The daily chart for NEARUSDT shows a clear recovery rally from the lows of early July. The price has now pushed up to the $3.00 - $3.10 resistance zone. This level is significant because it served as a reliable support floor during April and May 2025 before the price broke down in June. The chart shows the price is currently stalling right at this level, with today's candle showing a slight rejection. This is a classic "old support turning into new resistance" setup, making it a technically sound area for a potential short entry.
Sentiment and Fundamental Analysis
Now, let's analyze the provided news to see if the market sentiment aligns with our bearish technical view. (news taken from CoinMarketCap)
"GitHub Kings: LINK, ATOM, STORJ, and NEAR Dominate Crypto Development in 5-Month Activity..." (2 days ago): This is fundamentally bullish. High developer activity is a key indicator of a healthy and growing ecosystem. It suggests long-term value and innovation, which is a positive sign.
"NEAR Protocol Rebounds 9% as Investors Capitalize on Market Dislocation" (2 days ago): This headline is fairly neutral. It simply describes recent price action (a rebound) and attributes it to investors buying a dip. It doesn't provide a strong directional bias for the future.
"Luno launches first-ever crypto staking in Nigeria: What it means and how you can benefit" (3 days ago): While this article mentions crypto staking in general, it does not appear to be directly related to NEAR Protocol itself. Therefore, its impact on NEAR's sentiment is negligible. We can consider this neutral.
"NEAR Protocol Integrates EdDSA Signatures to Enhance Cross-Chain Compatibility" (2 months ago): While positive fundamental news, this is old information. Its impact has likely already been priced into the market and it has little bearing on the immediate price action. We can consider this neutral for our immediate trade decision.
The sentiment for NEAR is mixed, but leaning slightly bullish on fundamentals. The strongest and most recent piece of relevant news is about high developer activity, which is a positive sign. However, unlike the ENA news which showed massive, active buying pressure and whale involvement right now, the news for NEAR is more about long-term health rather than immediate, explosive buying pressure. There is no overwhelming bullish momentum that screams "don't short this."
The Trade Plan: NEARUSDT (Short)
The plan is set. We're entering a short position with a market entry now, around $2.96.
Entering a short position as the price tests a key horizontal resistance zone ($3.00-$3.10) that was previously strong support. The daily candle shows initial signs of rejection.
Stop Loss (SL): $3.35
A decisive close above the resistance zone would invalidate our trade idea. Placing the SL at $3.35 puts it clearly above the entire resistance area and above the minor swing high from late May, giving the trade room to breathe without taking on excessive risk.
Take Profit 1 (TP1): $2.55 (Moonbag Target)
This is the first significant support level on the way down, corresponding to the consolidation area in mid-July. It's a logical first target for sellers.
At TP1, take initial profits and move the trailing stop to our entry price (~$2.96) to make the rest of the trade risk-free.
Take Profit 2 (TP2): $2.20
This level corresponds to the next support area from the price action in early July. It represents a significant portion of the recent rally being retraced.
When TP2 is hit, move the trailing stop down to the TP1 level ($2.55) to lock in more profit.
Take Profit 3 (TP3): $1.85
This targets the major swing low from early July. A move to this level would mean a full retracement of the recent rally.
When TP3 is hit, move the trailing stop down to the TP2 level ($2.20).
Take Profit 4 (TP4): $1.55 (Final Target)
This is our final target, aiming for the lows of the year from March. In a bearish scenario where the resistance holds firmly, a retest of major lows is possible.
Close all remaining positions.
Conclusion:
The NEARUSDT short trade presents a good technical opportunity. While the fundamentals are not bearish, they lack the overwhelming bullish force seen in other coins, making this trade a calculated risk worth taking. The plan is now in place.
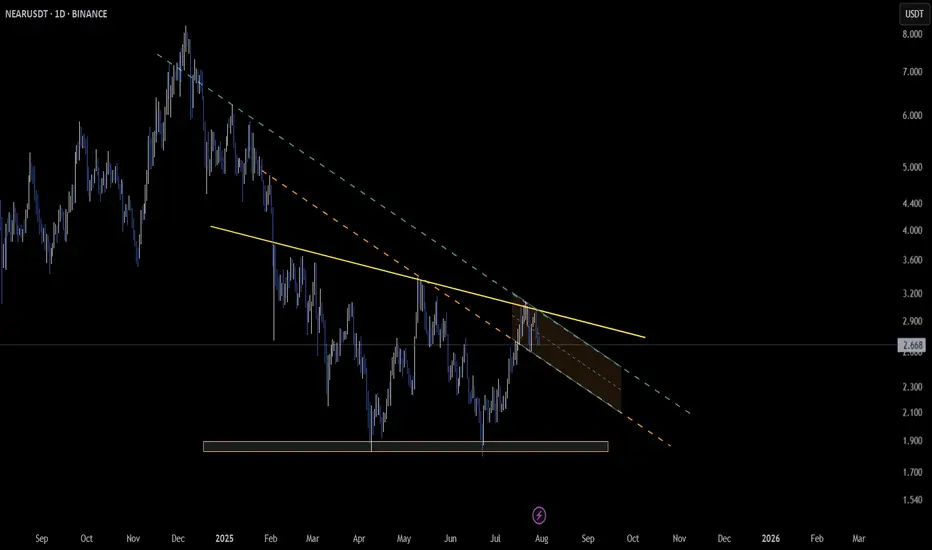
NEAR Approaching Key Breakout Zone – Structure TighteningCBOE:NEAR is showing mixed signals across timeframes 🧠
On the daily chart, price is moving within a descending triangle 📉 — often a bearish continuation setup.
However, from a different angle, it also appears to have broken above the trendline and retested it ✅ — suggesting early signs of a potential breakout.
Zooming into the 2H timeframe, price continues to respect a descending channel 🟠
This overlap of patterns puts the $3 level in sharp focus — a confirmed breakout above could trigger strong bullish momentum 🚀
Keep a close eye — the structure is tightening, and a major move could be on the horizon 👀
NEAR 4H – Key Support Holding, But Will It Last?NEAR is approaching a key inflection point on the 4H timeframe. After breaking above the $2.68–2.70 range — a level that acted as major resistance throughout May and early June — price is now retesting it as support. This kind of structure flip is often seen at critical turning points in a trend, especially when reinforced by other forms of confluence.
In this case, the horizontal demand zone aligns perfectly with an ascending trendline that has held since late June, adding technical strength to this area. So far, NEAR has maintained a series of higher lows, indicating bullish structure remains intact — but momentum is clearly weakening.
Stochastic RSI is deep in the oversold region, which may point to short-term bounce potential. However, bulls need to defend this level with conviction. If the trendline breaks and price closes below this support box, the door opens for a deeper retracement toward the $2.10 macro demand zone from early summer.
This setup is a classic example of trend continuation vs. trend breakdown. Holding the zone could lead to a resumption of the move toward $3+, while failure here would shift the market bias short-term.
📊 Watching for:
– Bullish engulfing or wick rejections off support
– Trendline breakdown and bearish close
– Volume confirmation for either scenario
This zone is where patience and confirmation matter most. Let the market reveal its hand.

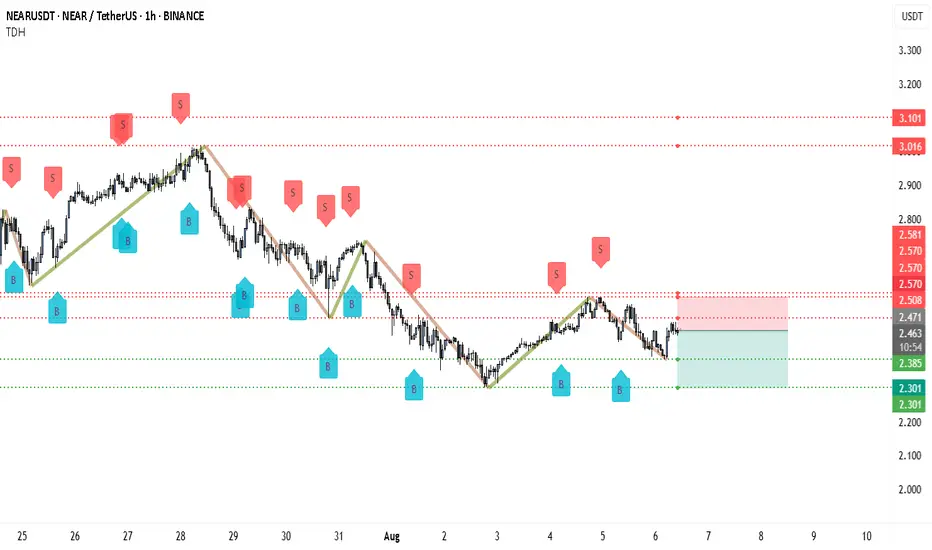
From $2.47 to $2.20 — Is NEAR Headed for a Sharp Selloff?NEAR is currently facing heavy selling pressure after failing to break above the $2.508–$2.570 resistance zone. This zone has acted as a strong supply area, with multiple “S” sell signals appearing here in recent sessions. The rejection from this level aligns with the broader downtrend structure that has been in place since July 29.
Price is now hovering just below the $2.471 level, which is acting as immediate resistance. A decisive rejection here is likely to trigger further downside toward the $2.385 support. If sellers maintain momentum, the next bearish targets will be $2.301 and potentially the $2.200–$2.150 zone on an extended move.
The market structure remains in a pattern of lower highs and lower lows, and the recent rally appears to be a corrective move rather than a trend reversal. Unless NEAR can close strongly above $2.570, the dominant trend remains bearish.
Trading Setup
• Entry: Around $2.470–$2.500 on rejection confirmation
• Stop-loss: Above $2.570
• Take-profit 1: $2.385
• Take-profit 2: $2.301
• Extended Target: $2.200–$2.150 if selling accelerates
• Risk-Reward: Around 2.5:1
Risk Caution
While the setup favors the downside, NEAR can experience sharp short-covering bounces. Traders should consider booking partial profits after a drop of around 100 pips in their favor to protect gains and reduce exposure to sudden reversals.
NEAR is unreasonably one of the lowest stillHowever I can see it is trying to grind higher and their community have bee jumping in with buys. The 1H mean is supportive of perhaps a change in its low position and depressed percentage losses over the last 24 hours comparatively to other no brand coins. Fundamentals aside, I think it may retest down a little perhaps or rise from the point it is at by up to 4% to regain some of the ground it lost before everything came down. Enjoy!
Extra context: For those who don't know my strategy, if this comes down, get me my limit order longs fill and tries to keep going further down, I will simply add to average my entry until it retraces and usually I can get out at break even, a small gain, or if it is taking too much of my time - a (palatable) small loss.

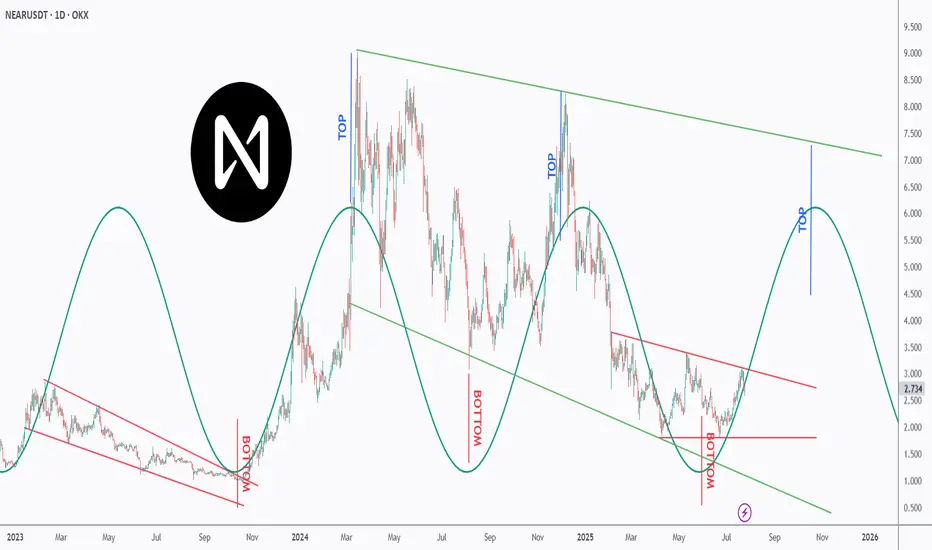
Is NEAR NEARing Its Next Explosion? Watch This Perfect Pattern!NEAR is dancing to a powerful rhythm — and it’s all in the cycles 🔁
This chart uncovers a repeating top-bottom cycle that has held since early 2023, with precise peaks and valleys emerging every few months 📉📈.
After bouncing off a major bottom at ~$2, NEAR is now approaching the mid-line of the descending red channel, suggesting a potential trend reversal is underway 🔄.
Each previous “BOTTOM” aligned with strong recovery waves 🚀, while the projected “TOP” now points toward the $6–7 zone — aligning perfectly with the upper green trendline resistance 🎯.
If the pattern continues, we could be looking at another macro push before year-end 2025 📆.
📊 Will NEAR ride this wave to new local highs — or is it just another lower high in the making? Either way, the rhythm of this chart is too clean to ignore.
📚 Always follow your trading plan regarding entry, risk management, and trade management.
Good luck!
All Strategies Are Good; If Managed Properly!
~Richard Nasr
NEAR Swing Long Idea - Altseason 2025📌 Fundamental Sentiment:
The entire crypto market is rallying, alongside other risk assets. This is mainly driven by U.S. policy expectations — Trump is pressuring Powell to resign and aggressively pushing for rate cuts from the Federal Reserve.
📌 Technical Analysis:
NEAR has recently broken and closed above a significant HTF support/resistance level.
Additionally, we’re now trading inside the 0.75 Fibonacci retracement level of the HTF bullish trend — which I define as the maximum discounted zone.
For this setup, I’ll apply my Deep Range Theory (DRT):
If price dips below the 0.75 zone and accumulates there,
Then breaks above 0.75 after a period of consolidation,
→ It signals that price aims for the 0.5 level of the range and will likely run HTF liquidity for either reversal or re-accumulation before continuation.
📌 Gameplan:
✅ Break and close above HTF S/R
⏳ Waiting for break and daily close above 0.75
🔄 Retest to LTF demand (4H–1H)
📈 A bounce on LTF demand will trigger the long setup
📌 Trade Management:
This is a mid-term swing trade, as I’m following the HTF bullish trend.
🎯 Target: $5 — which is approximately a +70% move from current price.
❗Risk Management:
If price makes a daily close back below 0.75 after breaking and closing above, I will exit the trade to preserve capital.
I’ll also monitor macro sentiment closely. If there's a sharp bearish shift, I may consider an early exit before reaching the HTF target.
—
🔔 Follow the channel for daily trade ideas & weekly macro recaps.
💬 Drop a comment below if you have any questions or insights!

Near is preparing for an bullish move soonNear is preparing for an bullish move soon
The price broke out from a strong channel pattern.
Given that BTC is making a pause NEAR is possible to correct near to 2.37 before it moves up more as shown on the chart.
I am looking at for normal targets but it can make also a bigger movement as well.
Target areas: 2.78; 3.2 and 3.7
You may find more details in the chart!
Thank you and Good Luck!
PS: Please support with a like or comment if you find this analysis useful for your trading day

#NEAR Update #2 – July 15, 2025#NEAR Update #2 – July 15, 2025
As seen on the chart, these are the positions I previously opened on NEAR. I didn’t use any stop-loss. Instead, I added to my position when the price dipped slightly, which allowed me to lower my average entry price.
Currently, the targets are clearly defined on the chart. I still do not plan to use any stop-loss, as I have available balance to add further in case of a drop. Those interested in evaluating this setup may consider doing the same.
NEAR has completed the correction phase of both its first and second impulsive moves. Based on this, the current target stands around the $2.78 level.

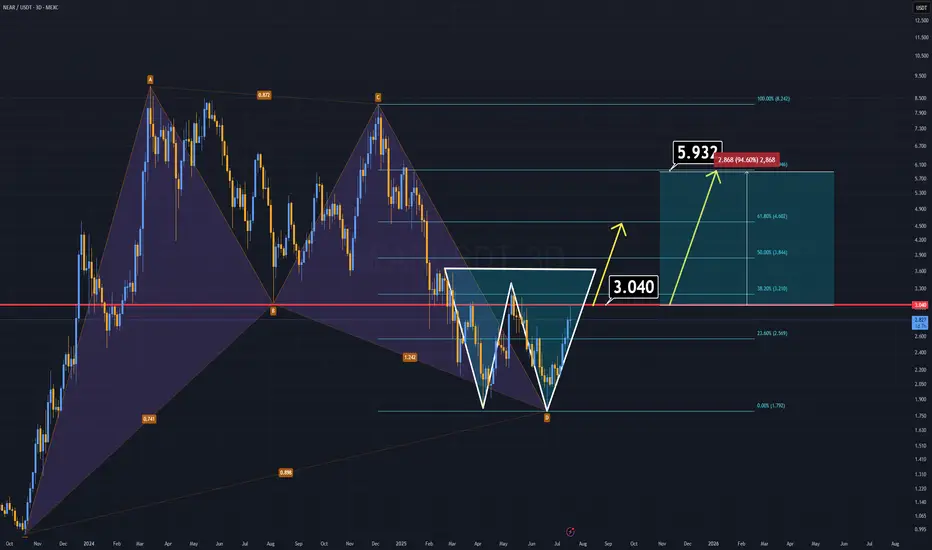
NEAR ANALYSIS (3D)NEAR Protocol has formed two strong bullish patterns and looks ready to climb, especially with the highly anticipated altseason on the horizon.
🔹 A harmonic structure from the previous cycle remains intact.
🔹 A double bottom formation is now clearly developing.
If NEAR manages to close a daily candle above the $3 level, we could see the price double in the short term.
On the fundamental side, NEAR is preparing for a vote to reduce its inflation rate. If the proposal passes, the circulating supply will decrease, potentially triggering a strong bullish run. As a leading AI-focused project, NEAR could spearhead the next wave of AI-related gains in the market.
(Read here for details):
www.near.org
All technical and fundamental signs point upward.
Thanks for reading.
$NEAR Local Still looks corrective..Though the CBOE:NEAR weekly looks good the same pattern on NEAR that I have highlighted here was also found on NYSE:FET and EURONEXT:RNDR local charts that has held these coins back from moving compared to others and appears corrective in nature and they all end at the daily 200EMA on bearish divergence.
Just something to look out for. A rejection in alts now could see fresh lows
Safe trading

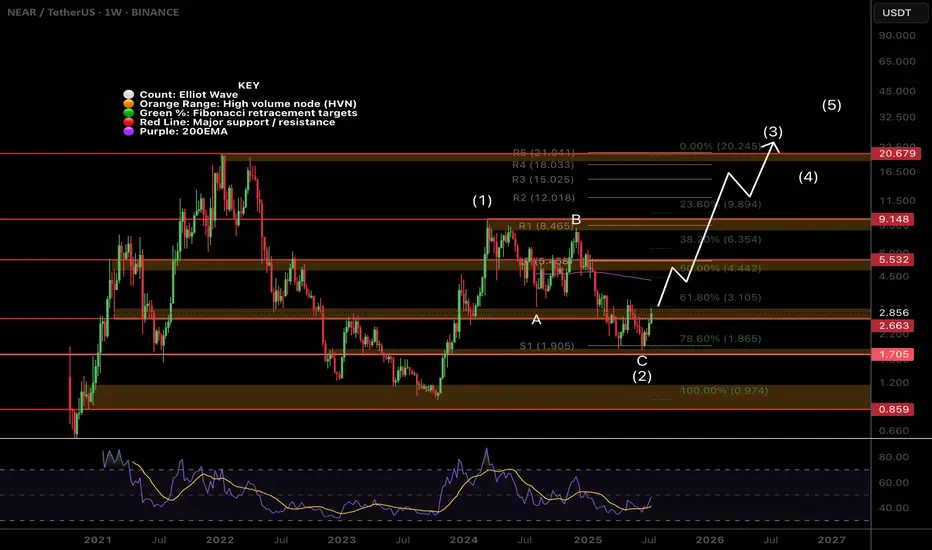
$NEAR Weekly TextBook Elliot Wave!CBOE:NEAR Weekly chart is a great demonstration of the text book motif wave followed by ABC corrective wave.
Bullish divergence has printed on the weekly RSI at the S1 weekly pivot support and the 'alt-coin golden pocket' 0.786 Fibonacci retracement. Price is closing in the major resistance High Volume Node.
The upside target is the newly printed weekly 200EMA followed by the weekly pivot and major resistance HVN just above $5.
A terminal target for this cycle may only see NEAR hitting all time highs around $21, the R5 weekly pivot point.
Safe trading
The Trader’s Journey: From Hope to MasteryLadies and gentlemen, fellow traders,
Whether you've just opened your first trading account or you’re already seeing consistent returns, I want to speak directly to your journey — The Trader’s Journey. It’s a path filled with hope, confusion, pain, breakthroughs, and ultimately, mastery.
Trading is not a get-rich-quick scheme — it’s a mirror. It shows you your discipline, your patience, your weaknesses, and your potential. Let me walk you through six powerful stages that every successful trader must face.
Stage 1: The Beginner
This is where the fire is lit.
You’ve just discovered trading — maybe you saw a video of someone making thousands in minutes, or a friend introduced you. You’re excited. You dream of quitting your job, making money in your sleep, living free. You don’t know much, but your heart is in it.
And that’s okay. Every trader starts here — driven by curiosity and ambition.
But beware: this is where most get trapped in illusion.
Stage 2: The Gambler
Without knowledge, the beginner becomes the gambler.
You enter trades without analysis. You chase signals from Telegram channels. You over-leverage, revenge trade, and your emotions run the show. You win once, lose three times, and still believe the next trade is “the one.”
At this stage, you’re not trading — you’re hoping. There’s no edge. Only chaos.
The gambler loses money, but gains the most valuable asset: humility.
Stage 3: The Sponge
Now that you’ve felt the pain of gambling, you decide to get serious. You become the sponge.
You buy courses. Watch endless YouTube videos. Download PDFs. Join mentorships. You’re learning — and learning — and learning.
But here’s the danger: information overload. You start to believe more knowledge equals better results. But unless that knowledge is applied, tested, and internalized, it’s just noise.
The sponge must eventually learn to filter, to focus, and to practice.
Stage 4: The Fighter
You’ve gained skills. Your chart looks cleaner. You can explain concepts now. You win some trades. You lose some. Sometimes you even feel like you’ve cracked it.
But you’re still fighting.
You jump from one strategy to another. You change your system after one bad week. You second-guess yourself. You're in the emotional trenches — and it’s exhausting.
But this stage is crucial. Because it’s here that most quit.
To move forward, the fighter must develop emotional control, patience, and a trading plan they can trust.
Stage 5: The Climber
Now, you're becoming a climber. You’ve found your edge. You follow your rules. You journal your trades. You’re no longer driven by thrill, but by execution. You’ve stopped chasing profits — now you chase process.
You start seeing consistent returns.
Risk management is no longer optional — it’s your oxygen. And trading is no longer about proving yourself — it’s about preserving and growing.
The climber is building the foundation of long-term wealth.
Stage 6: The Oracle
And finally, the oracle.
This trader has mastered not just the charts — but themselves. They understand that trading is 80% psychology and 20% execution. They know when not to trade. They know when to rest. Their results speak, but their ego is silent.
They don’t need to be right — they need to be disciplined.
They live by probabilities. They’ve seen every market condition. And they’ve turned trading into a business — not a hobby.
This is mastery. This is where the journey leads.
In Conclusion
My fellow traders — wherever you are in this journey, honor it. Don’t rush the process. Each stage has its purpose, and each stage will shape you.
You’ll lose trades. You’ll doubt yourself. You’ll feel like giving up.
But if you stay committed — not just to profits, but to growth — you will climb.
Remember: The market doesn’t reward perfection. It rewards consistency. It rewards discipline. It rewards self-awareness.
So I ask you:
🔥 Are you willing to fight through frustration?
🔥 Are you willing to outlast the noise?
🔥 Are you willing to master yourself before mastering the market?
Because if you are… then one day, you won’t just be another trader.
You’ll be a professional. An oracle.
Thank you — and trade well.
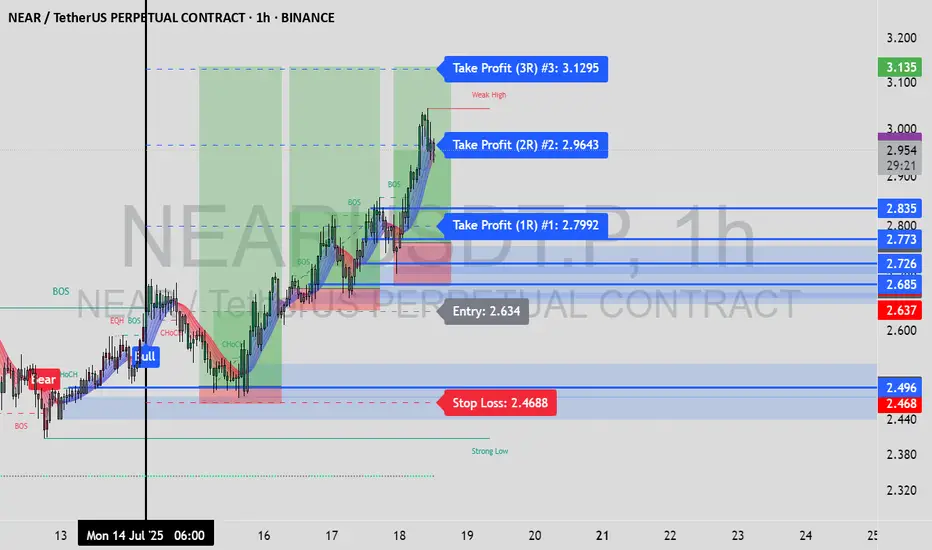

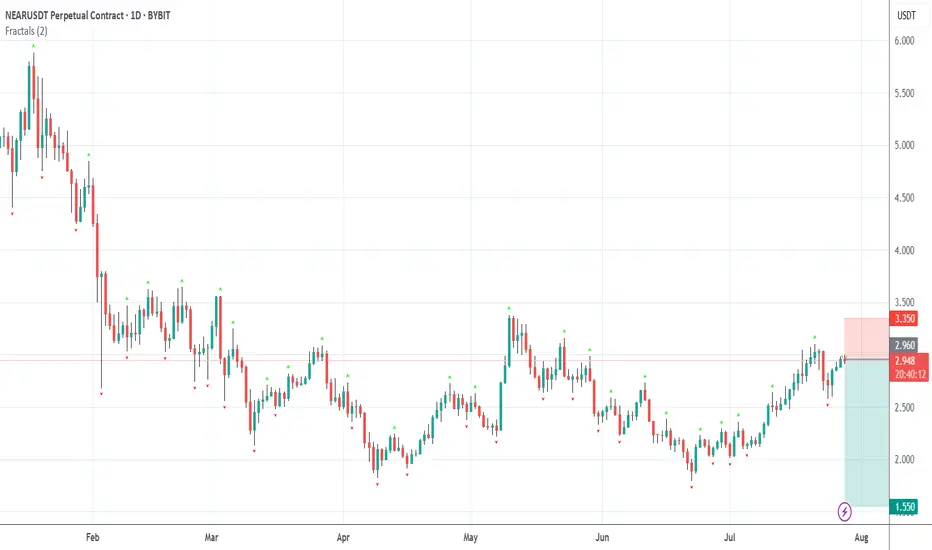
NEARUSDT.P Long Setup from Peak Formation Low I'm going long on NEARUSDT.P after spotting a clear change of character (CHoCH) on the 1-hour timeframe, confirming a shift from bearish to bullish structure.
📍 Entry: 2.678
🎯 Target: 3.135
🛡️ Stop-loss: 2.637
This setup formed at a peak formation low, with price tapping into a well-defined bullish orderblock, which acted as a strong demand zone. The CHoCH was the final confirmation for the entry, signaling smart money involvement.
This trade idea is suitable for:
🔹 Beginners – to learn how CHoCH + orderblocks provide high-probability entries
🔹 Intermediate traders – to refine entry/exit precision using market structure
🔹 Pro traders – for smart money confluence and risk-reward optimization
📈 Watching for price to respect the order block and push toward the target. RR is favorable. Manage risk accordingly!

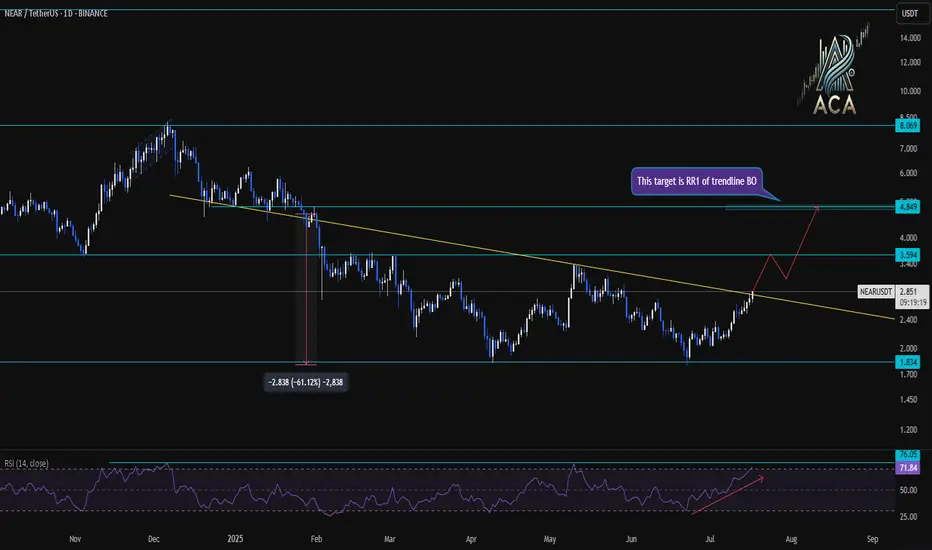
NEARUSDT Daily Chart Analysis|Strong Breakout & RSI ConfirmationNEARUSDT Daily Chart Analysis | Strong Breakout & RSI Confirmation
🔍 Let’s break down the latest NEAR/USDT daily chart, spotlighting critical resistance, target levels, and momentum signals.
⏳ Daily Overview
NEAR has confirmed a bullish breakout above its long-term descending trendline. This move comes with a surge in price and a strong daily candle—clear evidence of renewed bullish momentum.
📊 Momentum & RSI
RSI has surged to 76 (overbought zone), higher than the typical overbought level of 70. This spike reflects strong buying pressure, but also signals the possibility of near-term pullback or consolidation.
RSI-Momentum Convergence: The RSI uptrend is in lockstep with price action, confirming that bullish momentum is genuine and backed by increasing strength—not a divergence.
🔑 Key Levels
- First Resistance: $3.59—watch this closely as the next hurdle for bulls.
- Breakout Target: $4.85, which corresponds to the measured move (RR1) from the trendline breakout and aligns with the next horizontal resistance.
- Extension Target: $8.01 if momentum persists and price sustains above $4.85 in the coming weeks.
📌 Highlights
- Clear trendline breakout validated by strong RSI convergence.
- RSI has entered the overbought zone (76), backing momentum—watch for either breakout follow-through or brief cooling.
- Key levels: $3.59 (first resistance), $4.85 (breakout target).
🚨 Conclusion
Momentum is with the bulls after the breakout. Eyes on $3.59 as the near-term test; a clean move above opens up $4.85 and potentially $8.01 if momentum continues.
NEAR/USDT – Monthly Breakout in ProgressNEAR Protocol has just broken above the Monthly L1 resistance at $2.361, signaling a possible long-term bullish reversal. With strong price momentum, eyes are now set on the next major levels ahead.
🔍 Technical Breakdown:
Monthly L1 at $2.361 has been decisively broken with volume.
Clean structure forming higher lows since local bottom.
Bullish structure emerging on higher timeframes.
🎯 Upside Targets:
Target 1 – Monthly L2: $5.9868 (mid-term resistance zone)
Target 2 – Monthly L3: $10.30 (macro resistance, historical supply zone)
🛡️ Key Support Zones:
Retest of $2.36 could offer a high-R/R entry if bullish momentum holds.
Maintain bullish bias above $2.00 – invalidation below this level on high timeframes.
📈 Momentum picking up — if volume sustains and BTC remains steady, NEAR could be setting up for a larger trend continuation.
