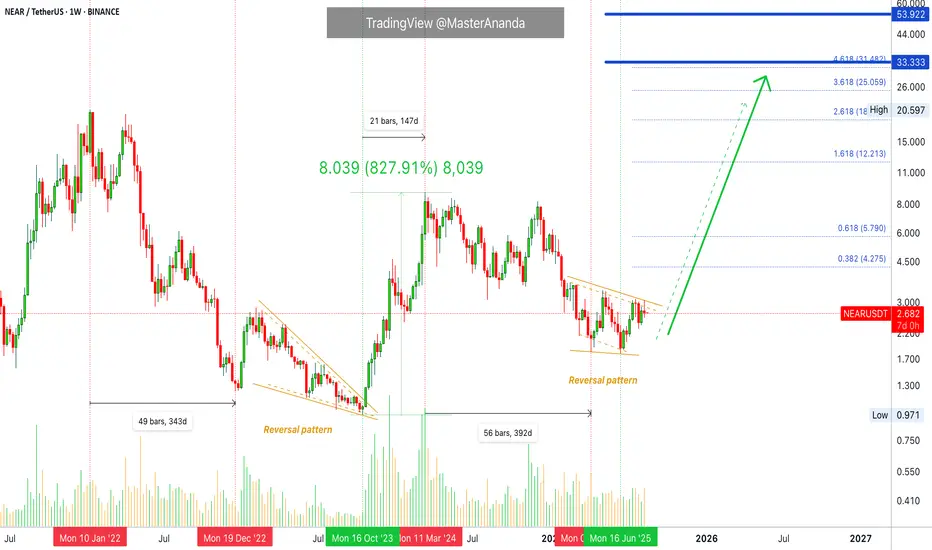
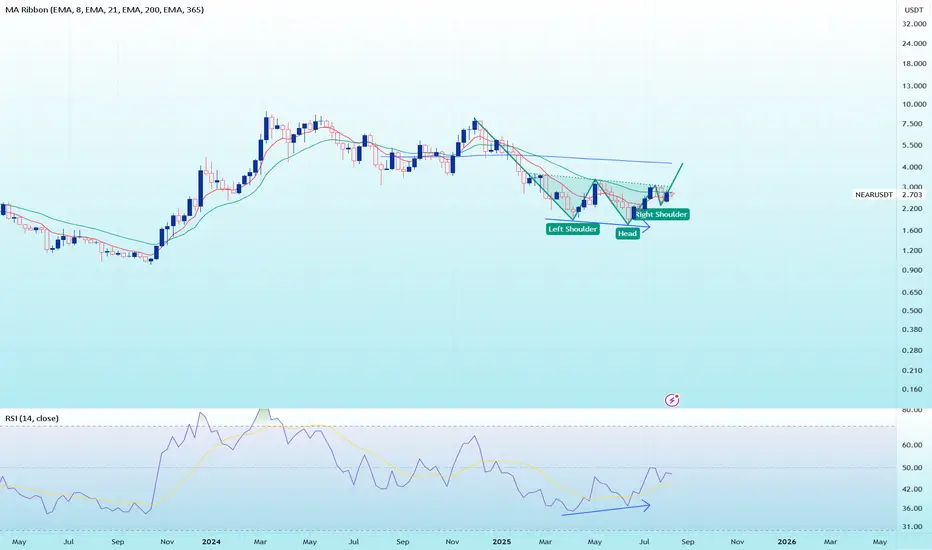
NEAR Protocol 2025 All-Time High & Technical AnalysisNEARUSDT previous all-time high happened January 2022. A year long bear market produced a reversal pattern between 2022 and 2023. This reversal pattern produced a 828% strong bullish wave between October 2023 and March 2024, 147 days.
The same dynamics are now present on this chart. NEARUSDT peaked March 2024 and started a very strong bear market. Between March 2024 and April 2025 we have 392 days. I am using the first low to match the 2022 bear market.
A reversal pattern is now present on the chart, same as 2022-2023. Here is the sequence:
1) Bullish wave.
2) Bear market (long-term correction).
3) Reversal (consolidation) pattern.
4) New bullish wave.
This chart looks similar to LINK but before the bullish breakout. What one does, the rest follows.
NEARUSDT is looking good. The last four weeks have been neutral. Here is another hidden signal. NEARUSDT closed four weeks but there is basically no change in price; more consolidation.
Four weeks and the action continues to happen at resistance. The local resistance of the reversal pattern.
From here on we can see a strong bullish advance. You can look at the pairs that are moving ahead such as XRP, ETH, ADA and BTC. All these hit a low in April followed by a bounce. Then another low in June followed by strong growth.
NEAR Protocol is bullish long-term. The bullish cycle for this project started October 2023. The recent low in June 2025 is a long-term higher low and we are about to experience a long-term higher high; a new all-time high.
Namaste.
NEARUSDT trade ideas
NEAR Is Getting Ready For Bullish MovementNEAR Is Getting Ready For Bullish Movement
Near didn’t rise as aggressively as other cryptocurrencies, so after the gains from BTC and ETH we could see ALTCOINS rise further.
I like Near in this area. If we look to the left of the structure in December 2024, the price tested 7.9.
I wouldn’t be surprised if we could see Near break out like that again. It’s pretty much the same situation.
If the price moves above the red zone at 3.1 the chances to rise further will rise.
Let's see if it makes this movement.
Target areas: 3.7; 4.7 5.9 and 7.9
You may find more details in the chart!
Thank you and Good Luck!
PS: Please support with a like or comment if you find this analysis useful for your trading day

NEAR USDT TARGET Price (USD)
🎯 Final Long-term Target
8.90 ┤ ⚡ Strong Resistance
6.00 ┤ 🎯 Major Mid-term Target
5.00 ┤
4.50 ┤ ⚡ Resistance
4.00 ┤
3.50 ┤ 🎯 Mid-term Target
3.00 ┤ ⚡ Resistance
2.80 ┤
2.60 ┤ 🎯 Short-term Target
2.46 ┤━━━━━━ 🔹 Current Price / Strong Support
2.20 ┤━━━━━━ ❌ Stop Loss Zone
Accumulation Zone: $2.46 — prime entry for smart money.
Short-term Breakout: $2.60 → $3.00 — early movers will ride the first wave.
Mid-term Momentum: $3.50 → $4.50 → $5.00 — follow the whale flows, strong upward push.
Long-term Surge: $6.00 → $8.00 → $10.00 — massive liquidity inflows can trigger parabolic moves.
💎 Key Points
NEAR has a growing ecosystem & adoption — perfect for whales to accumulate silently.
Low risk, high reward whale-friendly zones.
Clear roadmap from support → resistance → targets — no guesswork.
🐋 Whales are circling — the next breakout could be explosive. Accumulate now or miss the rocket! 🚀

NEAR : Buy < Hold for $5I have maintained this position with three targets and a specific stop loss.

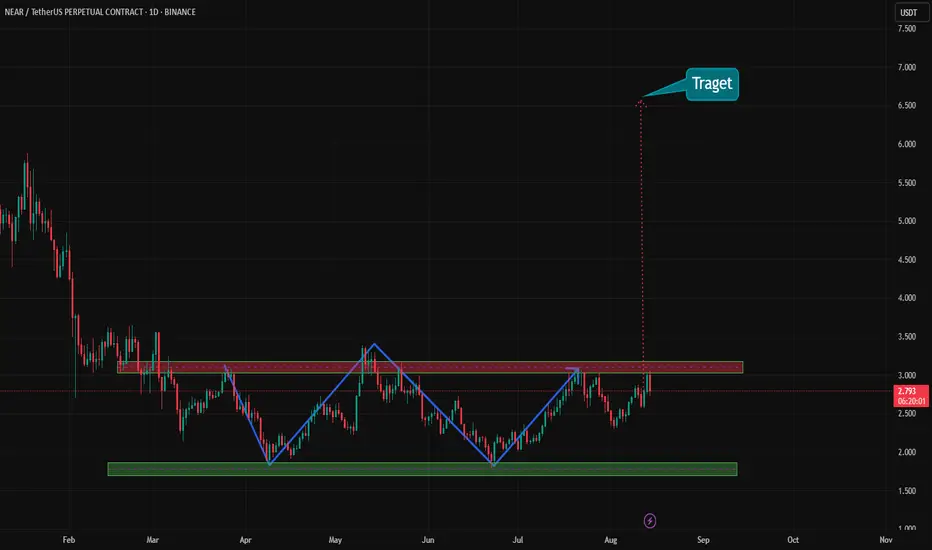
NEAR USDT Double Top Pattern in PlayNEAR USDT Double Top Pattern in Play
On the daily chart, NEAR/USDT has formed a clear double top pattern. Alongside this, a bearish divergence has also developed, suggesting weakness in upward momentum. At the moment, price is sitting near the key support zone around 2.3.
Support at 2.3 and the Bounce Possibility
If NEAR manages to hold this 2.3 support, a bounce could follow toward the 2.85 resistance area. This zone will act as a critical decision point. A rejection here would likely confirm the double top pattern and bring back selling pressure.
Break of 2.3 Could Lead to 1.8 Retest
On the flip side, if the 2.3 support fails, the double top comes into full effect, and NEAR could slide further down to the 1.8 area, where it has found strong support in the past. Until then, the focus remains on whether the current bounce can push through 2.85 or not.

NEARUSDT 1H SHORTAfter double top it is going towards its neckline.
And price below jaw give us more chances to break the neck and go towards TP

I think Near is getting ready for takeoffI think that after a downward wave, the e leg of the triangle will be completed.

Near Coin is forming a W Pattern on the 1D Chart💰 #The Near Coin is forming a W Pattern on the 1D Chart.
💵 Tp 1 : $ 3.29
💵 Tp 2 : $ 4.36
💵 Tp 3 : $ 5.17
💵 Tp 4 : $ 5.94
💵 Tp 5 : $ 6.55
NEARUSDT Bullish Rebound Setup From Pullback SupportAI Trade Setup Analysis
Timeframe: 2H (Two Hour)
Position Type: Long (Buy)
Entry Point: 2.7800
Positioned exactly between the stop loss and take profit zones, providing an optimal entry after a corrective pullback in an overall bullish move.
Stop Loss (SL): 2.5500
Placed below the recent swing low to protect against a deeper retracement. Risk is approximately -8.27% from entry.
Take Profit (TP): 3.3000
Target set at a key resistance level, offering a potential upside of around +18.71% from entry.
Risk/Reward Ratio: 2.26
A solid setup with more than double the reward potential compared to the risk.
Technical Outlook:
NEARUSDT has pulled back after a strong upward impulse and is now hovering near a prior support zone. This area could serve as a springboard for a rebound toward the next resistance at 3.3000 if buying pressure resumes.
Bullish Scenario: Sustaining price action above 2.7800 could trigger renewed upward momentum, targeting 3.3000.
Bearish Invalidation: A drop below 2.5500 would negate the bullish setup and suggest further downside potential.
Summary:
This trade setup is designed to capitalize on a potential bullish continuation from pullback support, with a defined stop below structural support and a target at the next major resistance.

NEAR — Taking Sell-Side Before ExpansionSweeping clustered lows for fuel, NEAR is lining up a textbook OB/FVG entry before pushing into 3.20–3.35 supply.
📊 BINANCE:NEARUSDT.P — Liquidity-Grab Pullback
🎯 Direction: Long (only after downside sweep confirmed)
📍 Entry Zone: 2.92 – 2.98 (15m bullish OB / 0.50–0.618 retrace of BOS leg)
🛑 Stop Loss: 2.86 (beyond sweep/OB edge; ATR buffer)
💰 Targets:
• TP1 — 3.15
• TP2 — 3.28
• TP3 — 3.45
📐 RR Ratio: ~3.6 : 1 (to TP2)
🧠 Trust Meter: ████████▒▒ — 88%
⸻
🔍 Why We Like It
• HTF Bias (12H/4H): Higher-high/higher-low structure; price pressing toward prior supply at 3.20–3.35 with OI rising & CVD improving (Velo → increasing participation).
• Sweep Trigger: Wick below 2.90–2.94 → close back inside = sell-side liquidity taken.
• LTF Entry: After sweep → 15m BOS up (close >3.02) → buy pullback into 2.92–2.98 OB/FVG in fib pocket.
• Participation Filter: Sweep candle vol ≥1.5× 20-bar avg; skip if delta keeps bleeding (no absorption).
⸻
📏 Management
• SL → BE+fees at TP1, trail under 5m HL ladder.
• Time-stop: no new HH in 50m → cut 50% or exit.
• Invalidate on clean 12H close < 2.86 or BTC.D spike up intraday.
• No new positions ±30m major news.
⸻
🚀 Candle Craft | Signal. Structure. Execution.

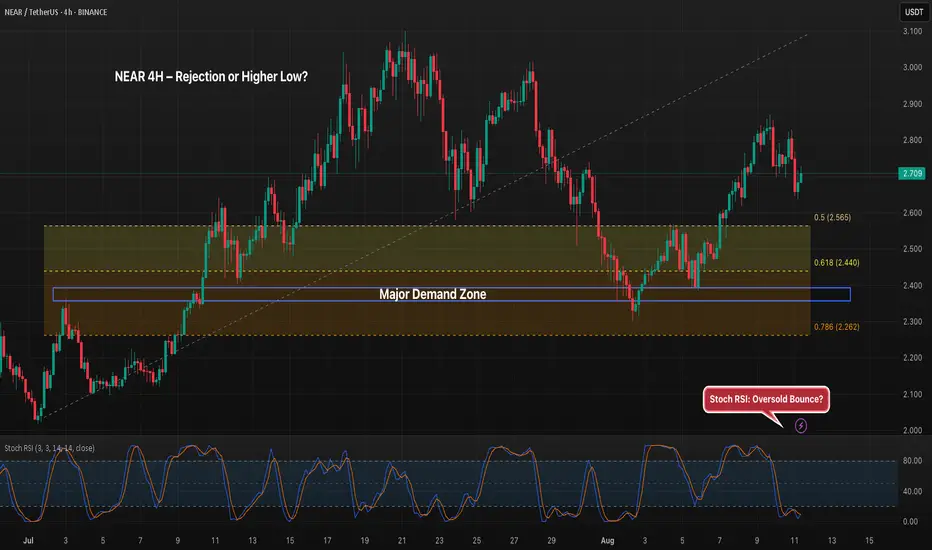
NEAR 4H – Pullback to Support, Higher Low Forming?NEAR is holding above the 0.5 Fib retracement at $2.565 after a recent pullback from local highs. A deeper retrace into the $2.44–$2.46 range (0.618 Fib + demand zone) could offer stronger support for bulls to defend. Stoch RSI is rebounding from oversold territory, hinting at possible momentum shift. A break back above $2.80 would suggest trend continuation, while losing $2.44 risks a retest of $2.26.
NEARUSDT?Hi,
Find price range 2.88-2.78
Is a good range for buys
NEAR past down trendline (1h)
All the best
Not a guru

From Daily Users to Price Targets: Why NEAR Might Be FinanciallyIn terms of daily active users, Near Protocol CBOE:NEAR just overtook Solana, hitting the 3 million user milestone and ranking second among the leading Layer-1 blockchains. With some predicting a price objective of US$10.82, a potential upside of almost 315% from its present price (~US$2.61), many experts believe NEAR is substantially undervalued. The spike in interest in NEAR on Google Trends also reflects positive sentiment, increasing the likelihood of fresh inflows from individual investors.
Based on the weekly chart, an inverted head and shoulder and a bullish divergence were spotted, therefore we're looking for a reversal momentum from Near Protocol to a bullish trend for the upcoming weeks.


$NEAR IdeaStacked BBs near the GP of the swing high to low, not a bad place to look to long if we get it. Applying small risk.

NEAR LONG 1. Chart Context
Pair: NEAR/USDT Perpetual (Bybit)
Timeframe: 1H
Indicators: Multiple Moving Averages (different colors), horizontal support/resistance levels, daily/weekly/monthly opens.
Setup: A long (buy) position with risk-to-reward defined.
2. Key Levels Marked
Monday High: Around 2.787 – resistance from earlier in the week.
Weekly Open: ~2.749
Daily Open: ~2.744
Monday Low: ~2.620 – support zone.
Monthly Open: ~2.559 – deeper support.
These opens and highs/lows are used as liquidity and directional bias levels.
3. Trade Setup
Entry: Near 2.721 (current market price at time of setup).
Stop Loss: Below Monday Low (~2.620) → protects against downside break.
Take Profit: Around 3.044 → aiming for previous high / liquidity above resistance.
4. Risk-Reward Ratio
Risk (stop): ~0.10 (2.721 → 2.620)
Reward (target): ~0.32 (2.721 → 3.044)
Risk:Reward ≈ 1:3 (strong setup in terms of R:R).
5. Strategy Behind It
Price is consolidating near Daily/Weekly Open → neutral zone.
Long bias likely comes from expectation that liquidity above Monday High will be taken before a reversal.
Moving averages are flattening → showing consolidation, so the trader is betting on upside breakout.
Stop below Monday Low avoids getting caught in a fakeout.
✅ Summary:
This setup is a long trade from 2.721, targeting 3.044 with a stop at 2.620. It’s based on liquidity levels (opens, highs, lows) and offers a clean 1:3 risk-reward ratio. The trader expects NEAR to push above Monday High before testing lower levels.

NEAR Breakout Watch – Testing Red Resistance!🚨 CRYPTOCAP:NEAR Breakout Watch – Testing Red Resistance! 🔴⏳
CRYPTOCAP:NEAR is testing the red resistance zone.
📊 If a breakout confirms, price could target:
🎯 First Target → Green line level
A successful breakout may trigger bullish continuation.

NEAR 4H Golden Pocket Bounce, Will Recovery Push Past 0.5 Fib?NEAR has rebounded strongly from the 0.618 Fib level within the golden pocket, reclaiming ground toward the 0.5 Fib near 2.46. A sustained breakout above this midpoint would strengthen bullish momentum and open the path toward 2.80+, while rejection here could send price back to retest the 2.31 zone. Momentum is recovering, but bulls still need confirmation to flip the mid-Fib into support.

NEAR 1H – Retest in Motion, But Will Bulls Hold 2.50?NEAR broke above its prior consolidation zone, retested it briefly, and surged higher toward the 2.63 area. Price is now pulling back, with the 2.50–2.52 support zone acting as the first key area for bulls to defend.
If the retest holds, the bullish path toward 2.70+ remains in play, following the projected stair-step structure. Failure to hold this zone could shift momentum toward the 2.45 mid-level support before any recovery attempt.
Key watchpoints:
– Break & retest structure at 2.50–2.52
– 2.70 upside target if momentum continues
– Stoch RSI resetting from overbought, offering potential for another push

NEAR Market OverviewAt the moment, we can see that the price is in an ABC correction. So far, it has only reached the 0.382 Fibonacci level and is currently sitting near the weekly pivot point at $2.58 . We're closely watching the price action here, as it's possible the price will extend to the 0.5 Fibonacci level at $2.672 , react from resistance, and then move down toward the $2.145 level.
If the price successfully breaks through and consolidates above, we could see a move up toward the resistance zone at $2.86–$3.029 .

NEAR 8H – Higher Low Formed, But Can Bulls Target 3.10 Next?NEAR is showing signs of a long-term structural shift after bouncing cleanly from a major demand zone and printing a higher low above trendline support. The current 8H structure reflects a steady recovery with three clear upside targets already mapped from the most recent breakout sequence.
With the ascending trendline holding and demand respected, this remains a long-term bullish setup — but continuation depends on reclaiming short-term resistance around $2.60.
Target zones:
– Target 1: $2.68
– Target 2: $2.90
– Target 3: $3.10 (supply zone retest)
Invalidation sits below the trendline (~$2.30), and confirmation comes with momentum through Target 1.
Well-structured recovery play — patience required, but technicals remain intact.

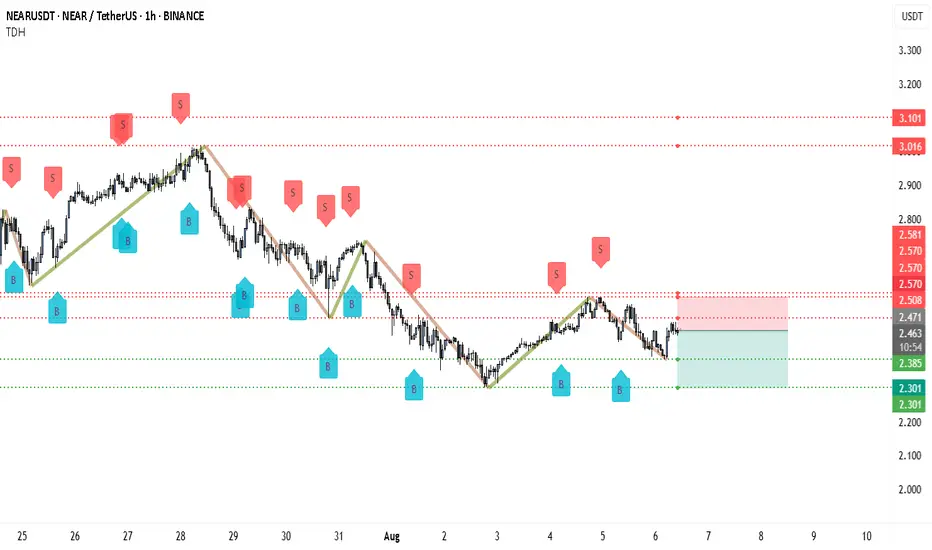
From $2.47 to $2.20 — Is NEAR Headed for a Sharp Selloff?NEAR is currently facing heavy selling pressure after failing to break above the $2.508–$2.570 resistance zone. This zone has acted as a strong supply area, with multiple “S” sell signals appearing here in recent sessions. The rejection from this level aligns with the broader downtrend structure that has been in place since July 29.
Price is now hovering just below the $2.471 level, which is acting as immediate resistance. A decisive rejection here is likely to trigger further downside toward the $2.385 support. If sellers maintain momentum, the next bearish targets will be $2.301 and potentially the $2.200–$2.150 zone on an extended move.
The market structure remains in a pattern of lower highs and lower lows, and the recent rally appears to be a corrective move rather than a trend reversal. Unless NEAR can close strongly above $2.570, the dominant trend remains bearish.
Trading Setup
• Entry: Around $2.470–$2.500 on rejection confirmation
• Stop-loss: Above $2.570
• Take-profit 1: $2.385
• Take-profit 2: $2.301
• Extended Target: $2.200–$2.150 if selling accelerates
• Risk-Reward: Around 2.5:1
Risk Caution
While the setup favors the downside, NEAR can experience sharp short-covering bounces. Traders should consider booking partial profits after a drop of around 100 pips in their favor to protect gains and reduce exposure to sudden reversals.