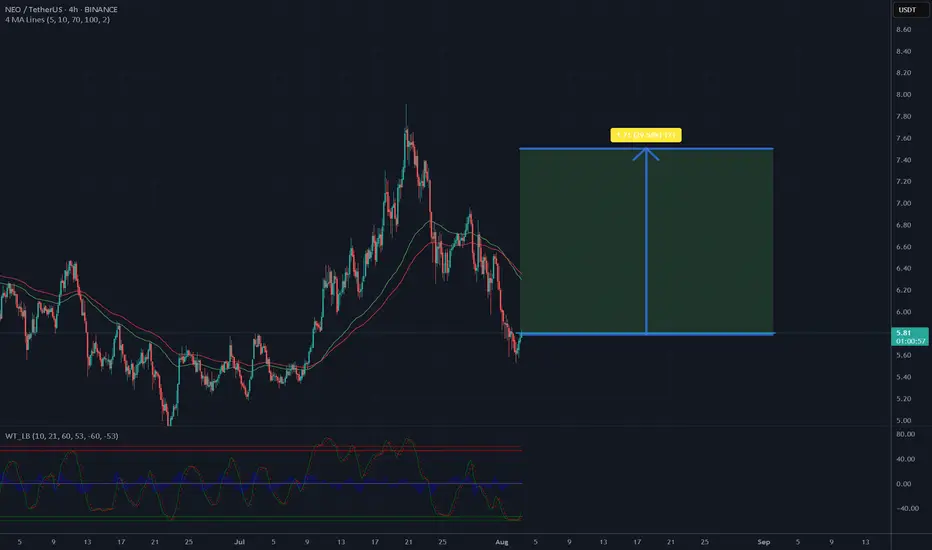
Is it a time for NEOUSDT? 30% potential profit - 7.50 USD targetThe chart shows a 4-hour candlestick pattern for NEO/USDT on Binance, covering mid-July to early August 2025. The price has recently declined from a peak near 8.81 USD to the current level of 5.76 USD, indicating a significant pullback. The moving averages (red and green lines) suggest a bearish tre
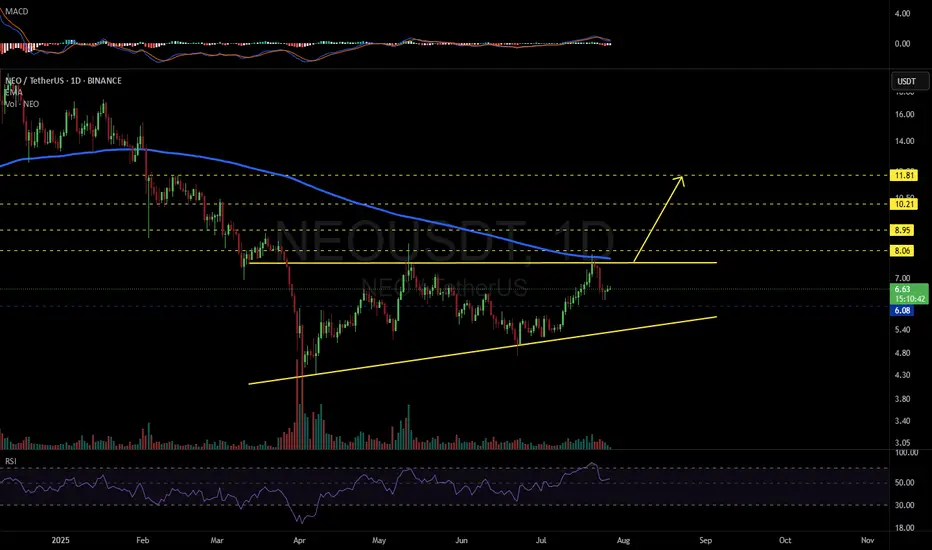
NEOUSDT 1D#NEO is moving inside an ascending triangle on the daily chart. Consider buying at the current price and near the support level at $6.08.
In case of a breakout above the triangle resistance and the daily EMA200, the targets are:
🎯 $8.06
🎯 $8.95
🎯 $10.21
🎯 $11.81
⚠️ As always, use a tight stop-los
NEOUSDT Accumulation in Progress After Strategic Stop-Loss SweepNEOUSDT broke below its micro ascending broadening structure in what appears to be a strategic deviation to trigger stop-loss liquidity. Following this flush, price action has settled into a brief consolidation phase, often indicative of underlying bearish weakness losing momentum.
Our focus shifts
Is NEO the Most Undervalued L1 Left? Entries,Targets & FA Inside📌 Coin: NEO (Neo)
💰 Buy Levels:
✅ First Entry: $7.00
✅ Second Entry: $6.00
🛑 Panic / SL Level: $5.00
🧠 Fundamental Analysis (FA) – In Short
*️⃣ Sector: Layer 1 / Smart Contracts / Digital Identity
*️⃣ Use Case: NEO is a smart economy blockchain, designed to combine digital assets, identity, and sma
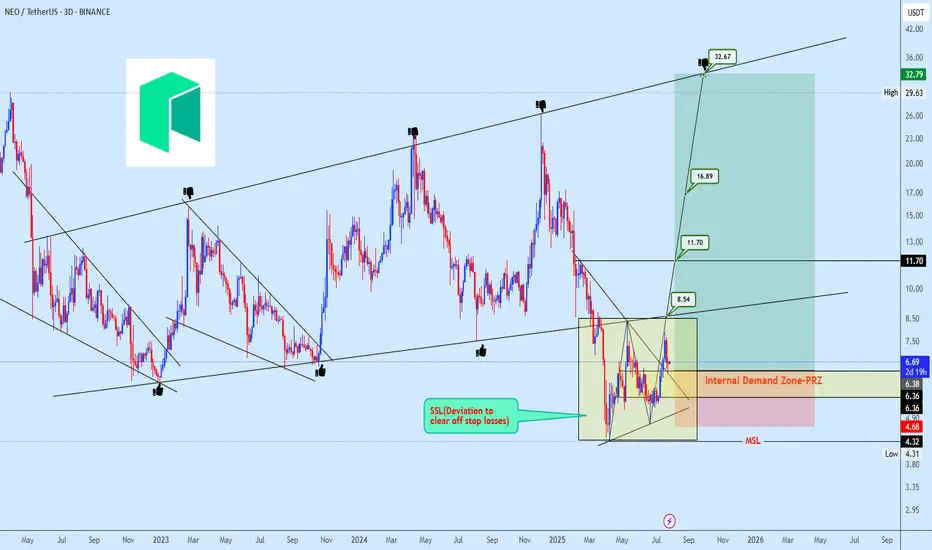
NEO's Situation, A Comprehensive Analysis !!!The price on the 3-D timeframe is within an ascending triangle, which can be promising. If the price breaks this pattern with bullish candles, it could easily rise by the distance of AB=CD .
Best regards CobraVanguard.💚


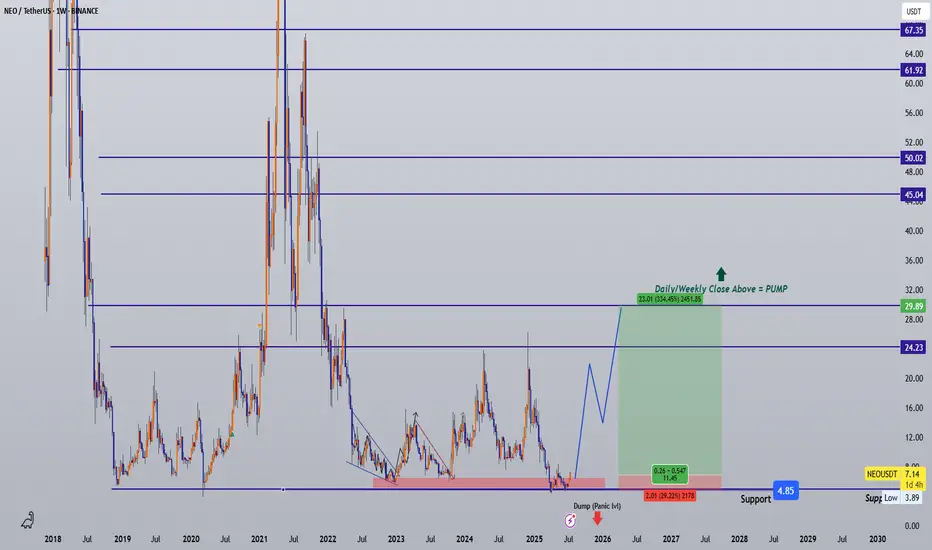
NEO/USDT – Strong Long-Term Accumulation Zone Detected!
🧾 Full Technical Breakdown (1W Timeframe):
NEO is currently revisiting a multi-year demand zone in the range of $3.90 – $4.50, a historically critical level where price has previously bounced before initiating massive rallies.
This zone has acted as a strong accumulation base during:
March 2020

#NEO is back at its historical demand zone!#NEO
The price is moving within a descending channel on the 1-hour frame, adhering well to it, and is on its way to breaking it strongly upwards and retesting it.
We have a bounce from the lower boundary of the descending channel, this support at 5.45.
We have a downtrend on the RSI indicator tha

NEOUSDT 1W AnalysisNEO ~ 1W Analysis
#NEO This is the lowest support block for now. Buy gradually from here with a short term target of at least 20%+

Potential NEO 1H ScalpBITGET:NEOUSDT is currently testing resistance around $6.66 with RSI in overbought territory, which could trigger a short-term pullback.
A 0.5–0.618 retracement into the unmitigated hourly FVG ($6.39–$6.47) could provide a compelling long entry, while allowing an RSI reset and potentially forming

See all ideas
Summarizing what the indicators are suggesting.
Oscillators
Neutral
SellBuy
Strong sellStrong buy
Strong sellSellNeutralBuyStrong buy
Oscillators
Neutral
SellBuy
Strong sellStrong buy
Strong sellSellNeutralBuyStrong buy
Summary
Neutral
SellBuy
Strong sellStrong buy
Strong sellSellNeutralBuyStrong buy
Summary
Neutral
SellBuy
Strong sellStrong buy
Strong sellSellNeutralBuyStrong buy
Summary
Neutral
SellBuy
Strong sellStrong buy
Strong sellSellNeutralBuyStrong buy
Moving Averages
Neutral
SellBuy
Strong sellStrong buy
Strong sellSellNeutralBuyStrong buy
Moving Averages
Neutral
SellBuy
Strong sellStrong buy
Strong sellSellNeutralBuyStrong buy
Displays a symbol's price movements over previous years to identify recurring trends.
Curated watchlists where NEOUSDT.P is featured.

Interoperability Crypto: Communication station
14 No. of Symbols
See all sparks