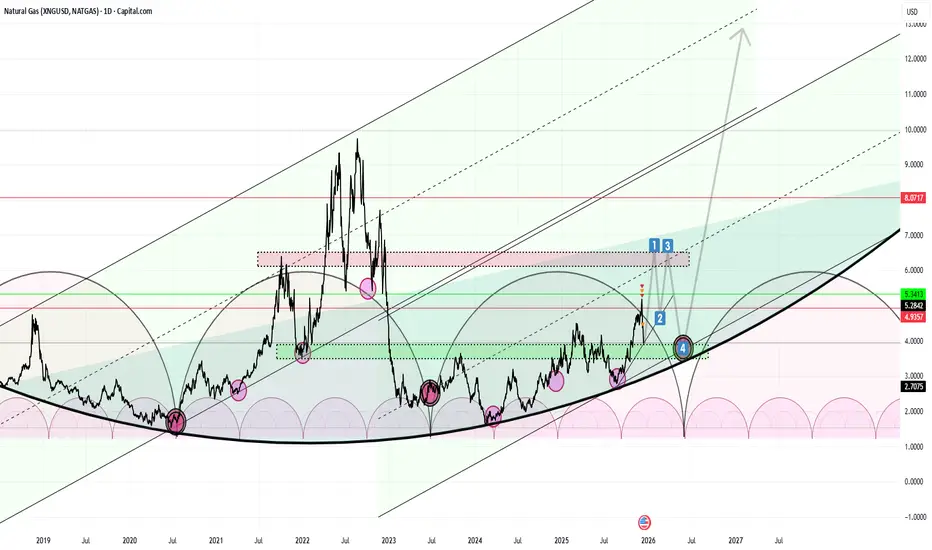
Extended Scinario to Fall Zone from 8.5This scenario appears more plausible to me personally, and confirmation of it should emerge in March 2026 if the critical buying zone is reached. The period from March to April could represent a very strong buying opportunity, potentially serving as the final upward move toward the 8.5 area.
This r

Natural Gas Market Signaling a Fresh Bullish Opportunity?🔥 XNG/USD – Natural Gas Bullish Swing Trade Play | Energy Momentum Setup 🔥
📌 Asset
XNG/USD – NATURAL GAS
Energies & Commodities Market
⏳ Trade Type: Swing Trade
🧭 Market Plan
📈 Bullish Bias Active
Natural Gas is showing upside continuation potential, supported by energy-sector momentum and price a

Is Natural Gas Bull Market Back? Natural gas saw an epic bounce today as 3 major weekly moving averages were defended.
Price action rallied sharply higher off the weekly 20, 50 & 200 MA.
This could be a massive bullish back test before we bounce back to new highs.
Resource stocks showed impressive strength during a day when m

Long-Cycle Market Observation-4 steps all we needThis discussion is intended as a personal analytical framework rather than financial or trading advice. Its purpose is to highlight rare, high-impact market opportunities and to avoid unnecessary conflicts between competing scenarios, particularly around the potential double-top region near 6 to 6.4
The Undeniable Chart of EverythingJune 2026 – A New Era: $3.2, the Price of No Return
This chart speaks for itself. Based on my experience and a clear reading of market dynamics, the rapidly accelerating demand for natural gas represents a structural shift rather than a temporary cycle. Natural gas is no longer merely a bridge fuel

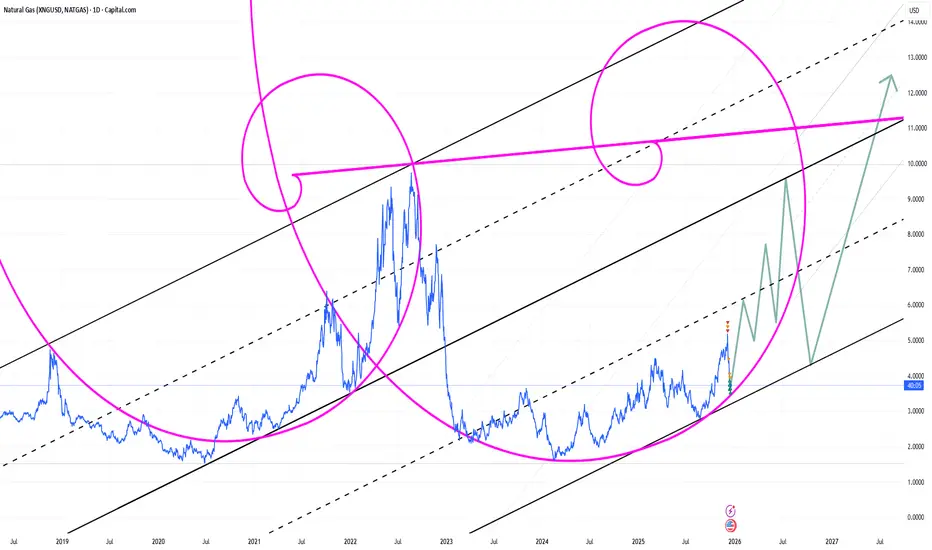
NAT-GAS World Cup 2027. ist Possible ??The chart was created purely out of curiosity to determine whether it might be possible. An idea that may seem unusual or unprecedented does not, in itself, invalidate its potential.
First time i have sugested the idea was in 2024 was also so crazy. but is it ?

Natural Gas Bullish Shift OutlookDetailed View
Natural Gas has completed its corrective downtrend phase.
Price has decisively broken the falling trendline, signaling loss of seller control.
The demand zone near 3.69 held firmly and created a higher low.
This zone now acts as a structural base.
The Micro Flip Zone marked the inten

Natural Gas (NG): The Freestyle Framework Natural Gas: The Freestyle Landscape
This is not a forecast. It is a dynamic structural map.
Designed for the discretionary trader, this "Freestyle" framework deconstructs Natural Gas into its core technical components: cyclical rhythms, evolving Elliott Wave structures, adaptive price channels, an

Natural Gas: Bullish Draw, Bearish RealityThe EIA surprise was bullish (−177 vs −170), yet no rally materialized. Traders are placing stronger faith in the weather driver.
CPC hints at substantial warming across key regions. The market has chosen to price in an anomalously warm end to December and a probable warm start to January. The anti

What Fibonacci trying to tell us !!!!!!In the markets, the Fibonacci spiral isn't just a pattern—it's an engine of momentum. It reveals where price action compresses, aligns, and ultimately explodes.
Think of a consolidation near a key Fibonacci level (like the 61.8% or 38.2% retracement) as the spiral winding tighter. This isn't random
See all ideas
Displays a symbol's price movements over previous years to identify recurring trends.