NKN showing good investment opportunityHi Everyone;
today we have a good reward Investment opportunity
it is more than 20 times the risk and the chart is look very promising.

NKN/USDT – Between Massive Accumulation or The Next Breakdown?🧩 Full Analysis & Market Narrative
NKN is currently at a critical historical crossroads.
After a prolonged downtrend since 2021, price has finally returned to retest the legendary support zone at 0.021–0.015, an area that once served as the foundation of its previous bullrun.
The massive wick down

NKNUSDT DETAILED ANALYSIS ON 15m. Chart Context
Pair: NKN/USDT
Timeframe: 15 minutes
Current Price: ~0.02796
Recent Move: Strong push upward into ~0.02900 followed by rejection.
📝 Key Levels
Resistance / Supply Area
Around 0.02900 – marked by the red circle.
Price rejected sharply here, showing sellers are active.
Break of S

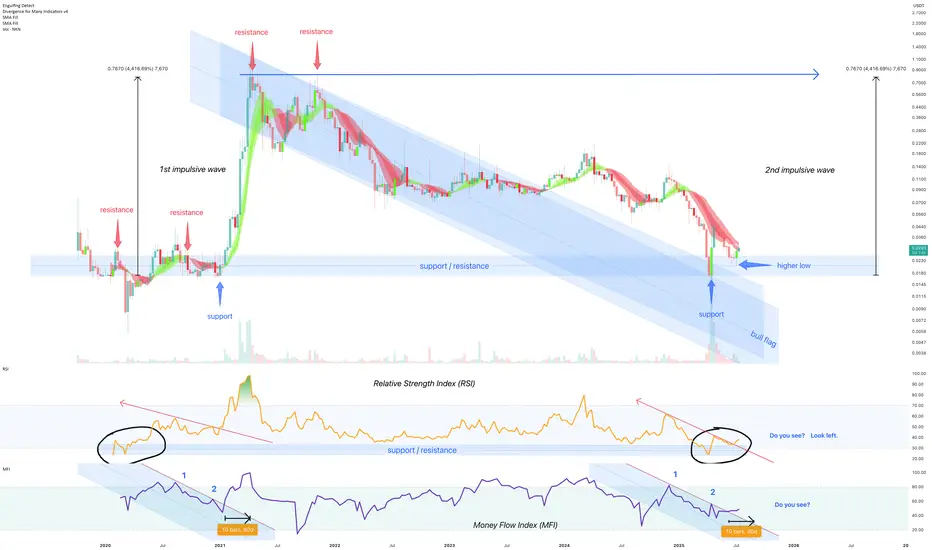
July 2025 - New Kind of Network (NKN) 4000% before October 2025** The months ahead **
On the above 8 day chart price action has corrected 99% since 2021. The chart now displays a compelling technical setup that suggests a strong bullish continuation could be on the horizon.
Bullish Arguments:
Price action forms a clear bull flag pattern
A classic continu
$NKNUSDT - Buy Zone ReadyBINANCE:NKNUSDT - I'd jump into NKN at this point. Price is a steal in my opinion. Wont sell this until it reaches a minimum 1x. All charts to me are posing a potential buy signal. All the best

NKN/USDT — Epic Reversal from Major Demand Zone🔍 Chart Breakdown:
1. Strong Historical Demand Zone:
Highlighted by the thick yellow box between $0.0055 – $0.0240.
Price has returned to this accumulation range, which previously launched a major rally in 2021.
2. Potential Bullish Reversal Pattern:
After hitting the lower support, recent week

NKNUSDT Forming Falling Wedge BreakoutNKNUSDT has recently confirmed a Falling Wedge Breakout Pattern, signaling a strong bullish reversal after a prolonged downtrend. This classic reversal structure is often considered a high-probability setup, especially when accompanied by increasing volume, as seen in this case. The breakout suggest

bullish fractalAs you can see, this fractal I think will happen
it's not a deal just watch it with your analyze

NKN Successfully breakout this resistant line Successfully breakout this resistant line with a short -term target of at least +10%

NKN Approaching Key Support – Big Move Loading?🚨 GETTEX:NKN 4H Chart Update!
🔺 Price is retesting the support zone of a symmetrical triangle—an area that often leads to high-volatility breakouts.
📈 If buyers hold the line, an explosive move could follow as triangle setups tend to trigger strong momentum!
👀 All eyes on this zone—will the bull

See all ideas
Summarizing what the indicators are suggesting.
Oscillators
Neutral
SellBuy
Strong sellStrong buy
Strong sellSellNeutralBuyStrong buy
Oscillators
Neutral
SellBuy
Strong sellStrong buy
Strong sellSellNeutralBuyStrong buy
Summary
Neutral
SellBuy
Strong sellStrong buy
Strong sellSellNeutralBuyStrong buy
Summary
Neutral
SellBuy
Strong sellStrong buy
Strong sellSellNeutralBuyStrong buy
Summary
Neutral
SellBuy
Strong sellStrong buy
Strong sellSellNeutralBuyStrong buy
Moving Averages
Neutral
SellBuy
Strong sellStrong buy
Strong sellSellNeutralBuyStrong buy
Moving Averages
Neutral
SellBuy
Strong sellStrong buy
Strong sellSellNeutralBuyStrong buy
Displays a symbol's price movements over previous years to identify recurring trends.