NKN showing good investment opportunityHi Everyone;
today we have a good reward Investment opportunity
it is more than 20 times the risk and the chart is look very promising.
Market insights

NKN/USDT – Between Massive Accumulation or The Next Breakdown?🧩 Full Analysis & Market Narrative
NKN is currently at a critical historical crossroads.
After a prolonged downtrend since 2021, price has finally returned to retest the legendary support zone at 0.021–0.015, an area that once served as the foundation of its previous bullrun.
The massive wick down to 0.0055 appears to be a liquidity sweep — where the market flushed out weak long positions before potentially beginning a new accumulation phase.
This yellow zone now stands as “The Last Defense Zone” for NKN to maintain its long-term technical structure.
---
🔹 Structure & Pattern
Primary Trend: Long-term bearish (since the 2021 peak).
Current Phase: Sideways/accumulation above major support.
Candle Behavior: Deep wick rejection signals strong buying reaction — a sign that demand is still present.
Key Scenario: This phase often marks the early stage of a macro reversal if confirmed by a weekly breakout.
---
🚀 Bullish Scenario
If price holds above 0.021–0.015 and successfully reclaims 0.0340, it could trigger a strong structural reversal.
Confirmation: Weekly close above 0.0340 → successful retest.
Upside Targets:
🎯 Target 1: 0.045
🎯 Target 2: 0.057
🎯 Target 3: 0.137–0.200
If momentum mirrors 2021’s cycle, extended targets up to 0.30–0.68 are still within reach.
📈 Market Insight:
From a market psychology standpoint, this zone may represent institutional accumulation — when public sentiment is exhausted and disbelief is high.
---
⚠️ Bearish Scenario
However, if the 0.015 zone fails to hold and weekly closes occur below it, the market could enter its final capitulation phase toward:
🩸 0.010 → minor psychological zone
🩸 0.0055 → final liquidity zone (panic selling area)
Such breakdowns would confirm a multi-year bearish continuation, potentially leading to new price discovery below 0.005.
---
🧠 Conclusion & Outlook
NKN is in a “survival phase” — a make-or-break moment between structural recovery and complete undervaluation.
The upcoming weekly candles will likely decide the next macro direction.
For experienced traders, this region offers a high-risk, high-reward opportunity, but strict risk management remains essential.
---
#NKN #CryptoAnalysis #Altcoin #TechnicalAnalysis #SwingTrading #SupportAndResistance #MarketStructure #AccumulationZone #CryptoChart #PriceAction #ReversalZone #BullishSetup #BearishScenario

NKNUSDT DETAILED ANALYSIS ON 15m. Chart Context
Pair: NKN/USDT
Timeframe: 15 minutes
Current Price: ~0.02796
Recent Move: Strong push upward into ~0.02900 followed by rejection.
📝 Key Levels
Resistance / Supply Area
Around 0.02900 – marked by the red circle.
Price rejected sharply here, showing sellers are active.
Break of Structure (BOS)
Previous highs (X) were broken, showing bullish momentum.
Point of Interest (POI) Zone
OB + FVG overlap (around 0.02700 – 0.02720)
This is the main demand zone to watch.
📊 Market Structure
Short-Term: Bullish (higher highs & BOS).
Pullback Likely: Price is retracing after rejection.
Confirmation Needed: A bullish reaction from the POI zone (engulfing / rejection wick / momentum candle).
🚀 Expectation
If price holds above the POI:
→ Likely continuation toward 0.02850 – 0.02900.
If POI fails:
→ Possible deeper retrace to 0.02650 support.
✅ Summary;-
NKNUSDT (15m) – Price rejected from 0.029 resistance after a strong move up. Watching 0.02700 – 0.02720 demand zone (OB + FVG) as POI. If bullish confirmation appears here, we can expect another leg upward toward 0.0285–0.029. If it breaks, deeper retracement toward 0.0265 possible.

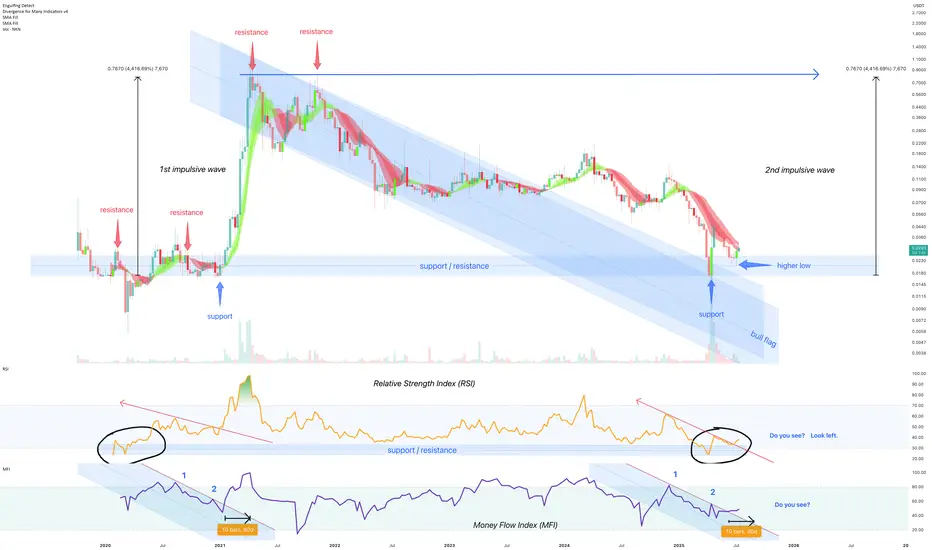
July 2025 - New Kind of Network (NKN) 4000% before October 2025** The months ahead **
On the above 8 day chart price action has corrected 99% since 2021. The chart now displays a compelling technical setup that suggests a strong bullish continuation could be on the horizon.
Bullish Arguments:
Price action forms a clear bull flag pattern
A classic continuation pattern typically appears after a strong upward movement (the "flag pole" or impulsive wave) and is followed by a period of downward consolidation (the "flag"). Albeit the formation rarely prints over such a long period of time for a crypto. The downtrend resistance is now broken with a support confirmation suggesting price action is preparing for another leg up, resuming its prior bullish momentum from 2020.
Strong support confirmation on past resistance
Look left. Historical price zone has proven its significance in the past, acting as both a ceiling and a floor for price movements. The current bounce off past resistance, marked by a higher low, indicates buyers are stepping in at this area. The volume entering the market, collecting emotional seller capitulations, is notable.
Relative Strength Index (RSI) confirms resistance breakout
The Relative Strength Index (RSI) reinforces the bullish outlook. Notice prior to the resistance breakout the index would now print a higher low from the same support area as in 2020.
Money Flow Index (MFI) resistance breakout
The Money Flow Index (MFI) in the lower panel provides excellent confirmation of the bullish sentiment, follow the money! The new money shows a clear pattern of resistance breakout, mirroring previous instances (marked as 1 and 2) where similar money flow preceded to see strong upward moves in price action. This indicates that money is flowing back into the token, for whatever reason I do not know.
Considering the clear bull flag formation, the strong bounce off a critical support/resistance zone, and the confirming signals from RSI and MFI indexes (or indices?!) NKN appears poised for a significant upward continuation.
Is it possible price action continues to print lower lows? Sure.
Is it probable? No.
Ww
$NKNUSDT - Buy Zone ReadyBINANCE:NKNUSDT - I'd jump into NKN at this point. Price is a steal in my opinion. Wont sell this until it reaches a minimum 1x. All charts to me are posing a potential buy signal. All the best

NKN/USDT — Epic Reversal from Major Demand Zone🔍 Chart Breakdown:
1. Strong Historical Demand Zone:
Highlighted by the thick yellow box between $0.0055 – $0.0240.
Price has returned to this accumulation range, which previously launched a major rally in 2021.
2. Potential Bullish Reversal Pattern:
After hitting the lower support, recent weekly candles suggest a potential double bottom or bullish engulfing pattern forming.
The yellow projected path shows a possible gradual recovery.
3. Layered Resistance Levels (Take-Profit Targets):
$0.0340
$0.0451
$0.0572
$0.1369
$0.2001
Up to $0.3050 as a major psychological barrier
4. Profit Potential:
From the current price (~$0.0242), reaching the top target of $0.3050 offers a potential gain of over +1100% in the medium to long term.
5. Bearish Exhaustion & Sentiment Shift:
The long downtrend since 2021 appears to be losing momentum.
Buyers are defending this critical historical support zone.
🛡️ Conclusion:
NKN is at a pivotal level, sitting on a historically significant support zone. If volume increases and price holds above the demand area, a strong reversal could play out. This setup presents a high-risk, high-reward opportunity worth monitoring closely in the coming weeks.
#NKN #AltcoinSeason #CryptoReversal #NKNUSDT #Binance #CryptoTrading #TechnicalAnalysis #BullishSetup #SwingTrade #CryptoNuclear

NKNUSDT Forming Falling Wedge BreakoutNKNUSDT has recently confirmed a Falling Wedge Breakout Pattern, signaling a strong bullish reversal after a prolonged downtrend. This classic reversal structure is often considered a high-probability setup, especially when accompanied by increasing volume, as seen in this case. The breakout suggests that bears have exhausted their momentum and bulls are stepping in with confidence. With this setup, an expected gain of 130% to 140%+ appears technically justified if follow-through buying pressure continues.
NKN (New Kind of Network) is gaining attention due to its innovative approach to decentralized communication networks. As the Web3 ecosystem grows, projects like NKN that enable secure, censorship-resistant data transmission are seeing increased adoption and speculative interest. This surge in investor attention is translating into positive price momentum, which aligns with the current technical breakout. The good volume behind the move strengthens the case for a sustained upward rally.
The current price action is forming strong higher highs and higher lows following the breakout, which could attract both short-term traders and long-term holders. Technical indicators such as moving averages and RSI are likely flipping bullish, supporting the view that this breakout may lead to a major trend shift. If bullish momentum continues, NKNUSDT may reclaim key resistance levels and potentially exceed the projected targets.
Given the overall positive sentiment across altcoins and the strategic utility of the NKN project, this breakout could be the start of a significant trend. Traders and investors should keep an eye on continuation patterns and monitor volume closely for validation.
✅ Show your support by hitting the like button and
✅ Leaving a comment below! (What is You opinion about this Coin)
Your feedback and engagement keep me inspired to share more insightful market analysis with you!

bullish fractalAs you can see, this fractal I think will happen
it's not a deal just watch it with your analyze

NKN Successfully breakout this resistant line Successfully breakout this resistant line with a short -term target of at least +10%

NKN Approaching Key Support – Big Move Loading?🚨 GETTEX:NKN 4H Chart Update!
🔺 Price is retesting the support zone of a symmetrical triangle—an area that often leads to high-volatility breakouts.
📈 If buyers hold the line, an explosive move could follow as triangle setups tend to trigger strong momentum!
👀 All eyes on this zone—will the bulls defend it? 🧐

$NKN Heating Up — Breakout Imminent?GETTEX:NKN is waking up.
It held that trendline perfectly, and now it’s pushing back strongly.
Price was getting squeezed in that wedge for days looks like it’s ready to pop.
That top line? It’s not going to hold for long.
Volume is picking up, and this move could easily send it flying to $0.06.
Feels like one of those setups where momentum just builds up and boom, breakout.
Keep your eyes on it. This one’s heating up fast.
DYOR, NFA

ORDER - NKN/USDT ShortORDER - #NKN/USDT
Direction: #Short 🔴
Entry Price: 0.03866
Stop Loss: 0.041995
Target 1: 0.036326
Target 2: 0.033991
Target 3: 0.031657
Target 4: 0.029322
Target 5: 0.026988
Note: Our software manages trades dynamically. Positions may close early (before SL or final TP) based on market conditions, with SL moving to breakeven as targets are hit. Even if a trade appears negative here, it was likely closed in profit or before SL was triggered.

NKNUSDT - Buy it now!After a long downtrend of approximately 90%, the bearish trendline has been broken — this is a strong signal that the current price is a great entry point for buying.
my target is previous top at 0.14$

NKNUSDTRISKY DUE BINANCE MONITORING TAG
📊 Technical Breakdown
📉 Pattern: Falling Channel
The price has been moving inside a descending channel, which often acts as a bullish continuation or reversal pattern.
A breakout above the upper trendline of the channel has been marked as the entry point, signaling a potential reversal of the downtrend.
💵 Entry Level
Marked at: 0.0268 USDT
Entry is placed slightly above the breakout zone of the falling channel.
🛑 Stop Loss (SL)
Marked at: 0.0256 USDT
SL is positioned just below recent consolidation support and below the lower boundary of the channel.
🎯 Take Profit (TP) Targets
Target Price (USDT)
TP1 0.0313
TP2 0.0349
These zones align with previous support-turned-resistance levels from before the sharp price drop.
TP1 is a conservative level, while TP2 aims for a larger breakout recovery.
📈 RSI Analysis
RSI formed a bullish divergence with price (price made lower lows while RSI made higher lows).
RSI has crossed above the 50 level, indicating building bullish momentum.
A breakout from the RSI trendline confirms the strength behind the move.
✅ Summary: Trade Setup
Parameter Value
Entry 0.0268 USDT
Stop Loss 0.0256 USDT
Take Profit 1 0.0313 USDT
Take Profit 2 0.0349 USDT
Risk/Reward ~1:2 to 1:4

NKNUSDT 1WNKN ~ 1W Analysis
#NKN Buy back when testing this support with a short -term target of at least 15%+.

NKNUSDT 1WNKN ~ 1W Analysis
#NKN Maybe this support block you can consider to start buying back from here with a short -term target of at least 20%+.

NKNUSDT Big Buy opportunityNKNUSDT is exhibiting a falling wedge formation, with price recently rebounding sharply from the $0.0472 demand zone, indicating a potential completion of the corrective structure. This level aligns with a key liquidity zone, reinforcing its significance as a possible reversal point. The immediate resistance at $0.10 serves as the breakout threshold, and a confirmed bullish breakout above this level would validate the wedge pattern, signaling a shift in market structure toward a trend reversal.
If this scenario plays out, we anticipate a measured move towards key supply zones, aligning with Fibonacci retracement levels for profit-taking opportunities. Failure to hold the current structure could lead to further accumulation within the broader consolidation range.
Watch price action closely as volatility is expected.

Expecting a Upside in NKN-USDT pairIt's on breakout zone. I think it's being accumulated and near breakout. Soon we can expect a 100% upward movement in short-term.

NKNUSDT 1WNKN ~ 1W Analysis
#NKN on time frame 1w, This coin re -tests this support, Buy from here with a minimum target of 20%+

NKN suitable for patient peopleIf I have cold money I will buy this coin, this is old whale scenario
this whale keep price in this range and last dump is just manipulation
But cons of NKN maybe the whales playing slow and fast
slow when accumulation phase and fash when distribution phase

NKN Inverse Head and ShoudlerNKN, no one talk about it
But this coin perform as well in chart pattern like mini shoulder on going created here
This scenario valid if we not break 0.8
cheers

NKNUSDT - 125% Profit @ 5x LeverageNKNUSDT on the 1-hour timeframe exhibited a strong bearish momentum, achieving 125% profit at 5x leverage. The short trade setup, captured using the Risological Swing Trading Indicator , has successfully hit TP1 to TP3, with TP4 likely to be achieved shortly.
Key Levels:
TP1: 0.12615 ✅
TP2: 0.11428 ✅
TP3: 0.10241 ✅
TP4: 0.09508 🔄
Technical Analysis:
The trade commenced at 0.13348 with a stop-loss set at 0.13942, ensuring effective risk management.
The price has consistently moved below the Risological trend line, affirming the downtrend.
The sharp breakdown below key support levels accelerated the move towards the profit targets. The setup reflects the accuracy and power of the Risological Swing Trading Indicator in identifying high-reward, low-risk opportunities.
Namaste!

NknNkn usdt Daily analysis
Time frame daily
Risk rewards ratio >2
Target 0.174
If nkn grows by about 5% from here, we can raise our LS to 99 cents.
