Market insights

ABB | Risk-Takers Buy @LTP or Safer Entry above @5145 ABB | Risk-Takers Buy @LTP or Safer Entry above @5145 | SL below 4850 | 1st Target 6120
Disclaimer (Please Read Carefully):
This is not investment advice. The stocks shared here are purely for educational and informational purposes. Please do your own research or consult with a financial advisor before making any investment decisions.
******************************************************************************************************************
Stock market में सिर्फ risk ही risk होता है। Market में survive करने का एक ही तरीका है, stop loss को पूरी discipline के साथ accept करना। अपनी capital को protect करने का इससे बेहतर कोई तरीका नहीं है।
मैं जो भी stock यहाँ शेयर करता हूँ, वो या तो मेरी existing holding में होता है, या फिर मैं उसी level पर fresh buying या add on करता हूँ जिसे मैं mention करता हूँ।
मैं हमेशा buy करते समय अपने system में stop loss ज़रूर लगा देता हूँ, और मेरे लिए stop loss, target से भी ज़्यादा important होता है।
Target achieve होने के बाद मैं पहले profit book करता हूँ और फिर retest या fresh breakout का इंतज़ार करता हूँ।
मैं सिर्फ breakouts पर buy करता हूँ, कभी भी support पर नहीं। और मैं resistance पर sell भी नहीं करता।
******************************************************************************************************************
The stock market involves risk, risk, and only risk. To survive in the market, accepting stop-loss with discipline and without hesitation. There is no other way to protect you capital.
Any stock I share is either already part of my existing holding or I take a fresh entry at the same level I mention. I always place the stop-loss in my system at the time of buying, and I give the highest importance to stop-loss more than the target. Once the target is achieved, I usually book profit once and then wait for either a retest or a fresh breakout.
I buy only on breakouts, never on supports. I also do not sell at resistance levels.
That is simply my trading style.

ABB-BUYPlease stick to levels provided on the chart. Trigger SL and Targets and please dont wait.
Please evaluate the possible loss before trying the idea.
Exit 50% on 1st Target and 25% each on 2nd and extended targets.

Technical Analysis: ABB India Ltd. (NSE: ABB) This analysis interprets the monthly chart of ABB India, focusing on its long-term trend structure, key support and resistance levels, and momentum indicators, within the context of the current macroeconomic environment.
The current market structure presents a compelling parallel to the 2002-2007 bull market cycle.
2002-2007 Cycle: This period was characterized by a significant uptrend, followed by a multi-year corrective phase where the price ultimately found durable support at the 100-period Simple Moving Average (SMA).
Current Cycle: The rally from the 2020 lows mirrors the earlier expansion. The price is now in a consolidation phase near all-time highs, showing signs of short-term exhaustion.
Thesis: The observation that historical patterns may "rhyme" is valid in technical analysis. The current consolidation, coupled with weakening momentum, suggests a potential for a deeper pullback. A test of the 100 SMA, similar to the post-2007 correction, is a plausible scenario to monitor.
Price Action and Momentum Analysis
Relative Strength Index (RSI)
A distinct bearish divergence is visible. While the price has forged higher highs, the RSI has failed to achieve corresponding peaks. This suggests that the underlying buying momentum is waning and raises the probability of a price correction or extended consolidation.
Moving Average Convergence Divergence (MACD)
The MACD has shown a bearish crossover, with the MACD line moving below the signal line. The histogram has also turned negative, confirming a shift from bullish to bearish short-term momentum.
Synthesis and Conclusive Interpretation
Considering the technical signals in conjunction with the challenging macroeconomic backdrop of elevated inflation and recessionary fears, a cautious stance is warranted.
Primary Outlook: The bearish divergence on the RSI and the negative MACD crossover are leading indicators suggesting that the uptrend is losing strength. The price is currently range-bound, indicating a balance between buyers and sellers.
Bearish Scenario: A definitive break below the consolidation range could initiate a corrective move towards the first support at 4065. The most significant test would be the 2687 level, where the 100 SMA provides a historical and technical anchor. A failure to hold this level would significantly increase the odds of a prolonged bear market phase, targeting the third support at 1559.
Bullish Scenario: For the bullish trend to resume, the price must break out of the current consolidation and decisively clear the 8467 resistance level with strong volume and renewed momentum.
In summary, while the long-term trend remains structurally intact, the short-to-medium-term indicators point towards a high probability of a corrective phase. The potential for the current market to "rhyme" with the post-2007 pullback is a valid thesis, with the 2687 support level being the critical pivot point to monitor.
The critical price zones for defining the market's next directional move are clearly demarcated.
Level Type Price Level Significance
Resistance 8467 The primary overhead barrier and all-time high. A sustained break above this level would signal a continuation of the primary uptrend.
1st Support 4065 The first significant area of potential demand and a previous consolidation zone.
2nd Support 2687 A crucial support level that shows confluence with the 100 SMA. This is the most critical zone to watch for a potential trend reversal or continuation.
3rd Support 1559 The final major structural support from the prior breakout area.

ABB India Ltd – Bearish Setup (1H Chart)ABB India Ltd – Bearish Setup (1H Chart)
Price is consolidating in a descending triangle after a sharp drop.
A breakdown below the support zone could trigger another leg down towards ₹4927, mirroring the previous move of ~4.3%.
📉 Pattern: Continuation triangle
📊 Bias: Bearish below 5150
🎯 Target: 4925
⛔ Stop-loss: Above 5220
What’s your view — breakdown or bounce incoming?

ABB INDIA (SWING LONG SETUP) (EDUCATIONAL ONLY)ABB India is consolidating near the ₹5,020 – ₹5,130 demand zone after a corrective phase.
The stock is showing support confirmation with potential for a trend reversal.
Risk is well-defined with a strict stop-loss, while multiple resistances provide clear target levels.
✅ Trade Plan:
Entry Zone: ₹5,020 – ₹5,130 (Ref: ~₹5,120)
Stop-Loss: Below ₹4,650 (swing support breakdown)
🎯 Upside Targets (from ~₹5,120):
T1: ₹5,470 → +6.8% (near-term resistance)
T2: ₹6,061 → +18.4% (supply zone & horizontal resistance)
T3: ₹6,788 → +32.5% (swing high)
T4: ₹7,781 – ₹7,960 → +52% – 55% (long-term resistance / breakout level)
📊 Technical Insights:
•Stock is holding the demand zone after a correction.
•Volume stability indicates possible accumulation.
•Risk-to-Reward Ratio (RRR > 3) makes this swing setup attractive.
•Breakout above T2 can trigger strong momentum towards positional targets.
⚠️ Disclaimer:
This is an educational idea only, not a buy/sell signal. Please do your own research or consult a financial advisor before taking any trade.

ABB INDIA LTD Swing Trade📊 Price Action & Trend Analysis
Analyzing market trends using price action, key support/resistance levels, and candlestick patterns to identify high-probability trade setups.
Always follow the trend and manage risk wisely!
Price Action Analysis Interprets Market Movements Using Patterns And Trends On Price Charts.
👉👉👉Follow us for Live Market Views/Trades/Analysis/News Updates.

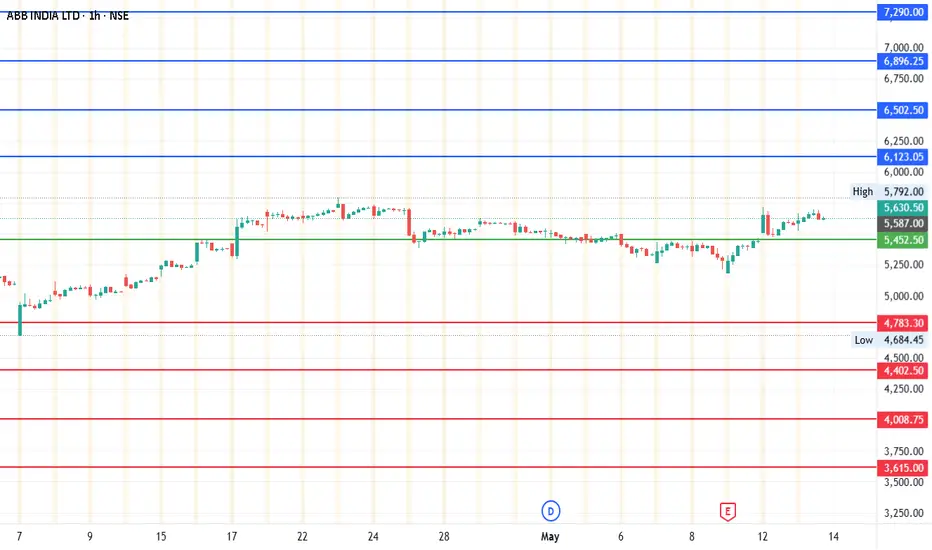
#ABB India | 1500-Point Move on the RadarAfter a strong breakout from the recent consolidation zone, ABB is showing renewed momentum with clear signs of accumulation and strength in trend.
We're now anticipating a fresh 1500-point move based on technical structure and price action dynamics.
Current Price: 5635
Mid-Point: 5452.50
Upside Targets: 6123.04, 6502.50, 6896.25 and7290.00
Downside Targets: 4783.28, 4402.50, 4008.75 and 3615.00
Support: 5164.05
Resistance: 5743.58
Disclaimer:
This analysis is for educational purposes only. Do your own due diligence before acting on any trade plan.
Possible Swing Trade in ABB1. MACD Signal turned green
2. RSI crossing above 50
3. Stock returning after forming a base at 50.0% retracement
5. Good weekly close
6. Risk - Reward is more than 2
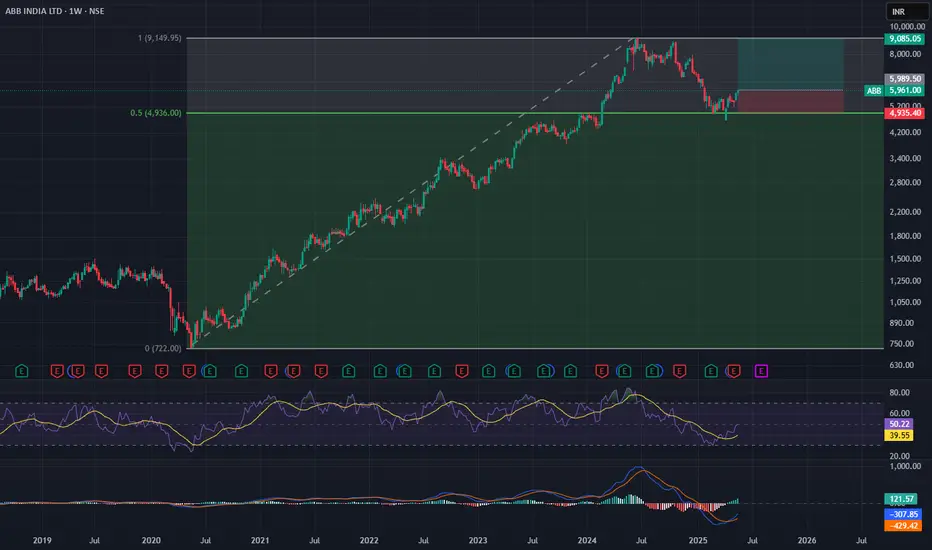
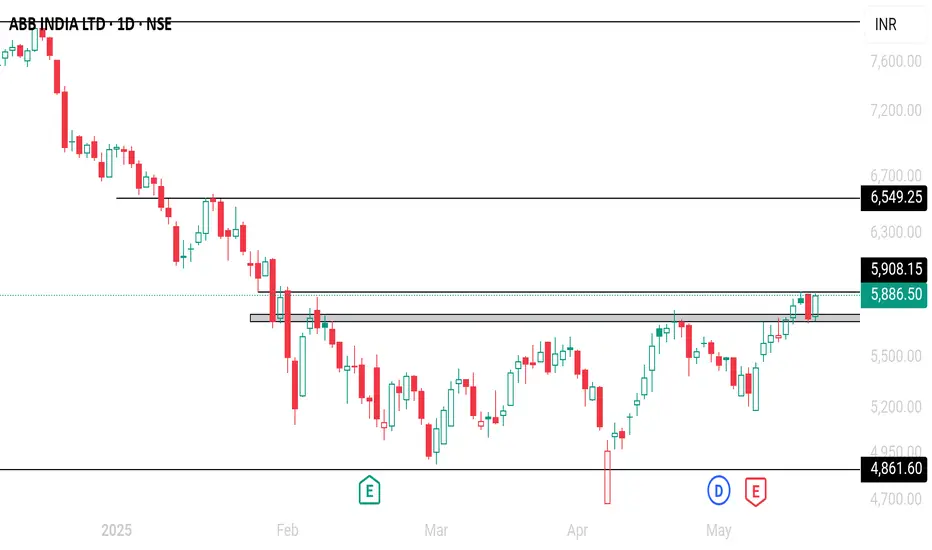
ABB India ???I Am little confused with my technical analysis on ABB India 1day time frame, need help,

Review and plan for 21st April 2025Nifty future and banknifty future analysis and intraday plan in kannada.
Quarterly results.
This video is for information/education purpose only. you are 100% responsible for any actions you take by reading/viewing this post.
please consult your financial advisor before taking any action.
----Vinaykumar hiremath, CMT

ABB India Ltd. (NSE: ABB) - Technical Analysis & Market OutlookABB India Ltd. (NSE: ABB) - Technical Analysis & Market Outlook
Overview:
ABB India Ltd. has demonstrated significant price action over the past few years, with a strong uptrend followed by a corrective phase. The current price action suggests a potential reversal from key support levels, presenting an opportunity for long-term investors and swing traders.
Key Observations:
Support Zone: The stock is currently testing a major support level around ₹5000 - ₹5200 , which aligns with a previous accumulation zone and historical resistance-turned-support.
200-Week Moving Average: Price action is hovering near the 200-week moving average, which has historically acted as a strong dynamic support.
RSI & Momentum: The Relative Strength Index (RSI) has moved into oversold territory and is now showing early signs of a potential reversal.
Volume Profile Analysis: The highest volume concentration is observed around the ₹6000-₹7000 range, indicating a major supply zone where price may retest if a reversal occurs.
Price Structure: The formation suggests a higher low structure , which is a positive sign for bullish continuation.
Potential Trade Setup:
Entry : Around the current levels of ₹5100-₹5200 with confirmation of bullish momentum.
Stop-Loss : Below ₹4800, as a break of this level may invalidate the bullish thesis.
Target 1 : ₹7000 (previous consolidation zone & high-volume area)
Target 2 : ₹9000 (previous swing high & psychological resistance)
Conclusion:
ABB India Ltd. is currently at a critical juncture, with strong confluence of technical factors supporting a potential upside move. Traders should monitor price action closely for confirmation before entering. If the support holds, the stock has a high probability of reversing towards higher levels.
Disclaimer: This analysis is for educational purposes only and should not be considered as financial advice. Conduct your own research before making any trading decisions.
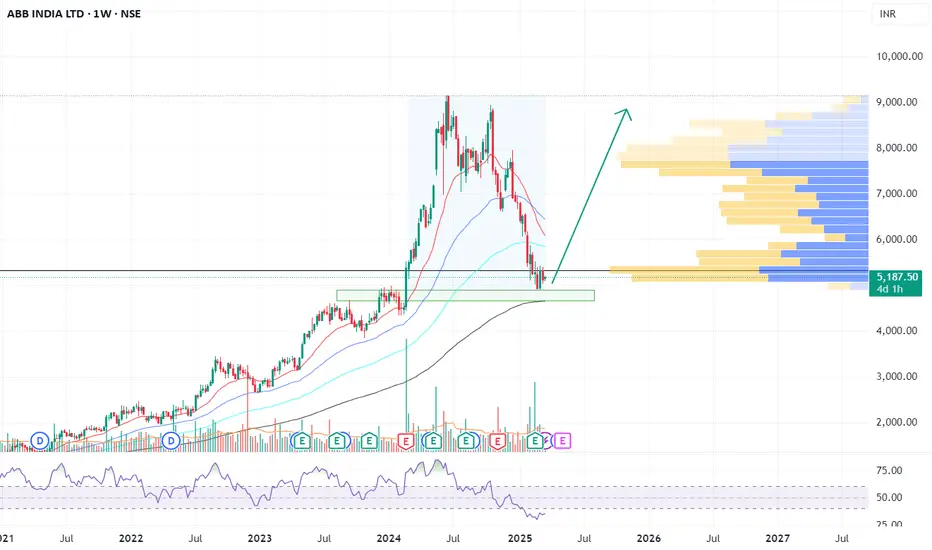
ABB - Short to mid-term analysis (NOT A BUY/SELL RECOMMEDATION)ABB is looking quite reasonable, and the chart indicates short-term bottom formation. Presently , a base for an upside would be 5112. If ABB crosses and sustains above 5112, then we can expect good upside upto 7116-7450+ . On the downside, risk is present if it breaches 4996. Upon breaching 4996, we can expect a downtrend up to the range of 4660-4045.

Review and plan for 19th February 2025 Nifty future and banknifty future analysis and intraday plan.
Result - action analysis.
This video is for information/education purpose only. you are 100% responsible for any actions you take by reading/viewing this post.
please consult your financial advisor before taking any action.
----Vinaykumar hiremath, CMT

ABB will have correction 30 - 35%?ABB has closed below 200 EMA on day time frame.
It has next demand support at 6600 & 6300.
Close below 6300 will confirm BAT pattern formation and this will lead to a correction up to 4400.
Target: 6600 / 6300 / 5500 / 5000 / 4400

ABB INDIA LTD S/R Support and Resistance Levels:
Support Levels: These are price points (green line/shade) where a downward trend may be halted due to a concentration of buying interest. Imagine them as a safety net where buyers step in, preventing further decline.
Resistance Levels: Conversely, resistance levels (red line/shade) are where upward trends might stall due to increased selling interest. They act like a ceiling where sellers come in to push prices down.
Breakouts:
Bullish Breakout: When the price moves above resistance, it often indicates strong buying interest and the potential for a continued uptrend. Traders may view this as a signal to buy or hold.
Bearish Breakout: When the price falls below support, it can signal strong selling interest and the potential for a continued downtrend. Traders might see this as a cue to sell or avoid buying.
MA Ribbon (EMA 20, EMA 50, EMA 100, EMA 200) :
Above EMA: If the stock price is above the EMA, it suggests a potential uptrend or bullish momentum.
Below EMA: If the stock price is below the EMA, it indicates a potential downtrend or bearish momentum.
Trendline: A trendline is a straight line drawn on a chart to represent the general direction of a data point set.
Uptrend Line: Drawn by connecting the lows in an upward trend. Indicates that the price is moving higher over time. Acts as a support level, where prices tend to bounce upward.
Downtrend Line: Drawn by connecting the highs in a downward trend. Indicates that the price is moving lower over time. It acts as a resistance level, where prices tend to drop.
Disclaimer:
I am not a SEBI registered. The information provided here is for learning purposes only and should not be interpreted as financial advice. Consider the broader market context and consult with a qualified financial advisor before making investment decisions.

ABB NSEABB has broken out of consolidation on Daily nad Weekly, Wait for Retest on DTF..and seek entry.

Review and plan for 5th November 2024 Nifty future and banknifty future analysis and intraday plan in kannada.
Resulst analysis.
This video is for information/education purpose only. you are 100% responsible for any actions you take by reading/viewing this post.
please consult your financial advisor before taking any action.
----Vinaykumar hiremath, CMT

ABB NSEABB after hitting a Peak of 9149 has corrected to @8000 levels, consolidating for @50days now it has broken out of the range, retested and moved upwards, Entry at current price with a 12%+ upside Estimated. Keep SL at 7350.

ABB Bullish BuyThe chart shows a strong upward trend in ABB India Ltd, with a recent consolidation forming a rising wedge pattern. This pattern typically indicates a potential breakout. The price is currently testing the upper boundary of the wedge, suggesting a possible bullish breakout if it surpasses the resistance level around 8,619.70 INR.
Key Levels:
Resistance: 8,972.10 INR
Support: 8,115.65 INR
Potential Trade Idea:
Bullish Scenario: A breakout above 8,619.70 INR could lead to a rally towards the next resistance at 8,972.10 INR.
Bearish Scenario: If the price fails to break out and falls below the wedge, watch for support at 8,115.65 INR.

ABB India Ltd - Potential Breakout Targeting ₹9,130This analysis focuses on ABB India Ltd , where the stock is exhibiting a potential breakout from its recent consolidation phase, suggesting an upward move toward ₹9,130, which is 9.39% higher from the current level. The chart includes Fibonacci retracement levels, key trendlines, and technical indicators.
Key Highlights:
Current Price : ₹8,510.30
Fibonacci Retracement:
61.8% retracement level around ₹8,835 has been broken, which is a bullish sign.
Price is expected to reach the 100% retracement level at ₹9,130.75, indicating further upside potential.
Trendline Breakout
: The stock has broken out of a descending triangle, confirming a breakout, which is supported by increasing volume and momentum.
Technical Indicators:
RSI: Shows a gradual rise, indicating growing bullish momentum.
Moving Averages: The stock is well above its 50-day and 200-day moving averages, reinforcing the bullish trend.
Key Levels to Watch:
Resistance: ₹9,130.75 (100% Fibonacci retracement).
Support : ₹8,084 (50% Fibonacci retracement).
Conclusion:
With the breakout above the descending triangle and the stock holding above key Fibonacci levels, ABB India Ltd appears set for an upside move toward ₹9,130 . Traders should watch for sustained volume and monitor support levels in case of pullbacks.

Abb looks good for buyAfter a pullback., consolodation and now ready for upmove
Buy above-8280.
Target-9000
Sl-780
