ABB - Breaking outABB.
Trying to push past the 999 high.
Getting ready for a 200 Rs move.
This stock when it moves it moves.
Else stagnant.
So have to watch this daily.
Market insights
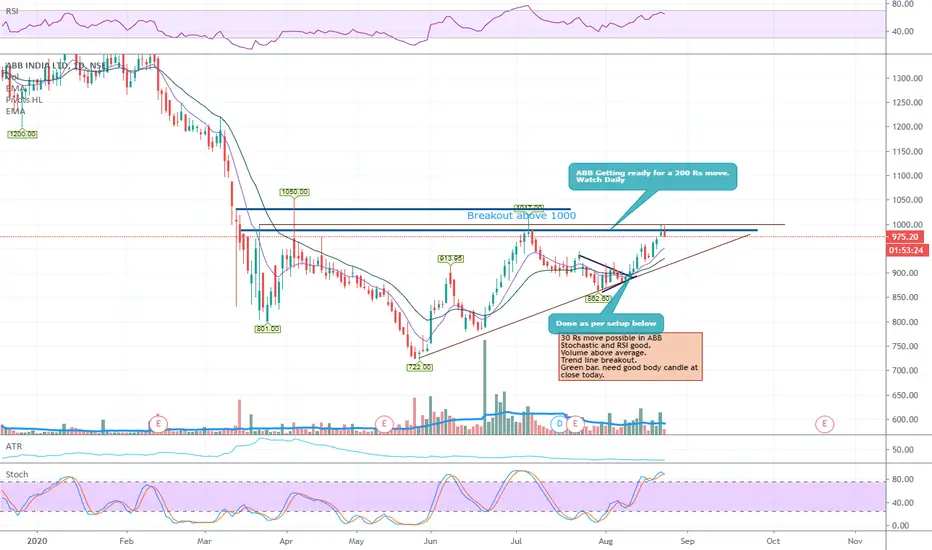

A simple setup, high probabilityABB has moved up impulsively, made a nice corrective structure in the form of a Flat (ABC). I think that the wave C of the Flat pattern is done and now it will head in the upside direction, as a continuation. A retest of the the previous highs is possible.
We are looking at close to 60-65% kind of price move in the current setup.
Low risk and good reward setup. If I were to trade this, my stop would be below the C, as in the charts.
** This is not a trade advice**


ABB from 16 July 2020A complete 1->2->3 wave pattern can be made on ABB ..
.use simple strategy to make money...
Trendline has been drawn once candle(Green candle) breaks the trendline --> following the MFI breakout
take trade
entry price === >> green candle ( high - low ) /2 + high
exit price ==>> 1R --> 2R as targets : R = risk --> nearest swing low
advance traders can also use ADX to maximise the profit


ABB INDIA - Long Trade- Price ActionPrice coming back to Daily Demand Zone of 1295 - 1321, which is also a past resistance still acting as a good support.
Buying Zone - 1295 to 1321, SL-1273
De-risk the trade at 1367
Target 1- 1450
Target 2 - 1550 +
Crossing and closing above 1370 is crucial for further upmove.


ABB India Ltd. - Technical Analysis - 8/29/2016For ABB India Ltd. stock, 1000 is solid support. We will be salivating to grab some at that level. Between 2009 and 2013, it spent most of the time between 500 points wide boundary of 400 - 900 and now if it wants to do the same between 1000 and 1500 then a pullback lower will be a good chance to trade it from buy side.
Buying the stock in a band of 800 - 1000 during the move lover puts probability in favour of solid profitability in future !
Meanwhile, our trade in Dabur has approached the take profit level. We are squaring the puts and closing the covered calls against the long term long positions.
