Trade ideas

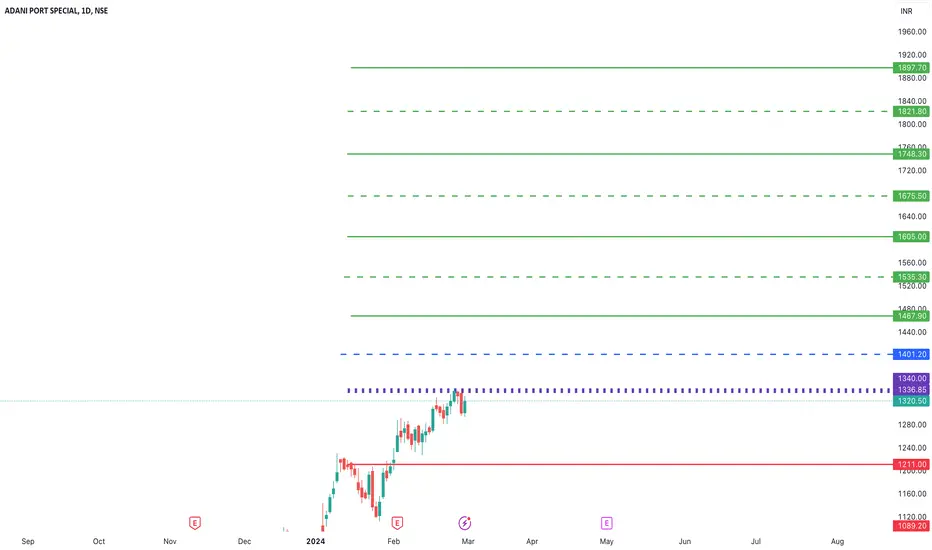
ADANIPORTS- AnalysisEarly entry if comes again around 1211 with Stoploss - 1089
Buy above 1340
Safe Entry above 1405 or 1470
Early entry ( Risky ) if comes again around 1211 - use small Stoploss
Stoploss - 1089
Expected major targets 1467 then 1605 then 1748 then 1821 to 1897
Please do your due diligence before trading or investment.
*Comment or message me if you wish to see my analysis for any stocks.
**Disclaimer -
I am not a SEBI registered analyst or advisor. I does not represent or endorse the accuracy or reliability of any information, conversation, or content. Stock trading is inherently risky and the users agree to assume complete and full responsibility for the outcomes of all trading decisions that they make, including but not limited to loss of capital. None of these communications should be construed as an offer to buy or sell securities, nor advice to do so. The users understands and acknowledges that there is a very high risk involved in trading securities. By using this information, the user agrees that use of this information is entirely at their own risk.
Thank you.
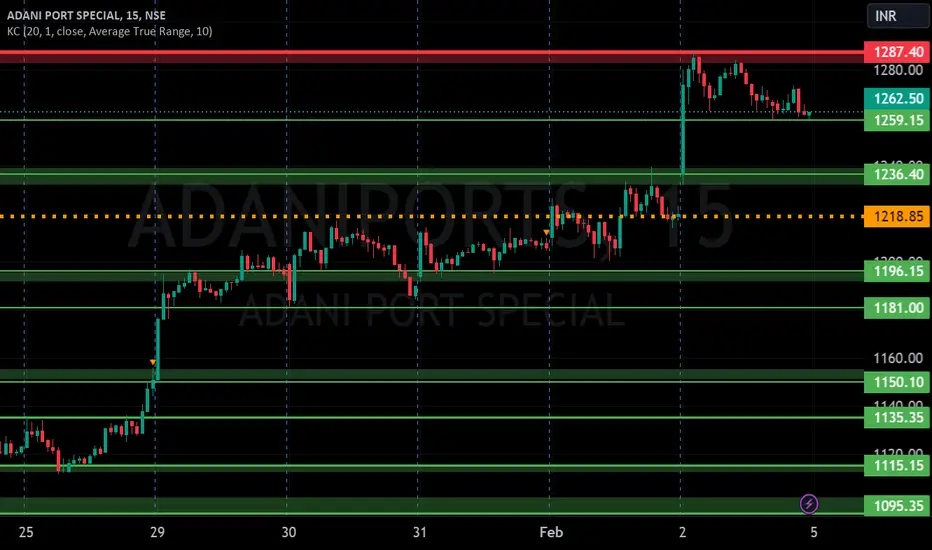
ADANI PORT S/R for 22/2/24Support and Resistance Levels:
Based on the price action, you have to identify two significant levels: the red line acting as resistance and the green line acting as support. Additionally, there have marked red and green shades to represent resistance and support zones, respectively.
Support: The green line and green shade represent support levels. These levels are where the price tends to find buying interest, preventing it from falling further. Traders can consider these levels as potential buying opportunities.
Resistance: The red line and red shade represent resistance levels. These levels are where the price tends to encounter selling pressure, preventing it from rising further. Traders can consider these levels as potential selling opportunities.
Breakouts: If the price breaks above the resistance zone (red shade) convincingly, it may indicate a bullish breakout, and the price could move higher to the next resistance level. On the other hand, if the price breaks below the support zone (green shade) convincingly, it may indicate a bearish breakout, and the price could move lower to the next support level.
Keltner Channel:
The Keltner Channel is a technical indicator that uses an exponential moving average (EMA) to create an upper and lower channel around the price action. Traders can use this channel to identify potential long and short positions.
Long Position: If the price is above the upper line of the Keltner Channel, it may indicate a potential long opportunity, as it suggests the price is trading above the average range and might continue in an upward trend.
Short Position: If the price is below the lower line of the Keltner Channel, it may indicate a potential short opportunity, as it suggests the price is trading below the average range and might continue in a downward trend.
Disclosure: I am not SEBI registered. I just wanted to let you know that the information provided here is for learning purposes only. Please consult your financial advisor before making any decisions. Tweets neither advice nor endorsement.

ADANIPORTS bulls takeover#ADANIPORTS Fresh bull flag breakout setup as we are seeing this bull flag breakout with potential targets of upto 1455$ calculated with the help of trendbased fibs.

ADANI PORTS S/R for 19/2/24Support and Resistance Levels:
Based on the price action, you have to identify two significant levels: the red line acting as resistance and the green line acting as support. Additionally, there have marked red and green shades to represent resistance and support zones, respectively.
Support: The green line and green shade represent support levels. These levels are where the price tends to find buying interest, preventing it from falling further. Traders can consider these levels as potential buying opportunities.
Resistance: The red line and red shade represent resistance levels. These levels are where the price tends to encounter selling pressure, preventing it from rising further. Traders can consider these levels as potential selling opportunities.
Breakouts: If the price breaks above the resistance zone (red shade) convincingly, it may indicate a bullish breakout, and the price could move higher to the next resistance level. On the other hand, if the price breaks below the support zone (green shade) convincingly, it may indicate a bearish breakout, and the price could move lower to the next support level.
Keltner Channel:
The Keltner Channel is a technical indicator that uses an exponential moving average (EMA) to create an upper and lower channel around the price action. Traders can use this channel to identify potential long and short positions.
Long Position: If the price is above the upper line of the Keltner Channel, it may indicate a potential long opportunity, as it suggests the price is trading above the average range and might continue in an upward trend.
Short Position: If the price is below the lower line of the Keltner Channel, it may indicate a potential short opportunity, as it suggests the price is trading below the average range and might continue in a downward trend.
Disclosure: I am not SEBI registered. I just wanted to let you know that the information provided here is for learning purposes only. Please consult your financial advisor before making any decisions. Tweets neither advice nor endorsement.

ADANI PORT S/R for 14/2/24Support and Resistance Levels:
Based on the price action, you have to identify two significant levels: the red line acting as resistance and the green line acting as support. Additionally, there have marked red and green shades to represent resistance and support zones, respectively.
Support: The green line and green shade represent support levels. These levels are where the price tends to find buying interest, preventing it from falling further. Traders can consider these levels as potential buying opportunities.
Resistance: The red line and red shade represent resistance levels. These levels are where the price tends to encounter selling pressure, preventing it from rising further. Traders can consider these levels as potential selling opportunities.
Breakouts: If the price breaks above the resistance zone (red shade) convincingly, it may indicate a bullish breakout, and the price could move higher to the next resistance level. On the other hand, if the price breaks below the support zone (green shade) convincingly, it may indicate a bearish breakout, and the price could move lower to the next support level.
Keltner Channel:
The Keltner Channel is a technical indicator that uses an exponential moving average (EMA) to create an upper and lower channel around the price action. Traders can use this channel to identify potential long and short positions.
Long Position: If the price is above the upper line of the Keltner Channel, it may indicate a potential long opportunity, as it suggests the price is trading above the average range and might continue in an upward trend.
Short Position: If the price is below the lower line of the Keltner Channel, it may indicate a potential short opportunity, as it suggests the price is trading below the average range and might continue in a downward trend.
Disclosure: I am not SEBI registered. I just wanted to let you know that the information provided here is for learning purposes only. Please consult your financial advisor before making any decisions. Tweets neither advice nor endorsement.

ADANI PORT SPECIAL S/R for 5/1/24Support and Resistance Levels:
Based on the price action, you have to identify two significant levels: the red line acting as resistance and the green line acting as support. Additionally, there have marked red and green shades to represent resistance and support zones, respectively.
Support: The green line and green shade represent support levels. These levels are where the price tends to find buying interest, preventing it from falling further. Traders can consider these levels as potential buying opportunities.
Resistance: The red line and red shade represent resistance levels. These levels are where the price tends to encounter selling pressure, preventing it from rising further. Traders can consider these levels as potential selling opportunities.
Breakouts: If the price breaks above the resistance zone (red shade) convincingly, it may indicate a bullish breakout, and the price could move higher to the next resistance level. On the other hand, if the price breaks below the support zone (green shade) convincingly, it may indicate a bearish breakout, and the price could move lower to the next support level.
Keltner Channel:
The Keltner Channel is a technical indicator that uses an exponential moving average (EMA) to create an upper and lower channel around the price action. Traders can use this channel to identify potential long and short positions.
Long Position: If the price is above the upper line of the Keltner Channel, it may indicate a potential long opportunity, as it suggests the price is trading above the average range and might continue in an upward trend.
Short Position: If the price is below the lower line of the Keltner Channel, it may indicate a potential short opportunity, as it suggests the price is trading below the average range and might continue in a downward trend.
Disclosure: I am not SEBI registered. I just wanted to let you know that the information provided here is for learning purposes only. Please consult your financial advisor before making any decisions. Tweets neither advice nor endorsement.

ADANI PORT SPECIAL S/R for 1/2/24Support and Resistance Levels:
Based on the price action, you have to identify two significant levels: the red line acting as resistance and the green line acting as support. Additionally, there have marked red and green shades to represent resistance and support zones, respectively.
Support: The green line and green shade represent support levels. These levels are where the price tends to find buying interest, preventing it from falling further. Traders can consider these levels as potential buying opportunities.
Resistance: The red line and red shade represent resistance levels. These levels are where the price tends to encounter selling pressure, preventing it from rising further. Traders can consider these levels as potential selling opportunities.
Breakouts: If the price breaks above the resistance zone (red shade) convincingly, it may indicate a bullish breakout, and the price could move higher to the next resistance level. On the other hand, if the price breaks below the support zone (green shade) convincingly, it may indicate a bearish breakout, and the price could move lower to the next support level.
Keltner Channel:
The Keltner Channel is a technical indicator that uses an exponential moving average (EMA) to create an upper and lower channel around the price action. Traders can use this channel to identify potential long and short positions.
Long Position: If the price is above the upper line of the Keltner Channel, it may indicate a potential long opportunity, as it suggests the price is trading above the average range and might continue in an upward trend.
Short Position: If the price is below the lower line of the Keltner Channel, it may indicate a potential short opportunity, as it suggests the price is trading below the average range and might continue in a downward trend.

ADANI PORT SPECIAL S/R 29/1/24Support and Resistance Levels:
Based on the price action, you have to identify two significant levels: the red line acting as resistance and the green line acting as support. Additionally, there have marked red and green shades to represent resistance and support zones, respectively.
Support: The green line and green shade represent support levels. These levels are where the price tends to find buying interest, preventing it from falling further. Traders can consider these levels as potential buying opportunities.
Resistance: The red line and red shade represent resistance levels. These levels are where the price tends to encounter selling pressure, preventing it from rising further. Traders can consider these levels as potential selling opportunities.
Breakouts: If the price breaks above the resistance zone (red shade) convincingly, it may indicate a bullish breakout, and the price could move higher to the next resistance level. On the other hand, if the price breaks below the support zone (green shade) convincingly, it may indicate a bearish breakout, and the price could move lower to the next support level.
Keltner Channel:
The Keltner Channel is a technical indicator that uses an exponential moving average (EMA) to create an upper and lower channel around the price action. Traders can use this channel to identify potential long and short positions.
Long Position: If the price is above the upper line of the Keltner Channel, it may indicate a potential long opportunity, as it suggests the price is trading above the average range and might continue in an upward trend.
Short Position: If the price is below the lower line of the Keltner Channel, it may indicate a potential short opportunity, as it suggests the price is trading below the average range and might continue in a downward trend.

ADANI PORTS LONG TERM VIEWAdani Ports is forming a Symmetrical Triangle on Daily Time Frame
Entry is above 761.30
Stop Loss is at 657.05
Target is 1215
(Please note that entry & stop loss is on candle closing basis)
This View is purely based on Technical Analysis and is for educational purposes only.

ADANI PORTAdani port recently crossed its all time high with green elephant candle which means strong hands are buying the stock. so stock looking very strong. see the price action of the stock start initial qty here if we get stock near its all time high price will add again it will be good for risk reward ratio.
SL 858 POSITIONAL BASIS

A Confluence of Cup & Fib - Adani Ports :)For any script - When a News, Fundamentals and Technicals meet - then there its bound to
The recent positive ruling from the Supreme Court on the side of Adani Group against Hindenburg Report has definitely boosted Investor morale on all counters of Adani
From a Fundamentals perspective Adani Ports is a Rock Solid script as it has global presence in Physical Real Estate of each port and is continually trying to scale up across the world.
From Technical point of view on Monthly Chart:
1) Price Broke out of Long Term Parallel Channel (since IPO)
2) Rounding Bottom / CUP pattern BO also done on Monthly
3) The Cup pattern bottom retracement was at Fib 0.786 level and hence the Cup Target 1390 is exactly meeting Fibonacci Extension Target of 1.272
Confluence of Cup & Fib - is a double confirmation of structure and now that Channel is also broken out positively, the additional Fib extn targets will also be met
Targets 1390, 1665, 2450
Disclaimer:
Stocks-n-Trends is NOT a SEBI registered company. We do not provide Buy / Sell recommendations - rather we provide detailed analysis of how to review a chart, explain multi--timeframe views purely for Educational Purposes. We strongly suggest our followers to "Learn to Ride the Tide" and consult your Financial Advisors before taking any positions.
If you like our detailed analysis, please do rate us with your Likes, Boost and share your comments
-Team Stocks-n-Trends

ADANIPORTSNSE:ADANIPORTS
One Can Enter Now !
Or Wait for Retest of the Trendline (BO) !
Or wait For better R:R ratio !
Note :
1.One Can Go long with a Strict SL below the Trendline or Swing Low.
2. R:R ratio should be 1 :2 minimum
3. Plan as per your RISK appetite and Money Management.
Disclaimer : You are responsible for your Profits and loss, Shared for Educational purpose

Adani Ports is looking bullishAdaniPorts is looking bullish. Can be bought near 1100-1110
Targets coming 1195
Stop loss can be below 1060
Trade at your own risk.

ADANI PORT LTD.Adani Port Ltd.
Soon Breakout Candidate
Tight Consolidation in Narrow Range at higher side
CMP 749
TGT 760, 770, 780+
SL 730

ADANI PORT S/R for 26/12/23Support and Resistance Levels:
Based on the price action, you have to identify two significant levels: the red line acting as resistance and the green line acting as support. Additionally, there have marked red and green shades to represent resistance and support zones, respectively.
Support: The green line and green shade represent support levels. These levels are where the price tends to find buying interest, preventing it from falling further. Traders can consider these levels as potential buying opportunities.
Resistance: The red line and red shade represent resistance levels. These levels are where the price tends to encounter selling pressure, preventing it from rising further. Traders can consider these levels as potential selling opportunities.
Breakouts: If the price breaks above the resistance zone (red shade) convincingly, it may indicate a bullish breakout, and the price could move higher to the next resistance level. On the other hand, if the price breaks below the support zone (green shade) convincingly, it may indicate a bearish breakout, and the price could move lower to the next support level.
Keltner Channel:
The Keltner Channel is a technical indicator that uses an exponential moving average (EMA) to create an upper and lower channel around the price action. Traders can use this channel to identify potential long and short positions.
Long Position: If the price is above the upper line of the Keltner Channel, it may indicate a potential long opportunity, as it suggests the price is trading above the average range and might continue in an upward trend.
Short Position: If the price is below the lower line of the Keltner Channel, it may indicate a potential short opportunity, as it suggests the price is trading below the average range and might continue in a downward trend.
Disclosure: I am not SEBI registered. I just wanted to let you know that the information provided here is for learning purposes only. Please consult your financial advisor before making any decisions. Tweets neither advice nor endorsement.

Simple Flag pattern price actionwe always work on better stock to give good return and with prefect SL.
this is the same stock where we took trade.

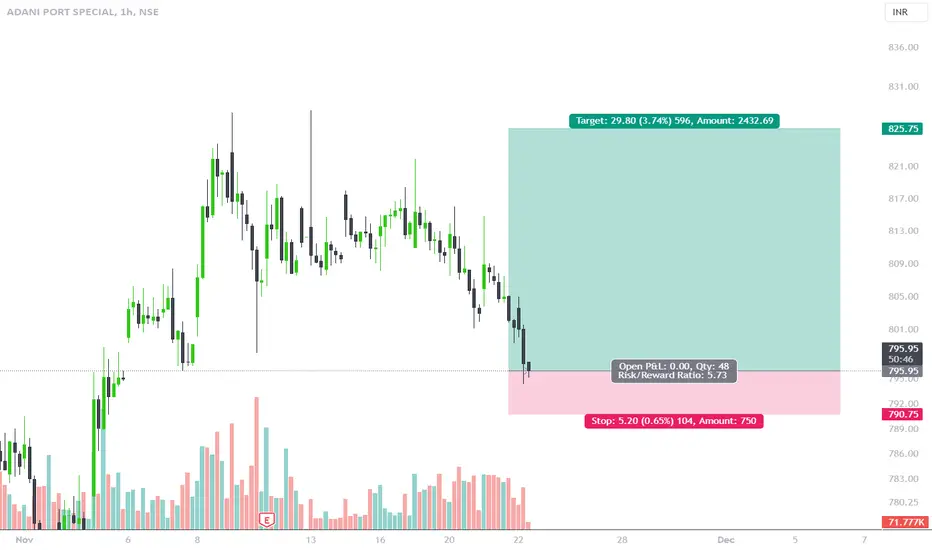
ADANI PORT - SWING TRADE📈 **Trade Alert: BUY ADANIPORTS** 🚀
Seizing a potential opportunity in ADANIPORTS, here are the key details for consideration:
**Current Market Price (CMP):** ₹796 📊
🎯 **Target Range:** ₹825 - ₹830 🚀
⛔ **Stop Loss:** ₹790 ⚠️
📉 **Risk/Reward (R/R) Ratio:** 1:5 📈
📊 **Trade Overview:**
Strategically entering ADANIPORTS with a target range of ₹825 - ₹830 and a defined stop loss at ₹790. The Risk/Reward ratio is set at 1:5, reflecting a calculated approach to potential gains and losses.
💹 **Potential Gain:** 3%
📉 **Potential Loss:** 0.65%
🚀 **Trade Optimism:**
This trade presents an opportunity for a favorable risk-reward balance, aligning with our strategic outlook.
🌐 **Risk Management:**
Adhere to the defined stop loss for prudent risk management.
Let's navigate the markets with precision and capitalize on potential gains in ADANIPORTS! 🌟💰
#ADANIPORTS #TradeAlert #RiskManagement #PotentialGains
Adani PortsHindenburg Retreats
Hope he squared up his shorts
The winner in all this saga was Adani Family & Rajiv Jain
At Rs 1100, there could be a strong resistance. Beyond that its in new sphere !
Jai HO

Chart of the week. Adani portsAll the Adani stocks has seen missive buying in last 2 weeks. Reason could be elections. Almost all the stocks have given breakout, however, I chose this stock due to few reasons.
1. This stock has underperformed in all the Adani stocks
2. Recently they got big money from USA for their business.
3. A very good consolidation for more than a year.
4. Trading above all time high. In blue sky.
5. PE is fairly low (around 34) rather than 80 or 100+ in few Adani stocks.
Hence, this would be a worth of a trade with very good RR. The volume candle also suggesting to go for a trade.
CMP - 1122 (10/12/23)
T - 1350, 1950
SL - 940

Adani Ports TargetsA nice bull run has been seen recently. This means many investors are investing so it would be wise not to close long term trades. This is a simple plan for long term holding in this stock. Good Luck. Invest only what you can lose. Dnt dream for overninght miracle.

ADANIPORTS bullish structure formationDouble bottom pattern seen near demand zone. Neckline of W- pattern broken and closed above neckline. RSI turning from oversold to neutral, good opportunity and good Risk rewards at current price.
