Long BullishP/E ~53 (higher but justified by 25% growth in data center leasing), trading at 11x sales (sector avg. 15x). Recent ₹2,000 Cr capex for 300 MW capacity positions it for 30% revenue jump; ROCE 11% signals efficiency. Target: ₹850 (18% upside).
Anant Raj Ltd.
No trades
Market insights

ANANT RAJAnant Raj Ltd. (currently trading at ₹699) is a Delhi-NCR-based real estate developer with a diversified portfolio across residential, commercial, industrial, and hospitality assets. Founded in 1969, the company owns over 1,000 acres of land bank in prime zones like Gurugram, Manesar, and South Delhi. It is known for its low-debt structure, high-margin plotted developments, and strategic monetization of legacy land parcels. The company is actively scaling residential townships, data center parks, and industrial clusters under the “Anant Raj Estates” brand.
Anant Raj – FY22–FY25 Snapshot
• Sales – ₹650 Cr → ₹820 Cr → ₹1,050 Cr → ₹1,250 Cr Growth driven by plotted sales, industrial leasing, and residential launches
• Net Profit – ₹120 Cr → ₹180 Cr → ₹240 Cr → ₹300 Cr Earnings supported by margin expansion and land monetization
• Operating Performance – Moderate → Strong → Strong → Strong EBITDA margins improving with asset-light plotted model
• Dividend Yield (%) – 0.00% → 0.00% → 0.00% → 0.00% No payouts; reinvestment-focused strategy
• Equity Capital – ₹59.00 Cr (constant) No dilution; lean capital structure
• Total Debt – ₹450 Cr → ₹400 Cr → ₹350 Cr → ₹300 Cr Gradual deleveraging supported by internal accruals
• Fixed Assets – ₹1,200 Cr → ₹1,280 Cr → ₹1,350 Cr → ₹1,420 Cr Capex focused on residential townships and data center infra
Institutional Interest & Ownership Trends
Promoter holding stands at 74.00%, with no pledging. FIIs and DIIs have actively accumulated citing land bank value and plotted margin visibility. Delivery volumes reflect long-term positioning by real estate, infra, and value-focused funds.
Business Growth Verdict
Anant Raj is scaling across plotted developments, industrial parks, and data center infra Margins improving due to asset-light model and legacy land monetization Debt is declining steadily with strong operating cash flows Capex supports long-term competitiveness and township scale-up
Management Con Call Highlights
• Q1 FY26 revenue rose 22.5% YoY to ₹310 Cr; PAT up 28.2% YoY to ₹78 Cr • 300-acre township in Manesar launched; 80% Phase I sold • Data center JV signed for Gurugram cluster; infra buildout underway • FY26 outlook: 18–20% revenue growth, margin retention, and PAT expected to cross ₹350 Cr
Final Investment Verdict
Anant Raj Ltd. offers a high-conviction real estate compounding story built on land bank monetization, plotted margins, and infra diversification. Its improving profitability, disciplined capital structure, and expanding township footprint make it suitable for accumulation by investors seeking exposure to India’s real estate and data infra themes.

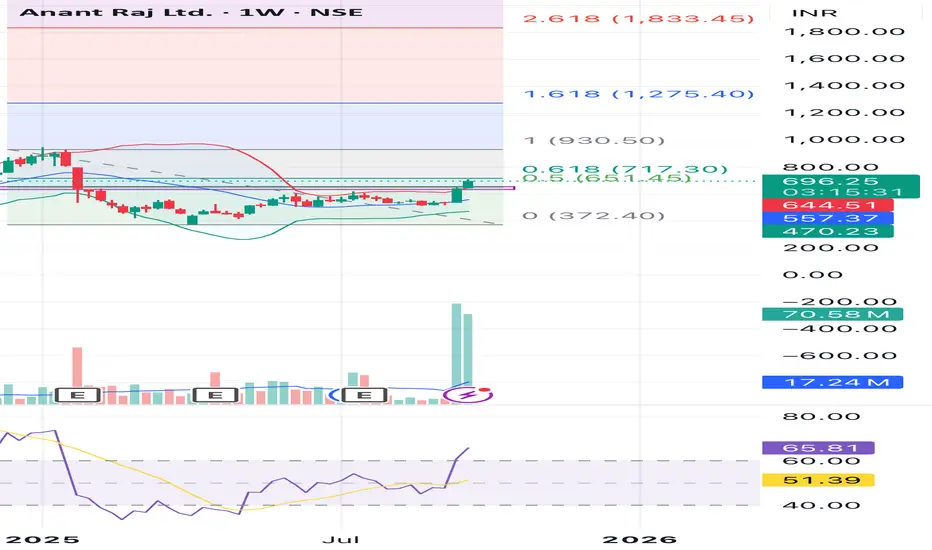
Anant Raj Ltd. (Weekly)✅ Buy above: ₹685 (sustained breakout with volume)
🎯 Target: ₹729 / ₹800
🛑 Stoploss: ₹645
⚡ Key Level: Near 0.618 Fibonacci retracement + volume buildup.

Buy idea in AnantrajStock has given breakout of the consolidation with good candle and volumes. The D,W,M is above 60 RSI, however the daily RSI is overstretched but the candle are consolidating in a zone. Weekly structure is bullish. Can do better above 720 level.
ANANTRAJAnantRaj a data center Gem: Watch above 620.. Ready to move 640, 650, 660 in few days.. RSI is shifting in upper direction.. Stock is moving with trendline..
ANANT RAJ – Breakout From Rounded Base | ₹700+ Swing PossibleANANT RAJ has triggered a fresh breakout above the ₹580 zone – reclaiming its prior breakdown level from Feb 2025. This comes after a rounded base formation lasting 4+ months.
Breakout 1: June 2, on volume, cleared the March–May base
Breakout 2: Now taking out neckline of broader inverse H&S
Volume: Expanding again
RSI: Bullish, no divergence
Structure: Clean higher highs and lows post-Feb low
Measured Move Target: ₹700
Stop-Loss: ₹558
Fundamentals Support Swing Bias:
Low debt, strong solvency
Net profit margin ~21%
FY26 profit growth estimate ~32%
Valuation expensive (P/E ~46), but growth supports it short term
Not a long-term compounding candidate yet – monitor execution
Positioning:
Swing trade, not an investment. Ride momentum. Trail stops. No averaging up. Exit if ₹558 breaks on closing basis.
Disclaimer:
This analysis is for educational purposes only. It is not investment advice. Do your own due diligence. Trade at your own risk.

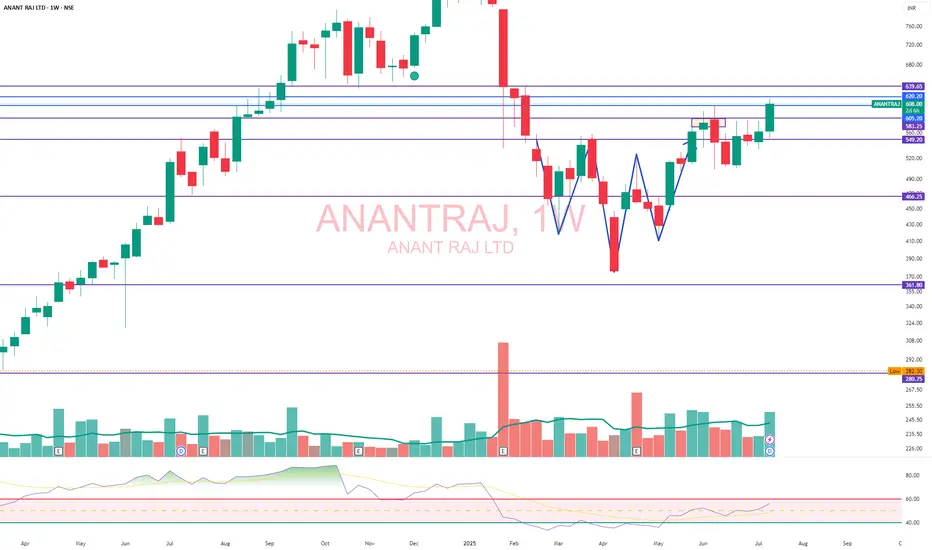
Amazing breakout on WEEKLY Timeframe - ANANTRAJCheckout an amazing breakout happened in the stock in Weekly timeframe, macroscopically seen in Daily timeframe. Having a great favor that the stock might be bullish expecting a staggering returns of minimum 25% TGT. IMPORTANT BREAKOUT LEVELS ARE ALWAYS RESPECTED!
NOTE for learners: Place the breakout levels as per the chart shared and track it yourself to get amazed!!
#No complicated chart patterns
#No big big indicators
#No Excel sheet or number magics
TRADE IDEA: WAIT FOR THE STOCK TO BREAKOUT IN WEEKLY TIMEFRAME ABOVE THIS LEVEL.
Checkout an amazing breakout happened in the stock in Weekly timeframe.
Breakouts happening in longer timeframe is way more powerful than the breakouts seen in Daily timeframe. You can blindly invest once the weekly candle closes above the breakout line and stay invested forever. Also these stocks breakouts are lifelong predictions, it means technically these breakouts happen giving more returns in the longer runs. Hence, even when the scrip makes a loss of 10% / 20% / 30% / 50%, the stock will regain and turn around. Once they again enter the same breakout level, they will flyyyyyyyyyyyy like a ROCKET if held in the portfolio in the longer run.
Time makes money, GREEDY & EGO will not make money.
Also, magically these breakouts tend to prove that the companies turn around and fundamentally becoming strong. Also the magic happens when more diversification is done in various sectors under various scripts with equal money invested in each N500 scripts.
The real deal is when to purchase and where to purchase the stock. That is where Breakout study comes into play.
LET'S PUMP IN SOME MONEY AND REVOLUTIONIZE THE NATION'S ECONOMY!

anant raj the government has proposed a tax exemption of up to 20 years for data centre developers, provided they meet capacity addition, power usage effectiveness and employment generation targets.
States would be urged to provide land near industrial corridors, IT hubs or manufacturing for data centre infra, according to the report, which adds that the permanent establishment status for foreign firms operating or leasing at least 100 MW Data centre capacity from Indian companies is also proposed.
CNBC-TV18 has not independently verified the veracity of these reports.
For the June quarter, Anant Raj operationalised a second data centre facility at Panchkula, with a capacity of 7 MW IT load. The company has a target of operationalising 307 MW Data Centre capacity by 2031.

ANANTRAJ | Risk-Takers Buy @LTP or Safer Entry Above 620ANANTRAJ | Risk-Takers Buy @LTP or Safer Entry Above 620 | SL below 570 | Target 800
Disclaimer:
This is not financial advice. Please do your own research or consult with a financial advisor before making any investment decisions. Investments in stocks can be risky and may result in loss of capital.

ANANTRAJ | Buy @LTP | SL below 560 | Target 790Disclaimer:
This is not financial advice. Please do your own research or consult with a financial advisor before making any investment decisions. Investments in stocks can be risky and may result in loss of capital.
time for data center stocks ?looks bullish sector rotation towards data center stocks lets see how it performs :D

ANANT RAJ Ltd 38% in 5 Days!!!ANANT RAJ Ltd Stock - Short Trade in 15m timeframe
The Risological Options Trading Indicator crossover to the bearish side happened on 23 Jan, 2024 at 11:30 am, where I entered the short trade (spot).
Wanted to close it today, however, the stock hit lower circuit.
Hopefully I will get a chance to exit tomorrow, wish me good luck!

ANANT RAJ CAN HIT 1000 MARK!Hey, back with an another weekend picks, i have pick Anant Raj this stock showing bullish momentum and it can gives you around 30 to 40% in couple of month add in your watchlist.

ANANT RAJAnant Raj is Still looks Good; in Down Sided Market
because based on my setup;
Fabulous Fundamentals Support
Near 52w High, and sustaining near High
Having Great Strength of Bulls 💪
Still Momentum is in Favor..

ANANT RAJ LTD S/R Support and Resistance Levels:
Support Levels: These are price points (green line/shade) where a downward trend may be halted due to a concentration of buying interest. Imagine them as a safety net where buyers step in, preventing further decline.
Resistance Levels: Conversely, resistance levels (red line/shade) are where upward trends might stall due to increased selling interest. They act like a ceiling where sellers come in to push prices down.
Breakouts:
Bullish Breakout: When the price moves above resistance, it often indicates strong buying interest and the potential for a continued uptrend. Traders may view this as a signal to buy or hold.
Bearish Breakout: When the price falls below support, it can signal strong selling interest and the potential for a continued downtrend. Traders might see this as a cue to sell or avoid buying.
MA Ribbon (EMA 20, EMA 50, EMA 100, EMA 200) :
Above EMA: If the stock price is above the EMA, it suggests a potential uptrend or bullish momentum.
Below EMA: If the stock price is below the EMA, it indicates a potential downtrend or bearish momentum.
Trendline: A trendline is a straight line drawn on a chart to represent the general direction of a data point set.
Uptrend Line: Drawn by connecting the lows in an upward trend. Indicates that the price is moving higher over time. Acts as a support level, where prices tend to bounce upward.
Downtrend Line: Drawn by connecting the highs in a downward trend. Indicates that the price is moving lower over time. It acts as a resistance level, where prices tend to drop.
Disclaimer:
I am not a SEBI registered. The information provided here is for learning purposes only and should not be interpreted as financial advice. Consider the broader market context and consult with a qualified financial advisor before making investment decisions.

Anantrajwait and enter.
Breakout from the range. volume levels are not very high.
wait for next day high .
(or)
wait for retest.
only education purpose only.


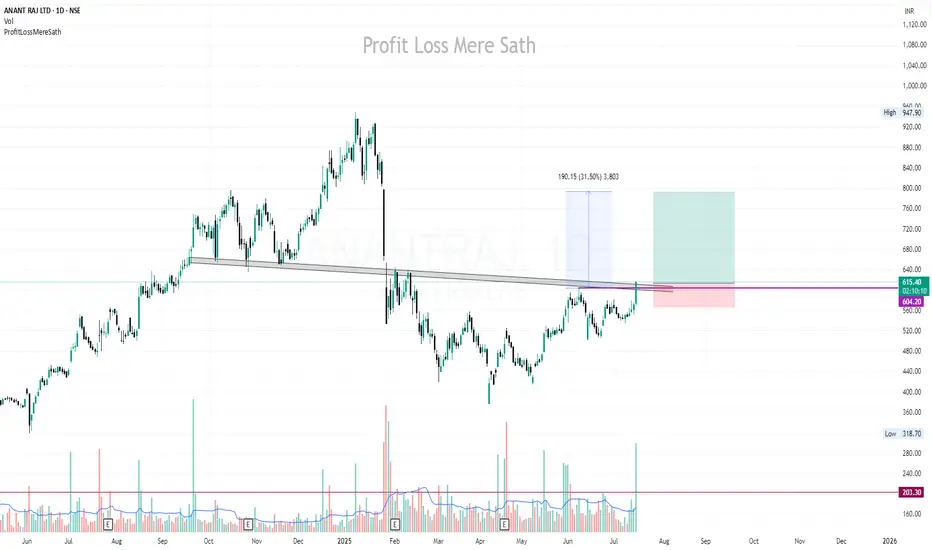
Anant Raj - Long Setup (Swing Trade)Anant Raj is approaching a critical zone for a potential long trade setup. Here’s the plan:
Entry Zone: 686.30
Entry Price: Once a 15-minute candle breaks above 686.30 , the high of that candle will confirm the entry.
Target: 788.7
Stop Loss: 635.10 (Triggered if a daily candle closes below this level)
The price is testing the entry zone around 686.30 , and a confirmed breakout could lead to a potential move towards the target of 788.7 . The stop loss is well-defined at 635.10 , providing a good risk-reward ratio for this trade.
Disclaimer: This post is for educational purposes only and is not financial advice. Always manage your risk and trade responsibly.

ANANTRAJ S/R Support and Resistance Levels:
Support Levels: These are price points (green line/shade) where a downward trend may be halted due to a concentration of buying interest. Imagine them as a safety net where buyers step in, preventing further decline.
Resistance Levels: Conversely, resistance levels (red line/shade) are where upward trends might stall due to increased selling interest. They act like a ceiling where sellers come in to push prices down.
Breakouts:
Bullish Breakout: When the price moves above resistance, it often indicates strong buying interest and the potential for a continued uptrend. Traders may view this as a signal to buy or hold.
Bearish Breakout: When the price falls below support, it can signal strong selling interest and the potential for a continued downtrend. Traders might see this as a cue to sell or avoid buying.
20 EMA (Exponential Moving Average):
Above 20 EMA(50 EMA): If the stock price is above the 20 EMA, it suggests a potential uptrend or bullish momentum.
Below 20 EMA: If the stock price is below the 20 EMA, it indicates a potential downtrend or bearish momentum.
Trendline: A trendline is a straight line drawn on a chart to represent the general direction of a data point set.
Uptrend Line: Drawn by connecting the lows in an upward trend. Indicates that the price is moving higher over time. Acts as a support level, where prices tend to bounce upward.
Downtrend Line: Drawn by connecting the highs in a downward trend. Indicates that the price is moving lower over time. It acts as a resistance level, where prices tend to drop.
RSI: RSI readings greater than the 70 level are overbought territory, and RSI readings lower than the 30 level are considered oversold territory.
Combining RSI with Support and Resistance:
Support Level: This is a price level where a stock tends to find buying interest, preventing it from falling further. If RSI is showing an oversold condition (below 30) and the price is near or at a strong support level, it could be a good buy signal.
Resistance Level: This is a price level where a stock tends to find selling interest, preventing it from rising further. If RSI is showing an overbought condition (above 70) and the price is near or at a strong resistance level, it could be a signal to sell or short the asset.
Disclaimer:
I am not a SEBI registered. The information provided here is for learning purposes only and should not be interpreted as financial advice. Consider the broader market context and consult with a qualified financial advisor before making investment decisions.


ANANTRAJ - Long Term Accumulation - Education PurposeThis analysis focuses on the long-term accumulation strategy for ANANTRAJ, highlighting key support levels that are crucial for making informed trading decisions. This strategy is designed for educational purposes and aims to help traders understand the significance of support levels in the context of long-term investments.
Risk Management: Establishing support levels aids in managing risk by setting predefined points where buying decisions are made, thereby limiting potential losses.
This analysis is intended to provide educational value and should not be construed as financial advice. Always conduct your own research and consult with a financial advisor before making investment decisions.


Anant Raj Ltd.*Anant Raj Ltd*
P&F; Formation on Yearly Basis.
Price BreakOut >380 Needed & Sustained.
Then Good to Go!!!
Strong Vol. Consolidation Done.
EMAs: Widening Gaps amongst 20/ 50/ 100/ 200 levels at Month TFs.
*RSI: 1H
