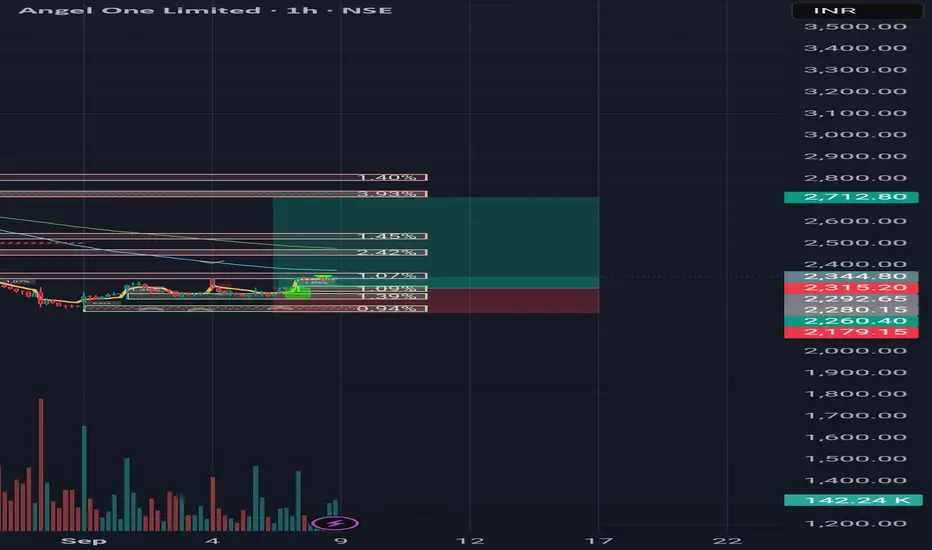
ANGELONE | Short @LTP | SL above 2500|Targets 2350, 2130, 2050Disclaimer (Please Read Carefully):
This is not investment advice. The stocks shared here are purely for educational and informational purposes. Please do your own research or consult with a financial advisor before making any investment decisions.
******************************************************************************************************************
Stock market में सिर्फ risk ही risk होता है। Market में survive करने का एक ही तरीका है, stop loss को पूरी discipline के साथ accept करना। अपनी capital को protect करने का इससे बेहतर कोई तरीका नहीं है।
मैं जो भी stock यहाँ शेयर करता हूँ, वो या तो मेरी existing holding में होता है, या फिर मैं उसी level पर fresh buying या add on करता हूँ जिसे मैं mention करता हूँ।
मैं हमेशा buy करते समय अपने system में stop loss ज़रूर लगा देता हूँ, और मेरे लिए stop loss, target से भी ज़्यादा important होता है।
Target achieve होने के बाद मैं पहले profit book करता हूँ और फिर retest या fresh breakout का इंतज़ार करता हूँ।
मैं सिर्फ breakouts पर buy करता हूँ, कभी भी support पर नहीं। और मैं resistance पर sell भी नहीं करता।
******************************************************************************************************************
The stock market involves risk, risk, and only risk. To survive in the market, accepting stop-loss with discipline and without hesitation. There is no other way to protect you capital.
Any stock I share is either already part of my existing holding or I take a fresh entry at the same level I mention. I always place the stop-loss in my system at the time of buying, and I give the highest importance to stop-loss more than the target. Once the target is achieved, I usually book profit once and then wait for either a retest or a fresh breakout.
I buy only on breakouts, never on supports. I also do not sell at resistance levels.
That is simply my trading style.
Market insights

ANGEL ONEAngel One Ltd., incorporated in the year 1996, is a Small Cap company (having a market cap of Rs 24,942.62 Crore) operating in Financial Services sector.
Angel One Ltd. key Products/Revenue Segments include Fees & Commission Income, Interest and Income From Sale Of Share & Securities for the year ending 31-Mar-2024.
For the quarter ended 30-09-2025, the company has reported a Consolidated Total Income of Rs 1,204.20 Crore, up 5.35 % from last quarter Total Income of Rs 1,143.09 Crore and down 20.57 % from last year same quarter Total Income of Rs 1,515.96 Crore. Company has reported net profit after tax of Rs 211.73 Crore in latest quarter.
The company’s top management includes Mr.Dinesh Thakkar, Mr.Ambarish Kenghe, Mr.Amit Majumdar, Mr.Ketan Shah, Mr.Krishna Iyer, Mr.Arunkumar Nerur Thiagarajan, Mr.Kalyan Prasath, Mr.Krishnaswamy Arabadi Sridhar, Ms.Mala Todarwal, Mr.Muralidharan Ramachandran, Mr.Vineet Agrawal, Mr.Naheed Patel, Mr.Manmohan Singh. Company has S R Batliboi & Co. LLP as its auditors. As on 30-09-2025, the company has a total of 9.07 Crore shares outstanding.

REVERSAL TRADE SET UP ANGEL ONEIf 25489 Breaks Can See 2470 AND 2455, TRADING REVERSAL With SL AS 2495 In 1 Hour Candle Closing.
Disclaimer
I am not a SEBI-registered analyst or advisor.
The content shared is purely for educational and informational purposes only.
should not be considered as investment or trading advice.
Trading and investing in financial markets involve risk.
Profits and losses are part of the process. You are solely responsible for any decisions you make,
and it is important to assess your risk tolerance and do your own due diligence before making,
any trades or investments.
Be safe with your capital. Stay disciplined. Stay invested.

ANGLE ONE, start of new teji cycl. Elliot Wave studyWave Structure Breakdown
Impulse Phase (Wave 1 to 5)
Wave 1: Initial breakout from base zone, often driven by early accumulation or fundamental trigger.
Wave 2: Shallow pullback, typically retracing 38–50% of Wave 1, confirming support.
Wave 3: Strongest rally, marked by volume expansion and institutional participation.
Wave 4: Sideways or mild correction, often forming a triangle or flag.
Wave 5: Final push, often driven by retail euphoria or news-based momentum.
Verdict: The completion of Wave 5 signals exhaustion and prepares the chart for a corrective phase.
🔻 Corrective Phase (a-b-c)
Wave a: Sharp decline—first leg of correction, often triggered by profit booking or macro headwinds.
Wave b: Temporary bounce, usually weak and low-volume.
Wave c: Final leg down, forming a descending triangle in this case, indicating consolidation and seller fatigue.
Verdict: The descending triangle acts as a base-building structure, setting up for a breakout.
Breakout & New Cycle Initiation
The chart shows a clear breakout above the triangle resistance, labeled “Start of New Cycle.”
This breakout is supported by volume and structure reset, indicating the beginning of a fresh impulsive wave—potentially Wave 1 of the next cycle.
Verdict: Long-term bullish setup confirmed. Ideal for accumulation and strategic positioning.

Angel One Ltd – Breakout from Base with Strong VolumeAngel One Ltd – Breakout from Base with Strong Volume
#ANGELONE
📈 Pattern & Setup:
Angel One is showing a fresh breakout from a solid base formation after multiple weeks of sideways consolidation. The stock has surged above the 2350–2380 zone backed by heavy volume, suggesting strong institutional buying interest.
This move also coincides with a broader positive shift in the market environment, adding conviction to the breakout. If it sustains above 2380, the next leg toward 2700–2850 could unfold swiftly.
📝 Trade Plan:
✍Entry: Above 2390 (breakout confirmation)
🚩Stop-Loss: 2250 (below recent swing low)
🎯Targets:
Target 1 → 2725
Target 2 → 2840 (20% potential move)
💡 Pyramiding Strategy:
1. Enter with 60% position above 2390
2. Add remaining 40% after it sustains above 2450 with volume
3. Trail stop-loss to 2320 once price crosses 2620
🧠 Logic Behind Selecting this Trade:
The breakout candle shows a clean transition from accumulation to markup phase, with a noticeable expansion in both range and volume. The previous base acted as a demand zone, and now that it’s cleared with conviction, the setup hints at a strong directional move in the coming sessions.
Keep Learning. Keep Earning.
Let’s grow together 📚🎯
🔴Disclaimer:
This analysis is for educational purposes only. Not a buy/sell recommendation. Please do your own research or consult your financial advisor before trading.

Angel One has a buying range between 2252 and 2400,Angel One has a buying range between 2252 and 2400, with a target of 3400.
This looks like a good buying opportunity from this range

Technical View (Weekly Chart)🔎 Technical View (Weekly Chart)
Price: ₹2,216
Trend: Stock has been consolidating after topping near ₹3,800.
Support Zone: ₹2,000–2,100 → very crucial, multiple re-tests. If broken, risk of deeper fall towards ₹1,250 (next demand).
Resistance: ₹2,750–2,850 (supply zone). Stronger resistance ₹3,250–3,500.
Momentum: RSI near 39, slipping below 40 → bearish bias in short term.
⚠️ Risk: If ₹2,000 fails, long-term structure weakens.
📉 Why News Flow is Hurting
Recent months have seen SEBI tightening rules around F&O margins, leverage, algo-trading restrictions, and investor protection norms → directly impacting retail activity (key revenue driver for Angel).
Competition heating up: Zerodha, Groww, Upstox taking away active clients.
Any regulatory clampdown on brokerage commissions, intraday leverage, or client funding → weighs on valuations.
📊 Fundamentals (Long Term)
Positives:
Strong retail franchise, ~15M+ client base.
Tech-driven + growing wealth management arm.
Consistently high RoE (~40%+) and RoA.
Healthy dividend payout (cash-generative business).
Challenges:
Over-dependence on trading volumes (cyclical).
Market-share erosion vs peers.
Regulatory overhang may cap valuations.
📝 Long-Term View
Buy Zone for Investors: Accumulate gradually around ₹2,000–2,100. Add more only if market structure holds.
Caution: Avoid heavy exposure below ₹2,000 (risk of slide to ₹1,250).
Upside Potential: If regulatory headwinds stabilise and retail flows revive, stock can revisit ₹3,200–3,500 in 2–3 years.
Investment Style: SIP-based staggered entry is safer than lump-sum.
✅ Summary: Angel One is a structurally strong but cyclically challenged stock. Good long-term pick near ₹2,000 support, but regulatory risk keeps it volatile. Safer to accumulate in tranches for 3–5 year horizon.

"ANGELONE" looks further correctionANGELONE is forming a Descending Triangle chart pattern.
Still, we can see a further 20% downside.
Strong Support Level : 2000

ANGELONE SHORT_Rejection @ 200 DEMAANGELONE SHORT
- Price rejected from 20 DEMA
- Bearish Engulfing Pattern
- Short when price is favourable
- SL close above 200 dema

Cup and Handle Formation in Angelone ChartDisclaimer : Do your own research before investing. This is just a chart analysis for education purpose only. No recommendation to buy and sell.
In Dec 2024, AngelOne made high of Rs.3500 and pull back to level of Rs.1941 in March 2025.
After touching level of Rs. 3288 , its now trading at Rs. 2805.
I can see a cup and handle chart pattern formation in this stock. to me , it will be bullish in near to long term.
I have mentioned my targets along with stop loss.

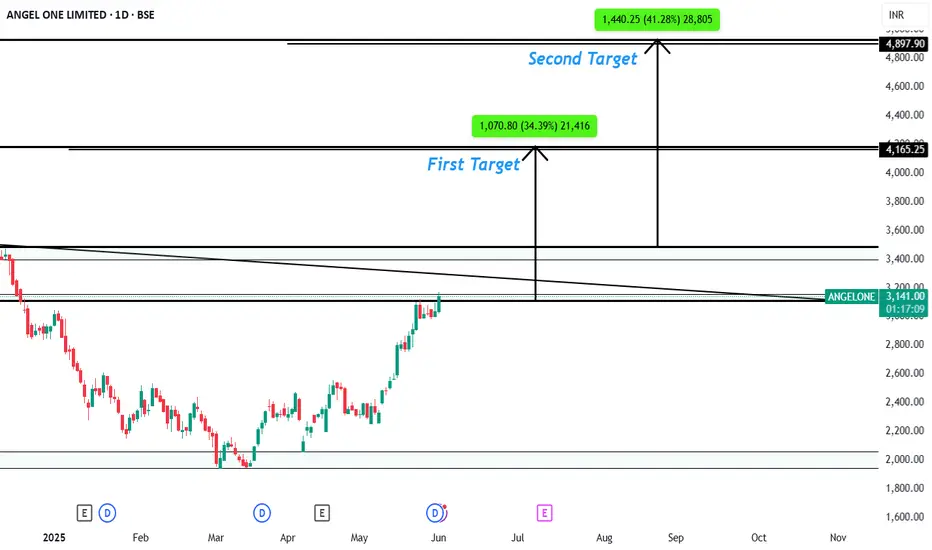
ANGELONE Breakout Trade Setup – Weekly Chart TargetsAngel One Ltd (BSE: ANGELONE) – Breakout Setup with Bullish Price Targets
The stock has broken out of a long-term descending trendline resistance on the weekly chart, signaling a potential trend reversal. The breakout is supported by strong bullish momentum and volume, indicating growing buyer interest.
💡 Technical Highlights:
Clear breakout from descending trendline.
Strong weekly candle with over 13% gain, confirming bullish sentiment.
Price has surpassed key horizontal resistance near ₹3,150–₹3,200 zone.
🎯 Targets:
First Target: ₹4,165.25 (Upside of ~34.39%)
Second Target: ₹4,897.90 (Upside of ~41.28%)
This setup offers a strong risk-reward opportunity for swing traders and position traders, provided the breakout sustains. Keep an eye on retest levels around ₹3,150 for potential entries.
📅 Chart Timeframe: Weekly
📈 Trend: Bullish
🔎 Watch Levels: ₹3,150 (support), ₹4,165 / ₹4,897 (resistance/targets)
ANGEL ONE - Potential Cup Pattern Breakout!Timeframe: Daily (1D)
Pattern: Cup Formation (shown with arc)
Setup:
Price is forming a classic cup pattern.
The neckline (arc resistance) is near 2538.40.
Price has recently approached but faced resistance around the neckline.
Once the price breaks above the arc line with strong volume, a bullish breakout could be confirmed!
Targets After Breakout:
🎯 Target 1: 2800
🎯 Target 2: 3000
Stop-loss suggestion: As per your risk management.
Notes:
Price is currently below the 200 EMA. For a strong confirmation, look for a close above the arc and the 200 EMA with volume spike.
Disclaimer
This analysis is for educational and informational purposes only. It does not constitute financial advice or a recommendation to buy or sell any securities. Always do your own research and consult with a qualified financial advisor before making any investment decisions. Trading involves substantial risk.

Angel One: Watch for Breakout or Pullback!Current Price: ₹2866
Resistance: ₹3000 🔼
Support: ₹2578 🔽
📊 Technical Snapshot:
Angel One is hovering near the crucial ₹2866 level. With resistance at ₹3000, a break above could signal a strong bullish breakout. On the flip side, if rejected, we may revisit the ₹2578 support zone for a possible bounce.
📌 Trade Ideas:
Bullish: Entry above ₹2900 with a target of ₹3000–₹3050. SL: ₹2840
Bearish: Short near ₹2990 with tight SL above ₹3010. Target: ₹2750–₹2600
🔍 What to Watch:
Volume near ₹3000
Price action around ₹2578 if correction sets in
RSI/Daily trend for momentum confirmation
💬 Your View? Are you bullish or bearish on Angel One this week?
#AngelOne #TradingView #StockAnalysis #AngelOneShare #TechnicalAnalysis #NSEStocks #BreakoutAlert #SupportAndResistance #SwingTrade #DayTradingIdeas

AngelOne Stock price breakoutAngelOne Stock price breakout, grate upside seen on chart & Option 2700CE

Angel one A bullish move can be expected if the symmetrical triangle pattern is broken.
If you find this helpful and want more FREE forecasts in TradingView, Hit the 'BOOST' button
Drop some feedback in the comments below! (e.g., What did you find most useful? How can we improve?)
Your support is appreciated!
Now, it's your turn!
Be sure to leave a comment; let us know how you see this opportunity and forecast.
Have a successful week
DISCLAIMER: I am NOT a SEBI registered advisor or a financial adviser. All the views are for educational purpose only

ANGELONE|Buy if Close above 2490|SL below 2340| Target 2950,3500Disclaimer:
This is not financial advice. Please do your own research or consult with a financial advisor before making any investment decisions. Investments in stocks can be risky and may result in loss of capital.

Angelone to move upside NSE:NIFTY NSE:ANGELONE
Angel one suffered a tons of downside movement from past 3 months and reached low levels of 2000 , currently stock is showing strength and trying to form base from bottom to move upside , one can build a positional trade for 3-6 months for a massive returns of 40-70% .

SWING IDEA - ANGELONE
ANGELONE
's stock price has been retesting around the 2000 resistance level for approximately two and half years. Following multiple retest, the stock finally broke out above this level in October 2023 and has since established it as a key support.
The stock subsequently surged to a peak of 3895, representing a 87% increase. However, it then experienced a sharp correction, plummeting 45% to revisit the 2000 support level again. This pivotal point, formerly a resistance, has now become a robust support.
Currently, ANGELONE is exhibiting an upward momentum, poised to retest its swing high at 3895. The weekly MACD crossover, occurring after the establishment of support at 2000, indicates a bullish trend reversal.
KEY OBSERVATIONS:
- Two-year resistance level of 2000 broken in October 2023
- Stock surged 87% to 3895 before correcting 45%
- 2000 level now serves as robust support
- Weekly MACD crossover indicates bullish momentum
- Upward momentum poised to retest swing high at 3895
RECOMMENDATION:
Based on this technical analysis, I would recommend holding ANGELONE for a Long Term horizon. This could potentially yield:
- 35% returns from the current price (as of writing)
- 87% returns from the support point (2000)
This analysis highlights a compelling buying opportunity in ANGELONE, driven by its breakout and momentum reversal.
IMPORTANT NOTE: Investors should be aware that there is a possibility that the stock may revisit this Support level at 2000 in the near future before resuming its upward momentum towards the swing high at 3895. This potential pullback should be monitored closely, and investors may consider adjusting their strategies accordingly.
DISCLAIMER: This IDEA is for informational/educational purposes only and should not be considered as investment advice. The analysis presented is based on technical indicators and historical data but does not guarantee future performance. Please conduct thorough research based on financial goals and risk tolerance, and consult with a financial advisor before making any investment decisions.

Keep eye on Angel One (Educational purpose only)Keep eye on angel one
Strictly buy above 2600
SL 2400
Target 3500

Angelone Long trade SetupHello,
Trend-Based Analysis. Buy the Dips, Sell The Rallies, Also Following the Trend. Let's see where the Price Action takes us, Riding the wave. Potential trade setups based on trend momentum.
Technical analysis based on trend identification and momentum, Looking for high-probability setups within the prevailing trend.
Analyzing the current market trend and potential future price movement. Focusing on risk management and reward-to-risk ratios.
Details is Mentioned in Chart, Read carefully.. .

Angel one 05.01.2024Angel one looks in bearish trend, if break 2800, short position will initiate, Target 2600,2400 in 1 month

[Positional] Angel One Swing BetNote -
One of the best forms of Price Action is to not try to predict at all. Instead of that, ACT on the price. So, this chart tells at "where" to act in "what direction. Unless it triggers, like, let's say the candle doesn't break the level which says "Buy if it breaks", You should not buy at all.
=======
I use shorthands for my trades.
"Positional" - means You can carry these positions and I do not see sharp volatility ahead. (I tally upcoming events and many small kinds of stuff to my own tiny capacity.)
"Intraday" -means You must close this position at any cost by the end of the day.
"Theta" , "Bounce" , "3BB" or "Entropy" - My own systems.
=======
I won't personally follow any rules. If I "think" (It is never gut feel. It is always some reason.) the trade is wrong, I may take reverse trade. I may carry forward an intraday position. What is meant here - You shouldn't follow me because I may miss updating. You should follow the system I share.
=======
Like -
Always follow a stop loss.
In the case of Intraday trades, it is mostly the "Day's High".
In the case of Positional trades, it is mostly the previous swings.
I do not use Stop Loss most of the time. But I manage my risk with options as I do most of the trades using derivatives
