Apollo HospitalsSafe insights, with levels showing clear trends. Think and decide at your own will to follow for entries and exits.
Market insights

AI TRENDSPOT - APOLLO HOSPITALAPOLLO HOSPITAL , Trend reversal with good volumes, RSI turning bullish, keep stock on Radar !!

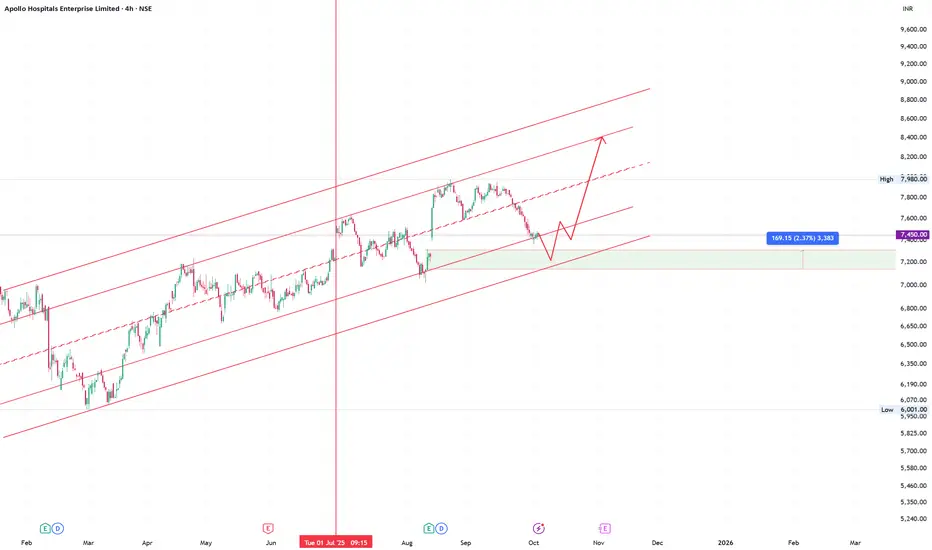
ApolloHospital Probable price pojectionPrice is travelling between two parallel channels
1. if price takes support at the buying zone and parallel channel then price moves up.
2. else price may go sideways or may break the channel and continue to move downwards.
Review(detailed) and plan for 25th August 2025Nifty future and banknifty future analysis and intraday plan.
This video is for information/education purpose only. you are 100% responsible for any actions you take by reading/viewing this post.
please consult your financial advisor before taking any action.
----Vinaykumar hiremath, CMT

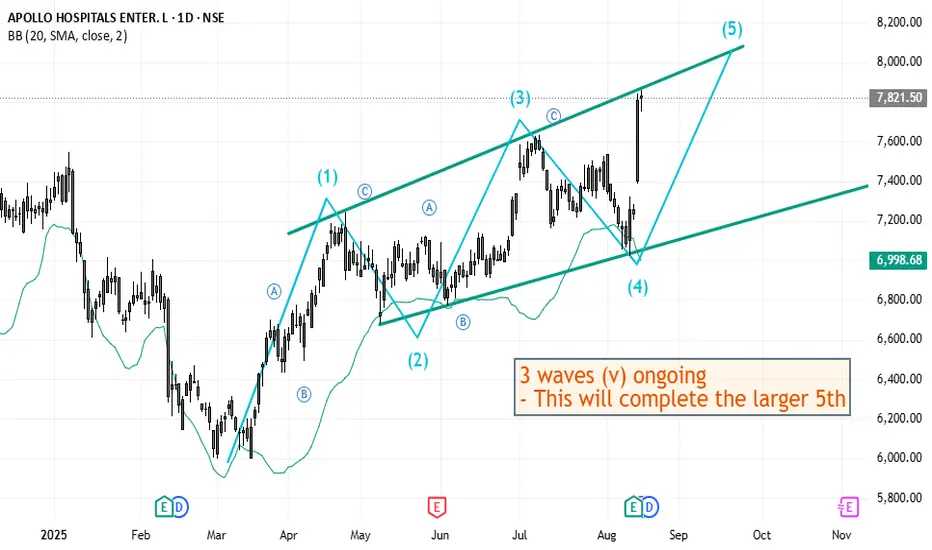
Elliott Wave Analysis of Apollo Hospitals APOLLOHOSPApollo Hospitals has been doing a diagonal and is currently in the (v) wave of the diagonal 5th. After this short term long, it appears to be followed by a bigger retracement.
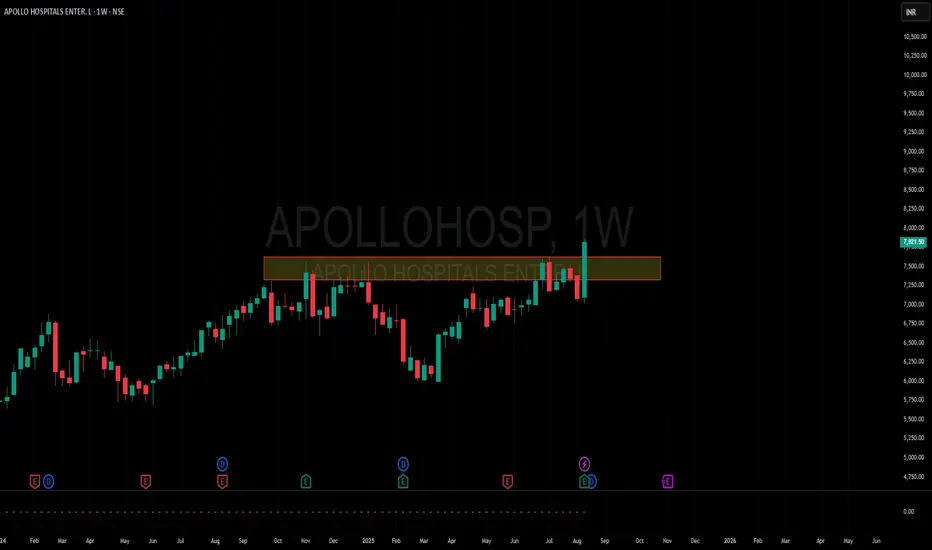
Amazing breakout on WEEKLY Timeframe - APOLLOHOSPCheckout an amazing breakout happened in the stock in Weekly timeframe, macroscopically seen in Daily timeframe. Having a great favor that the stock might be bullish expecting a staggering returns of minimum 25% TGT. IMPORTANT BREAKOUT LEVELS ARE ALWAYS RESPECTED!
NOTE for learners: Place the breakout levels as per the chart shared and track it yourself to get amazed!!
#No complicated chart patterns
#No big big indicators
#No Excel sheet or number magics
TRADE IDEA: WAIT FOR THE STOCK TO BREAKOUT IN WEEKLY TIMEFRAME ABOVE THIS LEVEL.
Checkout an amazing breakout happened in the stock in Weekly timeframe.
Breakouts happening in longer timeframe is way more powerful than the breakouts seen in Daily timeframe. You can blindly invest once the weekly candle closes above the breakout line and stay invested forever. Also these stocks breakouts are lifelong predictions, it means technically these breakouts happen giving more returns in the longer runs. Hence, even when the scrip makes a loss of 10% / 20% / 30% / 50%, the stock will regain and turn around. Once they again enter the same breakout level, they will flyyyyyyyyyyyy like a ROCKET if held in the portfolio in the longer run.
Time makes money, GREEDY & EGO will not make money.
Also, magically these breakouts tend to prove that the companies turn around and fundamentally becoming strong. Also the magic happens when more diversification is done in various sectors under various scripts with equal money invested in each N500 scripts.
The real deal is when to purchase and where to purchase the stock. That is where Breakout study comes into play.
Check this stock which has made an all time low and high chances that it makes a "V" shaped recovery.
> Taking support at last years support or breakout level
> High chances that it reverses from this point.
> Volume dried up badly in last few months / days.
> Very high suspicion based analysis and not based on chart patterns / candle patterns deeply.
> VALUABLE STOCK AVAILABLE AT A DISCOUNTED PRICE
> OPPURTUNITY TO ACCUMULATE ADEQUATE QUANTITY
> MARKET AFTER A CORRECTION / PANIC FALL TO MAKE GOOD INVESTMENT
DISCLAIMER : This is just for educational purpose. This type of analysis is equivalent to catching a falling knife. If you are a warrior, you throw all the knives back else you will be sorrow if it hits SL. Make sure to do your analysis well. This type of analysis only suits high risks investor and whose is willing to throw all the knives above irrespective of any sectoral rotation. BE VERY CAUTIOUS AS IT IS EXTREME BOTTOM FISHING.
HOWEVER, THIS IS HOW MULTIBAGGERS ARE CAUGHT !
STOCK IS AT RIGHT PE / RIGHT EVALUATION / MORE ROAD TO GROW / CORRECTED IV / EXCELLENT BOOKS / USING MARKET CRASH AS AN OPPURTUNITY / EPS AT SKY.
LET'S PUMP IN SOME MONEY AND REVOLUTIONIZE THE NATION'S ECONOMY!
Apollo Hospitals – Inverted Head & Shoulders BreakoutChart Pattern: Inverted Head & Shoulders
Timeframe: Daily
Breakout Level: ₹7,565
Target: ₹8,980
Potential Upside: +18.7%
Stop Loss: ₹7,250
Volume: Strong breakout volume confirms institutional activity
RSI: 71 – Momentum strong, no signs of exhaustion or divergence
Technical Thesis:
Apollo Hospitals has completed a multi-month inverted head & shoulders pattern with a breakout above the ₹7,565 neckline zone. The structure developed over 8 months, showing accumulation and basing under resistance. The breakout is supported by the highest volume since Oct 2023 and a clean bullish candle. There is no visible supply zone until the ₹8,800–₹9,000 area, suggesting potential for a swift move.
Trade Plan:
Entry: On breakout above ₹7,565 or on pullback to ₹7,450–₹7,500 (if offered)
Target: ₹8,980 (based on measured move projection)
Stop Loss: ₹7,250 (below neckline and prior range low)
Risk:Reward: ~3.5:1
Disclaimer:
This chart and analysis are intended for educational and informational purposes only. This is not a recommendation to buy, sell, or hold any financial instrument. The views expressed are based on technical patterns and personal interpretation and may not reflect actual market movement. Always do your own research and consult your financial advisor before making any trading decisions. Trading in equities involves risk of capital loss.

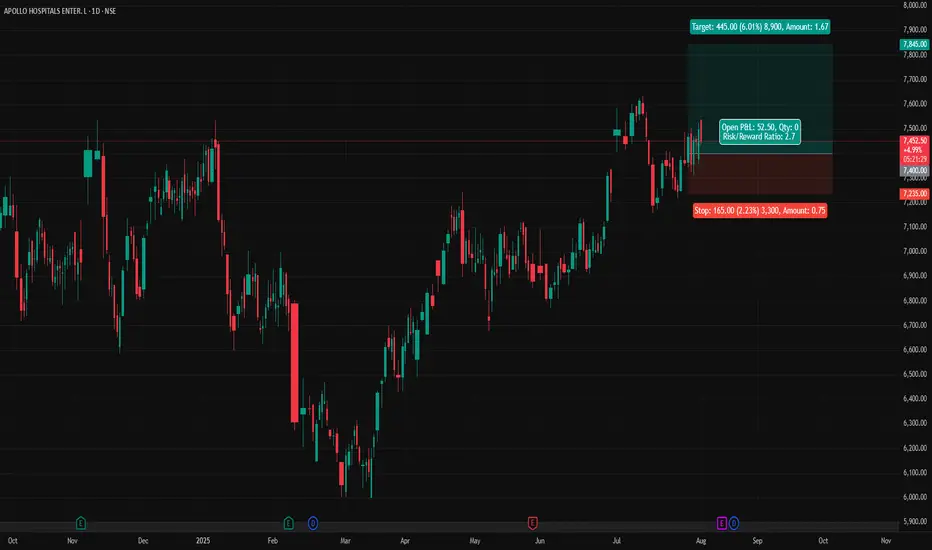
APOLLOHOSP - Apollo Hospitals (Daily chart, NSE) - Long PositionAPOLLOHOSP - Apollo Hospitals Enterprise Ltd. (Daily chart, NSE) - Long Position
Risk assessment: Medium {support structure integrity risk}
Risk/Reward ratio ~ 2.7
Current Market Price (CMP) ~ 7450
Entry limit ~ 7400 on Aug. 01, 2025
Target limit ~ 7845 (+6.01%; +445 points)
Stop order limit ~ 7235 (-2.23%; -165 points)
Disclaimer: Investments in securities markets are subject to market risks. All information presented in this group is strictly for reference and personal study purposes only and is not a recommendation and/or a solicitation to act upon under any interpretation of the letter.
LEGEND:
{curly brackets} = observation notes
= important updates
(parentheses) = information details
~ tilde/approximation = variable value
-hyphen = fixed value
Apollo Hospital- Bullish Swing-Short, Breakout expected!!Swing to Short term
Holding- 1-4 Weeks
Risk Reward: 1:1.5
Buy 7500
Target: 8166
SL- 7076
Bullish Engulfing
Breakout and restest done
Support rejection
21 EMA rejection and 21/50 EMA cross over

Apollo Hospital Long_Support @ 20 DEMAApollo Hospital Long:
- Price Takes support at 20 DEMA
- Earnings next week
- Enter long with tight SL
- SL - CLose below 20 DEMA

Review and plan for 30th June 2025Nifty future and banknifty future analysis and intraday plan.
Swing ideas.
This video is for information/education purpose only. you are 100% responsible for any actions you take by reading/viewing this post.
please consult your financial advisor before taking any action.
----Vinaykumar hiremath, CMT

APOLLO HOSPITALS: Symmetrical Triangle Breakout WatchApollo Hospitals (APOLLOHOSP) is currently forming a well-defined Symmetrical Triangle pattern on the daily chart.
Key Observations:
• Symmetrical Triangle: Price action has been consolidating within converging trendlines,
indicating indecision between buyers and sellers.
• Potential Breakout: A breakout above the upper trendline of the triangle, coupled with
increased volume, would signal a bullish continuation.
• Target 1 (Post-Breakout): The chart indicates a "Target 1 - for Positive Breakout" around
the 7300-7350 zone, which aligns with previous resistance levels.
• All-Time High Price Zone: The stock previously reached an "All Time High Price Zone"
around 7500-7600, which could be a further upside target if the bullish momentum
sustains.
Trading Idea:
• Entry: Look for a sustained breakout above the upper trendline of the symmetrical triangle. Confirm with strong volume.
• Target 1: 7300 - 7350 (Based on previous resistance and indicated target).
• Stop Loss: A break below the lower trendline of the symmetrical triangle would
invalidate the bullish setup. Traders can place stop-loss orders below a recent swing low
within the triangle or slightly below the lower trendline post-breakout confirmation.
Risk Management:
• Always use appropriate risk management and position sizing.
• Monitor volume closely during the breakout attempt.
Disclaimer : This is for educational purposes only and not financial advice. Do your own research before making any trading decisions.

it may start 3rd wavegood buying opportunity , i think 3rd wave can straet from here.it will go up to 7600 first target. After c wave ,you got higher high .

Possible Swing trade setup in Apollo HospitalPossible Swing trade setup in Apollo Hospital:
Note: This analysis is for educational purposes only, consult a qualified financial advisor before taking a trader.

APOLLO HOSPITALS Rounding Pattern•CMP: ₹6920| Stop Loss: ₹6700 Target:*7400
DISCLAIMER: I am NOT a SEBI registered advisor or a financial adviser. All the views are for educational purpose only.

Apollo Hospitals - Elliott Wave Analysis Apollo Hospitals - Elliott Wave Analysis (4H Timeframe) 📉
🔍 Key Observations :
1️⃣ The Stock Has Completed a Wave 3 Top and Is Currently in a Corrective Wave 4
In Elliott Wave Theory, Wave 3 is usually the strongest and most extended impulse wave in a five-wave structure.
The chart indicates that Apollo Hospitals reached a peak, marking the end of Wave 3 (labeled as (3) in black).
Following the completion of Wave 3, a corrective Wave 4 is now in progress, as expected in a typical five-wave sequence (1-2-3-4-5).
Wave 4 corrections tend to be complex and can take various forms, such as zigzags, flats, or triangles.
2️⃣ The Corrective Structure Appears to Be Unfolding in an ABC Pattern
Within Wave 4, the correction seems to be forming a standard ABC corrective structure, where:
Wave A represents the initial downward move.
Wave B is a counter-trend rally (temporary bounce).
Wave C is expected to complete the correction with another downward move.
The chart suggests that Wave A and Wave B have already been formed, and Wave C is now developing, likely moving towards lower levels.
Wave B can sometimes exceed Wave A in some cases (irregular flat), but in this case, it looks like a regular zigzag correction.
3️⃣ Important Fibonacci Levels Suggest Potential Targets Around ₹6,500 and ₹4,925
Fibonacci retracement and extension levels help in identifying potential support and resistance zones.
If Wave C follows the standard structure, a move towards these levels could be expected before a potential Wave 5 rally begins.
🚨 Disclaimer: The content shared is for educational and informational purposes only and should not be considered financial advice, investment recommendations, or trading signals. I am not a SEBI-registered analyst or advisor. Always conduct your own research and analysis before making any financial decisions. Trading and investing involve significant risk, and past performance is not indicative of future results. I may be completely wrong in my analysis. Please consult a professional financial advisor before making any investment decisions.y investment decisions.

APOLLO HOSPITAL
Apollo Hospitals' stock is currently showing a neutral to slightly bearish trend. The stock closed at ₹6,105.65, reflecting a 0.84% increase on the last trading day. Analysts have noted that the stock has experienced a negative price breakout recently, trading below its second support level.
Key support levels for the stock are around ₹6,000–₹6,050, while resistance levels are near ₹6,200–₹6,250. If the stock breaks above ₹6,200, it could signal upward momentum, but a dip below ₹6,000 might lead to further selling pressure.


Apollo Hospitals Trading Opportunity. 3%Apollo Hospitals at Trend Line support zone
Good Risk: Reward

ApolloHospital Analysis & ProjectionAnalyzed using different approach and found that it is in uptrend. Expecting two target to be achieved in this February months

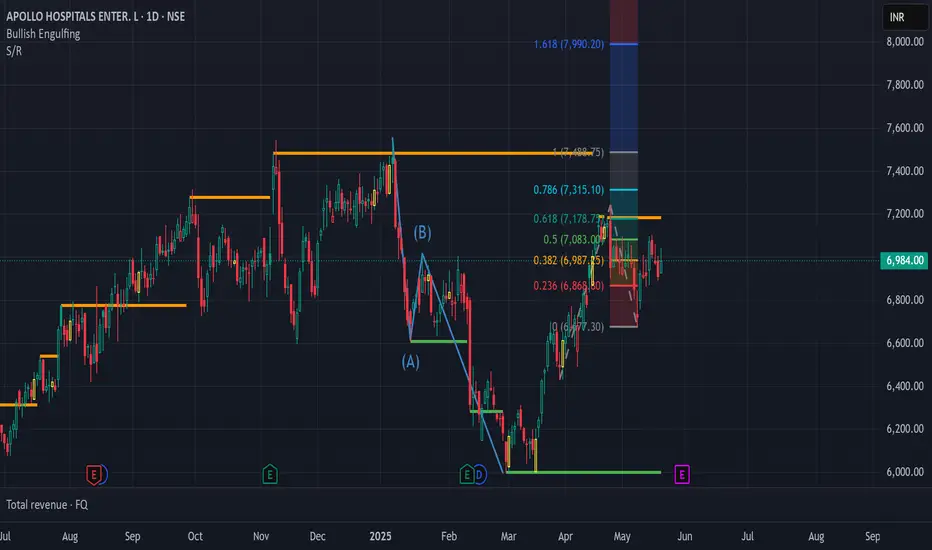
APOLLO HOSPITALS: SWING TRADE SETUP ALERT!**🚨 APOLLO HOSPITALS: SWING TRADE SETUP ALERT! 🚨**
**💹 Current Price Action:**
Apollo Hospitals is approaching a **key support zone** at **₹6,717**, setting up for a potential **BIG MOVE**. The battle between bulls and bears is heating up—will earnings decide the breakout?
### **📊 Key Levels to Watch:**
🔥 **Resistance Zone:** ₹7,381 – If the price crosses this, it could trigger a **bull rally**.
🔵 **Support Zone:** ₹6,717 to ₹6,679 – Bulls must defend this area to avoid further downside.
⚠️ **Critical Level:** ₹6,506 – Breaking below this signals a **bearish continuation**.
### **💡 Swing Trade Strategy:**
- **Bullish Play:** Enter above ₹6,717 with a target of ₹7,119 and ₹7,381.
- **Bearish Play:** Short below ₹6,679, aiming for ₹6,506.
---
**📅 Weekly Earnings in Focus:**
The upcoming **earnings report** (📉 purple icon on the chart) is the **wildcard**! Positive results can catapult prices back above the 44-day SMA (₹7,119), reigniting the **bullish momentum**. Weak earnings? Expect a test of ₹6,506.
### **🔥 Today’s Takeaway:**
Apollo Hospitals is at a **make-or-break point**. Whether you're bullish or bearish, this is the perfect swing trade opportunity. **Don't blink—this one’s about to move! 🚀**

Broadening Wedge Formation in Apollo Hospitals (NSE: APOLLOHOSP) Implications of the Pattern:
Market Psychology:
The expanding triangle reflects growing uncertainty and volatility, often seen during periods of fundamental shifts or major market news.
Breakout Potential:
The pattern typically resolves in the direction of the prevailing trend (upward in this case, given the stock's long-term ascending channel).
Current Scenario:
The stock is currently near the lower boundary of the triangle, aligning with the long-term ascending channel support. This creates a dual-support zone, increasing the probability of a bounce.
RSI in Oversold Zone:
Oversold conditions combined with a strong support zone suggest a likely reversal.
Trading Strategy
Entry Point:
Enter near the current support zone (above ₹6,750).
Ensure the stock holds above ₹6,600 to confirm the support remains intact.
Target Levels:
Target 1: ₹7,400 (mid-point of the expanding triangle and previous resistance).
Target 2: ₹7,777 (upper boundary of the channel and triangle).
Stop Loss:
Place a stop loss below ₹6,600 to protect against a breakdown.
Breakout Strategy:
If the stock breaks out of the upper boundary of the expanding triangle with high volume, it could accelerate toward ₹8,000+ levels.
