Price action analysis - ASIANPAINTNSE:ASIANPAINT had a good run up until recently and now it seems to have been topped out. In Weekly chart, rising wedge structure is formed and volume has declined with it. It suggests that buyers are losing the grip and sudden fall to 2625 with heavy volume confirms the reversal. Buyers stepped in from 2625 level and took the price higher but subsequent price action suggests that they have been exhausted and seem to be losing control. If price couldn't hold above 3100 level then it's going back to 2645. If it can't hold that one then it will go further down to 2275. Let's see what happens.
ASIANPAINT trade ideas

ASIANPAINT sell for intraday tradingASIANPAINT sell for intraday trading if stock break the given support level...............
ASIAN PAINTS - BULLISH HARMONIC PATTERN - GOOD ENTRY !Bullish Harmonic Pattern Established, possible targets mentioned in the chart
Disclaimer - This is not a buy or sell advice. I am sharing what I see on the chat & what I am trading, based on my own knowledge & understanding. Please consult your financial advisor before taking any bets in the stock market. I will not be responsible for any profit/loss you incur on your trades based on my published ideas.


ASIANPAINT buy for intraday tradingASIANPAINT buy for intraday trading if stock break the given resistance zone then we will buy the stock.......

Asian Paints WyckoffIf you havent figured it out yet, god bless you.
Oil prices impact will be seen in this quarter in July, to plummet the price.
Good luck!


ASIANPAINT buy for intraday tradingASIANPAINT buy for intraday trading if stock break the given resistance level.........


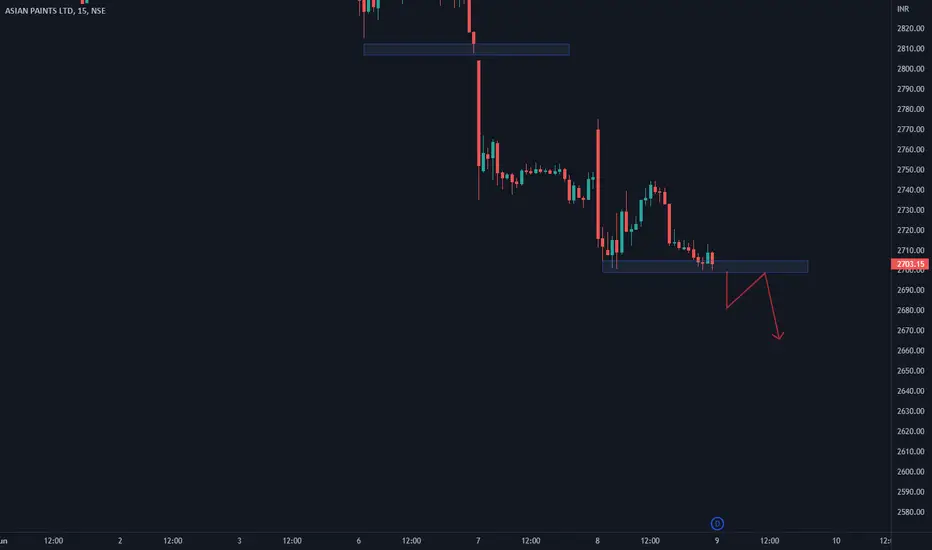
ASIANPAINT sell for intraday tradingASIANPAINT sell for intraday trading if stock break the given support zone...

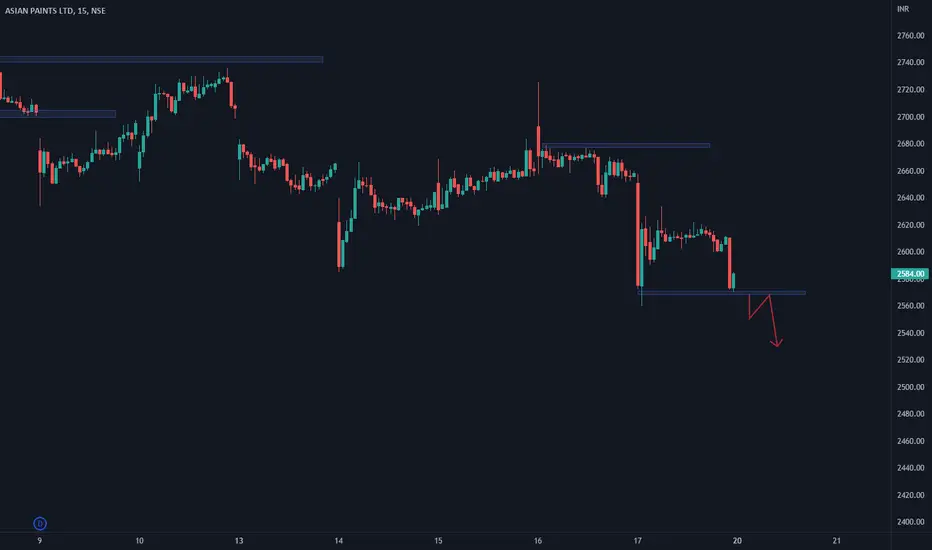
ASAINPAINT sell for intraday tradingASAINPAINT sell for intraday trading if stock break the given support zone..........


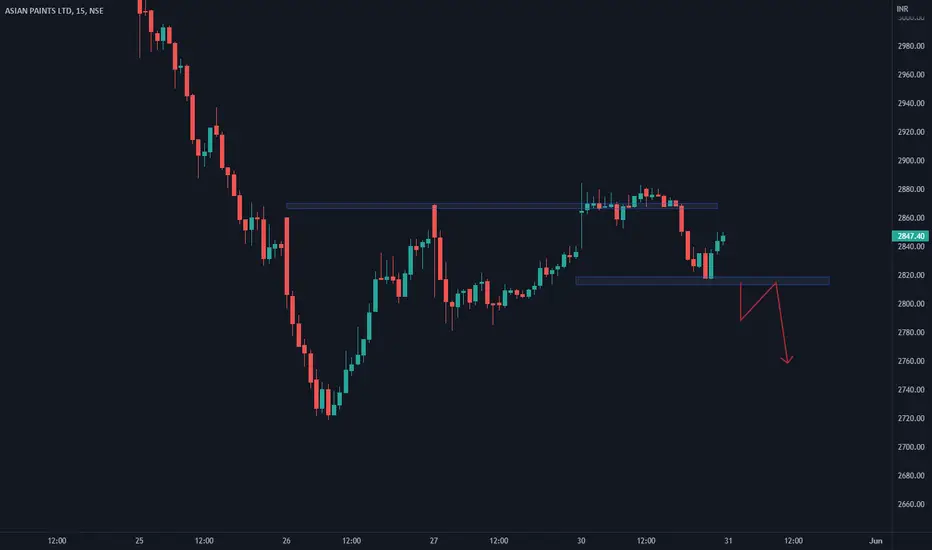
ASIANPAINT Sell for intraday tradingASIANPAINT Sell for intraday trading if stock break the given support zone.....
Asian paintsvolume continuously increasing with fallind down in price trend.
wait for support. but i recommend you for trend line support.

Asian paintsNext support 2692.75. if it break support line then next target on Trend line support.
Wait for trend line support after that we will take next step.

Asianpaints looking towards 2700Asian corrected huge today, and based on the trendlines looks like it might hit 2700, for a pause and if not sustained can go all the way 2600. before some bounce! No longs adviced

ASIANPAINT buy for intraday tradingASIANPAINT buy for intraday trading if stock break the given resistance level..........

Heavy ResistanceHeavy Resistance at 3211 go short position if trend continues on monday watch for volumes
Asian paint seems as going side ways

My view on Asian PaintAsian Paint forming double bottom.Above 3130 should hit 3200++ in very short term.

