BHARAT FORGE – Ready for Upside MoveBHARAT FORGE – Ready for Upside Move
CMP: 1433
Stoploss: 1295
Targets: 1622 / 1700 / 1804 (ATH)
Technical View (Direct & Clear):
Bharat Forge is trading right near the 61.8% retracement zone at 1445, a crucial breakout level.
Stock already gave a small rounding bottom breakout at 1362 and has been sustaining strongly above it.
Once it crosses and holds above 1445, upside momentum can accelerate sharply.
First leg of the move can take it to 1622.
After achieving 1622, the trend structure supports a continuation toward:
1700, and then
All-time high 1804.
Setup remains bullish as long as 1295 holds.
⚠️ Clarification:
This is an independent analysis based purely on technical and market study. No part of Religare is involved in this view or recommendation.
📝 Important:
I am not responsible for any loss or profit incurred. I am not taking any fees for these views – just sharing my analysis for educational and informational purposes.
📉 Disclaimer: Not SEBI-registered. Please do your own research or consult a financial advisor before taking any investment decision.
Market insights

BHARATFORG Breaking Out | Targets 1,400+BUY Setup 🔨
Entry: ₹1,300-1,305 (Current Level)
Target 1: ₹1,330-1,340
Target 2: ₹1,365-1,375
Target 3: ₹1,400+ (Extended)
Stop Loss: ₹1,275
Technical Rationale:
Strong bullish momentum with +4.56% gain today
Breaking above major descending trendline resistance (visible from June highs)
Consolidation breakout from 1,265-1,285 range
Good volume (3.45M) supporting the breakout
RSI around 65, showing strength with room for further upside
Price attempting to cross key resistance at 1,300 psychological level
Falling wedge pattern breakout - typically bullish
Auto sector strength supporting the move
Support established at 1,280 zone
Risk-Reward: Favorable 1:3 ratio
Pattern: Descending wedge breakout - classic bullish reversal pattern
Strategy: Positional trade - Book 40% at T1 (1,335), 30% at T2 (1,370), trail remaining with SL at 1,310 after T1
Key Levels:
Strong Resistance: 1,310, 1,340, 1,365
Support: 1,280, 1,265


#BHARATFORG - VCP BO in DTFScript: BHARATFORG
Key highlights: 💡⚡
📈 W Bottom Patter in the WTF
📈 VCP BO in DTF
📈 Volume spike seen during Breakout
📈 MACD Bounce
⚠️ Important: Always Exit the trade before any Event.
⚠️ Important: Always maintain your Risk:Reward Ratio as 1:2, with this RR, you only need a 33% win rate to Breakeven.
✅Boost and follow to never miss a new idea! ✅
Disclaimer: I am not SEBI Registered Advisor. My posts are purely for training and educational purposes.
Eat🍜 Sleep😴 TradingView📈 Repeat 🔁

BHARATFORG | Risk-Takers Buy @LTP or Safer Entry above @1330BHARATFORG | Risk-Takers Buy @LTP or Safer Entry above @1330 | SL below 1220 | Target 1695
Disclaimer:
This is not financial advice. Please do your own research or consult with a financial advisor before making any investment decisions. Investments in stocks can be risky and may result in loss of capital.

BHARATFORG long for 1278BHARATFORG looks good for 1278
Entry - 1205 (Triggered)
Stop loss - 1194
Target - 1278.5
Risk Reward - 1:6.6

BHARAT FORGE LTD S/RSupport and Resistance Levels:
Support Levels: These are price points (green line/shade) where a downward trend may be halted due to a concentration of buying interest. Imagine them as a safety net where buyers step in, preventing further decline.
Resistance Levels: Conversely, resistance levels (red line/shade) are where upward trends might stall due to increased selling interest. They act like a ceiling where sellers come in to push prices down.
Breakouts:
Bullish Breakout: When the price moves above resistance, it often indicates strong buying interest and the potential for a continued uptrend. Traders may view this as a signal to buy or hold.
Bearish Breakout: When the price falls below support, it can signal strong selling interest and the potential for a continued downtrend. Traders might see this as a cue to sell or avoid buying.
MA Ribbon (EMA 20, EMA 50, EMA 100, EMA 200) :
Above EMA: If the stock price is above the EMA, it suggests a potential uptrend or bullish momentum.
Below EMA: If the stock price is below the EMA, it indicates a potential downtrend or bearish momentum.
Trendline: A trendline is a straight line drawn on a chart to represent the general direction of a data point set.
Uptrend Line: Drawn by connecting the lows in an upward trend. Indicates that the price is moving higher over time. Acts as a support level, where prices tend to bounce upward.
Downtrend Line: Drawn by connecting the highs in a downward trend. Indicates that the price is moving lower over time. It acts as a resistance level, where prices tend to drop.
Disclaimer:
I am not SEBI registered. The information provided here is for learning purposes only and should not be interpreted as financial advice. Consider the broader market context and consult with a qualified financial advisor before making investment decisions.

Possible Swing Trade in Bharat Forge1. Good volumes
2. MACD Signal turned green
3. RSI crossing above 50
4. Stock returning after forming a base at 50% retracement
5. Good weekly close
6. Risk - Reward is more than 2

BHARAT FORGE - LONGNSE:BHARATFORG Weekly chart showing positive momentum starts at bottom with buyers comes at location of four years. Momentum indicators also positive to support to price pull back to previous high in short time.

Bharat Forge Ltd view for Intraday 22nd April #BHARATFORG Bharat Forge Ltd view for Intraday 22nd April #BHARATFORG
Resistance 1100 Watching above 1103 for upside movement...
Support area 1085 Below 1085 ignoring upside momentum for intraday
Watching below 1080 for downside movement...
Above 1100 ignoring downside move for intraday
Charts for Educational purposes only.
Please follow strict stop loss and risk reward if you follow the level.
Thanks,
V Trade Point

bharat forgeBFRG, which makes safety and critical components for different sectors, said its unit entered a deal with Taiwan's Compal Electronics
2324
** Deal for manufacturing platform servers used in central processing units of computers

BHARAT FORGE: INVERSE H&SThe Inverse Head and Shoulders pattern is a bullish reversal chart pattern that signals a potential trend reversal from bearish to bullish. It consists of three key components:
Structure of the Pattern:
Left Shoulder: A price decline followed by a temporary rally.
Head: A deeper decline forming the lowest point, followed by another rally.
Right Shoulder: A decline similar in size to the left shoulder but not as deep as the head, followed by a move higher.
Neckline: A resistance level that connects the highs of the two rallies after the left shoulder and head.
The Inverse Head and Shoulders pattern in Bharat Forge, with a neckline at ₹1100, indicates a potential bullish reversal. The stock has formed a well-defined left shoulder, head, and right shoulder, suggesting that selling pressure is weakening. A breakout above ₹1100, supported by strong volume, could confirm the pattern and trigger an upward move. The target price for this breakout is ₹1200, calculated by measuring the distance from the head’s low to the neckline and projecting it upwards. If the stock sustains above the neckline, it could gain further momentum. However, traders should consider placing a stop-loss below the right shoulder to manage risk in case of a failed breakout.

BHARATFORG - LONG The stock is trading in monthly buy zone, down 56% from all time high, it is also a leader stock in its sector, it is a long term buy. Not for swing trading buy side.

BharatForge Analysis.I have analyzed it using trend , wave & Gann techniques. It is looking week. This is my monthly projection for February month. First target is 1108 and then second target.

Bharat Forge - mid term analysis
Bharat Forge appears to be showing signs of recovery, and in the short to mid-term, we can anticipate a positive turnaround. A potential downside range for accumulation would be 1133-1023. Once the price crosses and sustains above 1344, it has the potential to rise to 1550-1670 or higher. All relevant levels are indicated in the chart provided.

Breakdown of supportA major support breing broken with retest. Weakness expected in chart further ahead.
Not a trading recommendation. Only sharing a chart setup.

Bharat Forge ltd forming bulish bat pattern Bharat Forge ltd forming bulish bat pattern price revers zone is 1170 once retest . it will bulish

#BHARATFORGECan be sold below 1290 for 1st target of 1245 and second target of 1200
It will be breakdown of rising wedge pattern in downward trend . daily candle is gravestonedoji
so high chances of 1290 to get broken
Disclaimer : This is purely for educational purpose

Review and plan for 18th NovemberNifty future and banknifty future analysis and intraday plan.
Results analysed.
This video is for information/education purpose only. you are 100% responsible for any actions you take by reading/viewing this post.
please consult your financial advisor before taking any action.
----Vinaykumar hiremath, CMT

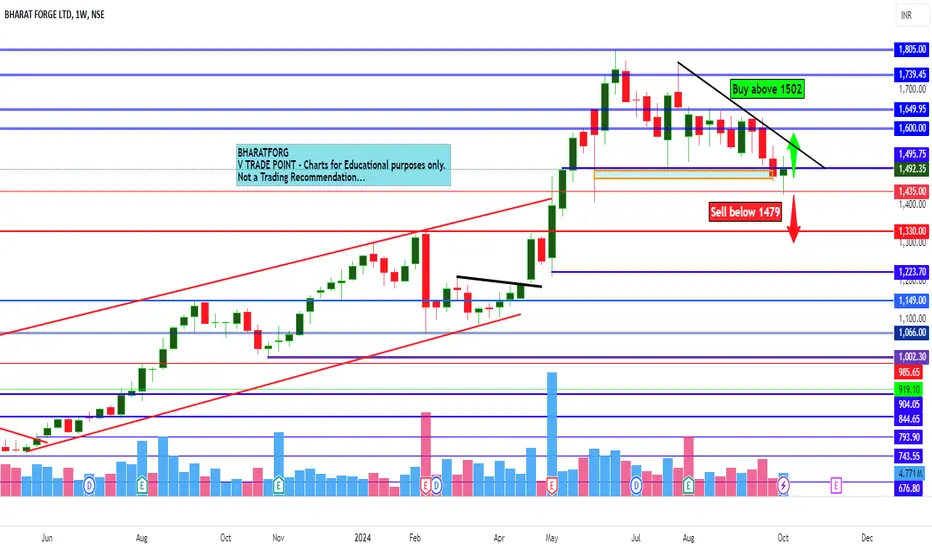
Bharat Forge ltd view for Intraday 14th October #BHARATFORG Bharat Forge ltd view for Intraday 14th October #BHARATFORG
Buying may witness above 1502
Support area 1479-1480. Below ignoring buying momentum for intraday
Selling may witness below 1479
Resistance area 1500
Above ignoring selling momentum for intraday
Charts for Educational purposes only.
Please follow strict stop loss and risk reward if you follow the level.
Thanks,
V Trade Point

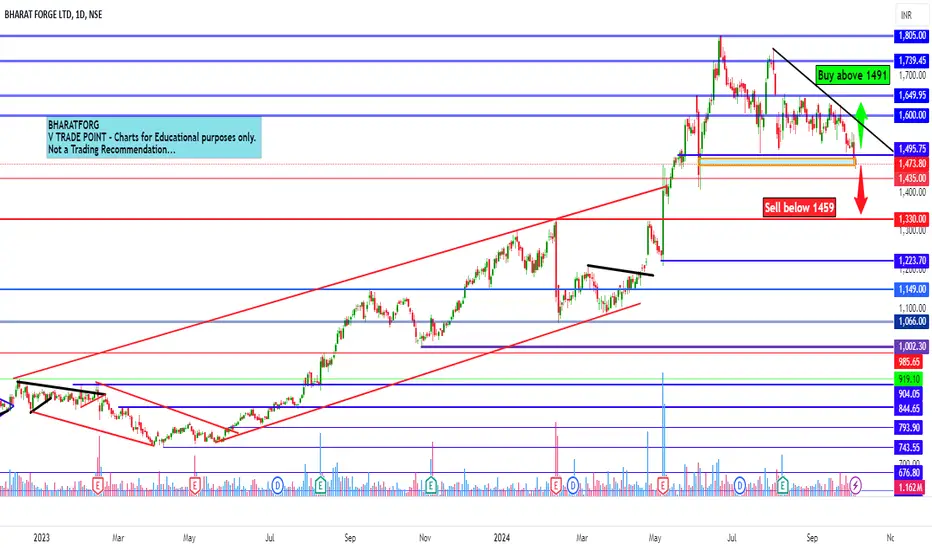
Bharat Forge ltd view for Intraday 7th October #BHARATFORG Bharat Forge ltd view for Intraday 7th October #BHARATFORG
Buying may witness above 1491
Support area 1475. Below ignoring buying momentum for intraday
Selling may witness below 1459
Resistance area 1475
Above ignoring selling momentum for intraday
Charts for Educational purposes only.
Please follow strict stop loss and risk reward if you follow the level.
Thanks,
V Trade Point
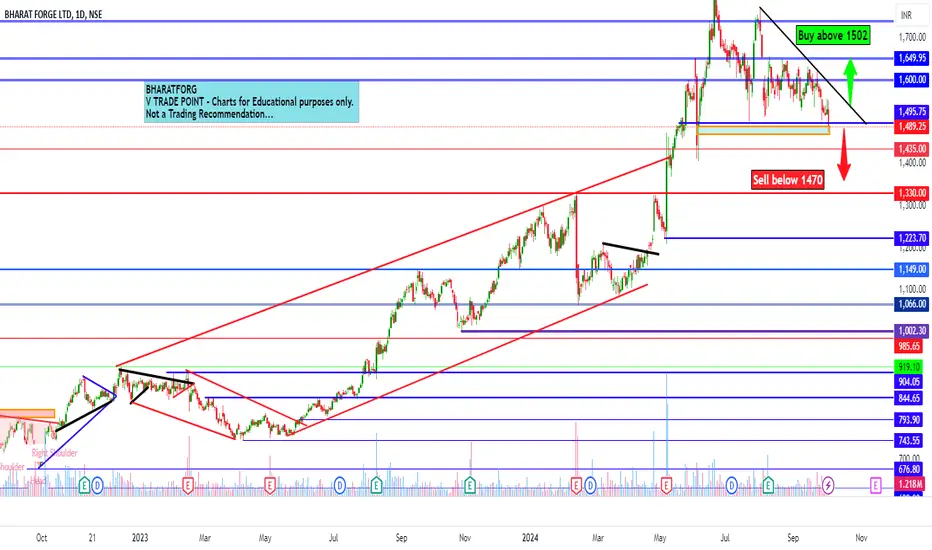
Bharat Forge Ltd view for Intraday 4th October #BHARATFORG Bharat Forge Ltd view for Intraday 4th October #BHARATFORG
Buying may witness above 1502
Support area 1485. Below ignoring buying momentum for intraday
Selling may witness below 1470
Resistance area 1485
Above ignoring selling momentum for intraday
Charts for Educational purposes only.
Please follow strict stop loss and risk reward if you follow the level.
Thanks,
V Trade Point