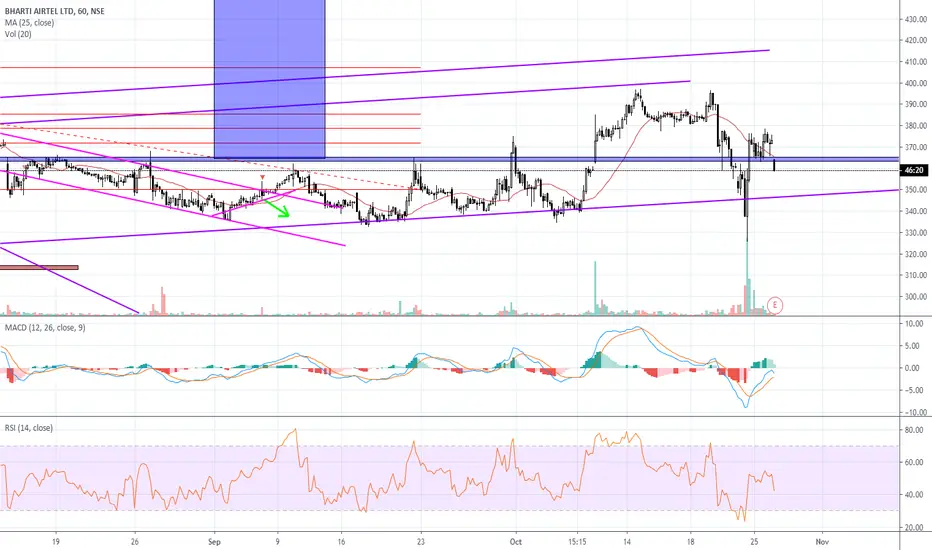
Bharti Airtel - Hourly ChartRecently BhartiArtl has created double top and then fall drastically to 330 level. Stock recovered almost 70.7% from 330 level and again showing weakness.
From the top, Stock is in wave (C) of zigzag pattern and expecting the 100% retracement of wave (A) which is coming near 310 level. Risk and Reward ratio is also very good. EMA (34) will act as trailing stop loss (current SL --> 369). Risk to reward ratio is 1 : 3.8.
BHARTIARTL trade ideas

Bharti Airtel LongBharti Airtel in a Channel since 1 year is at its support now.
Buy at these levels SL:- 330 , Target :- 390


826. news based trade (for intraday purpose only)Sl compulsory
expecting 2 to 3 % fall from current level; if gap down more than 2%, then ignore this trade.


BHARTIARTLVERY LONG TERM SELL SETUP :) WAITING FOR THE PRICES TO TOUCH THE SWING LOWS.
NOTE: MY VIEW ONLY....


617 SAN; News based trade (Intraday)Risky play
News is Airtels Biggest Quaterly loss
Gap down near 320 leads the price to push 317 to 315 or 310


An explosive move , but where?Airtel has an interesting pattern. There is a 5 wave complete pattern which is either an Ending diagonal or a Triangle. Depending on which one it is, the next move could be very swift - either up (in case of a triangle) or a down(in case of an ED). Need to wait for a clear confirmation for continuation.


Supertrend green signal. ADX positive. Buy at Now. Traget 0.5 % Supertrend green signal. ADX positive. Buy at 323.80. Traget 0.5 % to 0.8%. Day trading. I'm in now


AIRTELWill the falling subscriber base lead to further pressure on bharti airtel ?
Chart says market will decide it tomorrow.
Trade on the conformation of breakout as per Monk strategy.
