#britannia cup and handle in making- Bo tgts are 6700/-cup and handle BO in britannia-
FMCG 1st tgt shall be 6480 as per charts- monthly charts 6690/6700 shall be coming sooner than later.
today closed exactly at last months HIGH.
sl can be 6108/-clbs - for very short term..
Market insights

BRITANNIA Price traded at Gap area. So possiblity that it will be moves upper side....
This idea is for Educational purpose and paper trading only. Please consult your financial advisor before investing or making any position. Facts or Data given above may be slightly incorrect. We are not SEBI registered

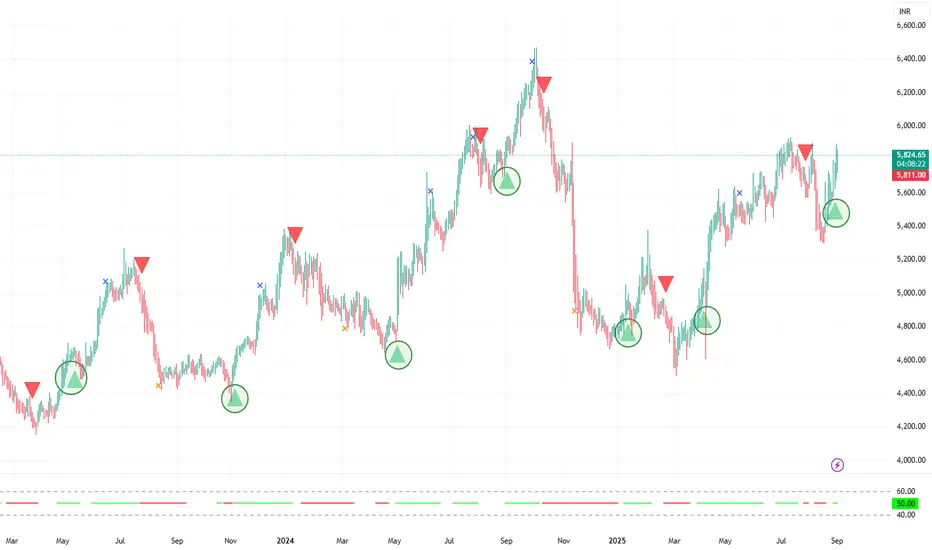
Britannia - Daily - fresh buy triggeredBritannia has triggered a fresh buy signal on the daily
Past instances are highlighted. It is a beneficiary of the recent GST rate cuts and likely Govt moves to spur consumption
DEFENSIVE stock ,only looking bullish stockafter analyse many stock , this stock looks bullish and it it near its all time high as well , this stock can work as defensive stock this time

Multiyear SupportThis stock price trading near multiyear Support low risk zone for any stock near 4700 .

BRITANNIA INDUSTRIES has formed Ascending Triangle PatternNSE:BRITANNIA has formed an Ascending Triangle Pattern. You can enter at current point . 1st target would be 6140, followed by Second target 6240 and finally Third target 6280. Kindly keep Stopp loss at 5605

Britania Notable Fluctuations In the last few days, Britannia's stock has experienced notable fluctuations, driven by market sentiment and recent earnings reports.
Following a positive outlook from analysts, the stock saw a brief rally, fueled by strong consumer demand and effective cost management strategies.
However, profit-taking and broader market trends led to slight pullbacks.
Overall, the stock remains a focus for investors watching for further developments in the FMCG sector and its ongoing recovery post-pandemic.
Buy at 5869
SL 1:- 5848
SL 2:- 5827
TGT1 :- 5910
TGT2:- 5980

Britannia Risk:Reward of 1:2 to 1:4.🟢 Entry Analysis
Current Price: ₹5,407.50
Support Zone: ₹5,356.55 – ₹5,218.20
Observation: Price has recently bounced off the support zone around ₹5,356, forming a short-term base. Today’s candle is bullish, indicating buying interest.
✅ Possible Entry:
Enter above ₹5,410–5,420, confirming bullish momentum continuation after the support bounce.
Confirm with volume: If volume increases on bullish candles, it supports the move.
🎯 Exit / Target Levels
Resistance 1: ₹5,621.25 — test from November; profit-booking likely here.
Resistance 2: ₹5,800 (next psychological level if ₹5,621 is breached).
🎯 Target 1: ₹5,620
🎯 Target 2: ₹5,750–5,800 (only if ₹5,620 breaks with strong volume)
🛑 Stop-Loss
Place stop-loss below ₹5,350, or safer at ₹5,310, which is just below recent lows and strong support.
This gives you a risk of ~₹100 vs a potential reward of ₹200–₹400, offering a Risk:Reward of 1:2 to 1:4.
⚠️ Caution
Stock previously had a large gap-down in November, suggesting overhead supply exists.
Momentum might pause near ₹5,620 due to past resistance — watch for a reversal signal or booking partial profits.

Britannia: FMCG Bounce in Play?🚀 Britannia: FMCG Bounce in Play? 🚀
📉 Current Market Price (CMP): ₹4845
🔒 Stop Loss: ₹4690
📈 Targets: ₹5045 | ₹5232
📊 Why Britannia Looks Promising:
🔹 Sector Rotation Insight:
After a strong run in Nifty, Banking, and IT sectors, FMCG appears primed for a potential bounce—and Britannia stands out as a top pick for this move.
🔹 Technical Setup:
The stock is holding key support levels, presenting a low-risk, high-reward opportunity for a short-term bounce.
💡 Strategy & Risk Management:
🔒 Stop Loss: Maintain a strict stop loss at ₹4690 to limit downside risk and protect capital.
📈 Staggered Entry: With the recent market rally, adopt a phased entry approach to mitigate volatility and enhance risk management.
⚠️ Caution: The market has already experienced a significant move—position sizing should be adjusted carefully to maintain a favorable risk-to-reward ratio.
📍 Outlook:
As FMCG gears up for a potential bounce, Britannia offers a timely swing trading opportunity with defined risk parameters and clear technical targets.
💬 Do you see FMCG leading the next market move? Share your insights below!
📅 Follow for more technical insights and actionable market updates.
📈 #Britannia #FMCG #SwingTrading #TechnicalAnalysis #StockMarket #InvestmentOpportunity
📉 Disclaimer: As a non-SEBI registered analyst, I encourage investors to conduct independent research or consult with financial professionals before making investment decisions.

BRITANNIA | SHORT | SWINGFMCG sector is weak.
In my earlier post I had mentioned that those who are invested in HINDUNILVR must exit all positions as the stock is going to see a major correction towards 1600 levels.
BRITANNIA is also expected to correct towards 4500 price levels this year.
Those seeking to trade options can enter into a short position for Target towards 4765 price levels.

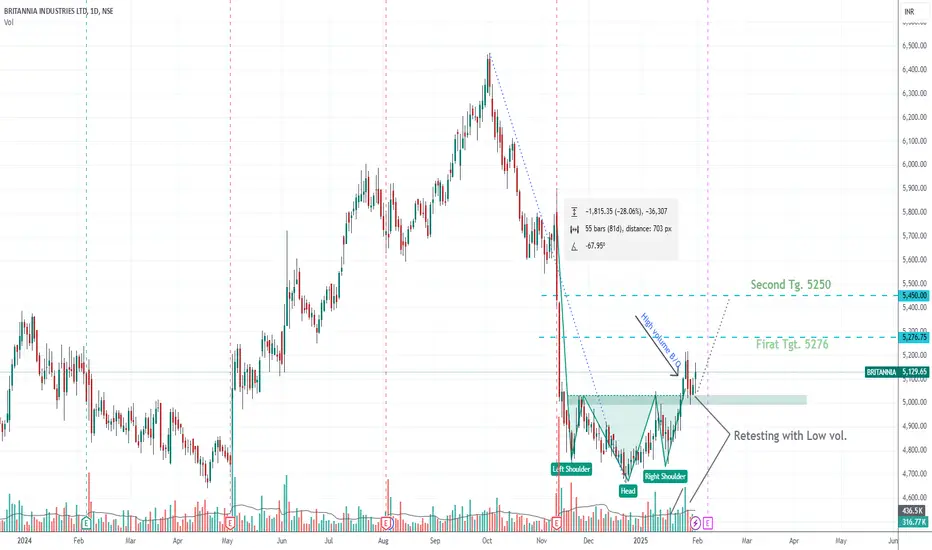
Britania Retesting Inverse Head & shoulder OPPERTUNITY TO BUY !After 28% Correction Britania made an inverse head & shoulder pattern. In past few month FMCG sector is underperformer might give good rally. Considering with a strong balance sheet BRITANIA already gave Strong breakout with above average volume. Either long term Investing or positional Trading you may consider this large cap stock. level is mentioned on chart, Trader can exit if Breakout failed with small stop loss.
BRITANNIA-Likely Rounding Bottom Break OutBritannia : Trading above its 20,50 DEMA Averages.Has formed a nice rounding bottom at 5200.Rounding bottom neckline break out line exactly stands at 5200,if it manages to hold above 5200 -its neckline resistance -as per daily chart pattern expect it to test 5400 -positional Target(For educational purpose only)

BRITANNIANSE:BRITANNIA
Note :
1. One should go long with a Stop Loss, below the Trendline or the Previous Swing Low.
2. Risk :Reward ratio should be minimum 1:2.
3. Plan your trade as per the Money Mangement and Risk Appetite.
Disclamier : You are responsible for your profits and loss.
The idea shared here is purely for Educational purpose.
Follow back, for more ideas and their notifications on your email.
Support and Like incase the idea works for you.

BRITANNIA | STOP & REVERSE | GO LONGBRITANNIA has seen buying step up this week.
Price is holding the Weekly Pivots and HL formations suggests buying is in progress.
The earlier short position needs to be exited and fresh long position can be initiated for a target to 4987 price levels.
SL would be todays low.

BRITANNIA | SHORT | SWINGBRITANNIA has been in a downtrend since 03rd Oct 2024. It broke the crucial long term trend line on 12th November 2024 and then tried to go retest that trend line. However, the stock has gotten rejected even before that trend line was tested and now we can clearly see it headed towards an intermediate trend line which has been in play since March 20222.
Those looking to play Swing, can take short position in Britannia and exit at a target of 4627 price level.

BRITANNIA | LONG | BTSTBritannia price action is bullish today as it has broken out of the Weekly Pivot indicating that buyers are very much in control.
Long position can be taken for a target to 5076 price level.

Britannia Industries - Good Potential Reward - Low RiskBritannia Industries - Good Potential Reward - Low Risk

Britannia Industries Breakout: Will the strategy work?The price appears to have broken above the EMA line after a period of consolidation. This suggests a potential bullish reversal, especially as the candle has closed above the EMA line.
+DI (green line) has crossed above -DI (red line), which is a bullish crossover, indicating upward momentum. The ADX (blue line) above 25, signaling strengthening trend momentum. Hope it gradually increases and stays above 25.
The stop-loss is set below the recent low, and the target is positioned at a level that aligns with prior resistance and a calculated breakout level
Ensure the breakout is accompanied by higher volume. If volume is low, wait for a retest of the EMA line or a bullish candle above it before entering.
However, keep monitoring for bearish reversal signals near the target and consider trailing the stop-loss to lock in profits as the price moves in your favor.

long Investors should monitor these key levels as potential entry points for long positions, especially if you're positioning for the next bull run. It’s crucial to time your buys carefully and maintain a balanced approach when building long positions. Start accumulating gradually as these levels offer a good risk-to-reward ratio, but be mindful of the market's volatility.
Personally, I’m long at 4,700 and looking for further opportunities to scale in as the market develops. Keep an eye on price action around these zones and consider dollar-cost averaging to manage risk effectively.

[Basket] Britannia Buy IdeaNote -
One of the best forms of Price Action is to not try to predict at all. Instead of that, ACT on the price. So, this chart tells at "where" to act in "what direction. Unless it triggers, like, let's say the candle doesn't break the level which says "Buy if it breaks", You should not buy at all.
=======
I use shorthands for my trades.
"Positional" - means You can carry these positions and I do not see sharp volatility ahead. (I tally upcoming events and many small kinds of stuff to my own tiny capacity.)
"Intraday" -means You must close this position at any cost by the end of the day.
"Theta" , "Bounce" , "3BB" or "Entropy" - My own systems.
=======
I won't personally follow any rules. If I "think" (It is never gut feel. It is always some reason.) the trade is wrong, I may take reverse trade. I may carry forward an intraday position. What is meant here - You shouldn't follow me because I may miss updating. You should follow the system I share.
=======
Like -
Always follow a stop loss.
In the case of Intraday trades, it is mostly the "Day's High".
In the case of Positional trades, it is mostly the previous swings.
I do not use Stop Loss most of the time. But I manage my risk with options as I do most of the trades using derivatives

BritanniaPositional / Swing trade opportunity on Britannia
CMP & Entry - 4775
SL - 4330 (on Closing Basis)
Target 1 - 5690 - 5700
Target 2 - 6370 - 6390
DISCLAIMER: Not financial advice. Only for educational purposes.
Invest at your own risk

Multiyear SupportAfter Strong Corrections this Stock price now trading near Multiyear Support . Low risk zone for any stock .

