Broadening wedge pattern on BSEBSE formed a descending right angled broadening wedge pattern on daily chart. With multiple support being tested. It had a strong breakout today with good volume. Also notice volume dried up when price was falling during the pattern formation. You can also notice a good runup prior to the pattern formation. Stop loss can be had just below the breakout candle with profit target the size of broader side of wedge.
Hope you liked my view on BSE. If you think it was worth your time, please boost this idea or leave a comment below on what you think. Otherwise happy trading :-)
BSE trade ideas

BSE Long Target 3000 - 2 months TimeframeBSE Long Target 3000 - 2 months Timeframe
It tried to breach the 2590 December 2023 high second time in Feb 2024 and failed. Today, it breached the high decisively with decent volume. Because it's above 52 week high, Fib projection is used to target the price and 3000 rupees in 2 months timeframe during the results is very likely

BSE Looking GoodNSE:BSE
Target1 - 618
Target2 - 714
Target3 - 1055 (if closing above 714)
Disclaimer :-
I am not SEBI registered. The information provided here is for education purposes only. I will not be responsible for any of your profit/loss with this channel suggestions.
Consult your financial advisor before taking any decisions

BSE LimitedQuarterly Charts
B/O Above 1450 Levels...
Seems lot of steam is left for upside...
Buy on dips...
Levels marked for your perusal...
Like... Share... Follow...
keep revisiting this chart for following the price action..

BSE SwingTrade ideaBSE is currently in a bullish uptrend, indicating a positive market sentiment. Anticipating another bullish momentum, the stock may extend its upward movement, potentially reaching the 2600 level.

BSE - Swing longClassic triangle pattern breakout.
All the details are mentioned in the chart.
Not a recommendation. I am just sharing my view.

BSE still has potential upside?After a fantastic run in a short period, BSE has been consolidating between the range of 2200-2300. In the last trading session's close, the price has taken support at the crucial level of 78.6% retracement. A high above today's close with volume support can take the stock back to its previous high of 2582
Entry - 2320
Stop Loss - 2210
Target - 2580


BSE Chart is looking strong on monthly chartBSE Chart is looking strong on monthly chart
volume buildup seen
strong uptrend seen on chart

BSE - Stock Analysis🚀 **Exciting Stock Opportunity: BSE - STWP View**
📈 **PriceVol**: *Bullish*
- *Last Few Sessions*: Rising Price with Surging Volume
🔥 **OneDay**: *Strong Bullish*
- *Latest Tick*: Robust Price Surge Supported by Strong Volume
📈 **DonchianBand**: *Strong Bullish*
- *Trending Up*: Consecutive New Highs Indicate a Strong Upward Trend
💡 **Bollinger Bands**: *Strong Bullish*
- *Positive Breakout*: Indicative of Favorable Momentum
📊 **Daily Chart**: *Bullish*
- *Heikin Ashi Pattern*: Bullish Continuation Pattern Formed
📅 **Weekly Analysis**: *Strong Bullish*
- *Candlestick Pattern*: Bullish Gap-up at a High Level, Momentum Sustained
🚀 **Trade Recommendation**:
- **Buy above**: ₹2350
- **Stop Loss**: ₹1914
🌐 *Unlock the potential for substantial gains with this thriving stock! Act now and capitalize on the upward momentum.*

BSE BSE Very Strong position for upside seen possible up-comings days because off weekly time frame Doji candle create and second think Fibonacci retrenchment 38 percent close above this is behind the resonance what do think about this stock ? BSE Cmp.464


BSE has give a strong move after breakout Analysis posted on Trading view page on 13th oct
after that we captured almost 500 point in jus 15 days.
simple analysis is always on top
if analysis is right, just sit tight

Bse looks good for 1900Making a ascending on 1hr chart
If break 900++
Stop1700
Risk 100rs..reward 100++
Rr..1:1
Nifty in a selling spree..be cautious
Follow strict stop
Already rallied ..so bit risky call..

BSE new trade updateabove 1515 we will see upside movement of 100 points more
with sl 1435
target 1600+++

BSE new All Time High BSE has a beautiful price action, can see new ATH, and we have already made a entry,
dont miss just 9 points SL, and 1:5 RR

Bse Ltd.Bse Ltd. Chart Analysis. Update
Bse 27th April 23
Long : 500
Sl : 450
Target : 620 / 800 / 1040 Mid-term Completed
Any brother who has bought this should hold for the target of 1685 lvl.
Enjoy !

BSE long side ,making a U pattern . Short term to LONG TERM
EXPECTING 1042 making a good cup kind of pattern , gave break out with good volumes

BSE Ltd.*BSE Ltd.*
C&H Formation on Weekly Basis
Strong Price BreakOut & Sustained.
Good to Go!!!
Strong Continued Volume BuiltUp
Trail SL with Upside.
Book Profit as per Risk Appetite.
Do Your Own Research as well.
Happy Investing 😇

BSE pullback or breakout?BSE weekly chart, price has reached the 700 zone for the third time. Was rejected twice from here in 2022. Successful breakout could eventually lead price to 950.
Don't rush in, buy only on pullbacks, retests after breakout.
Boost & follow for more.


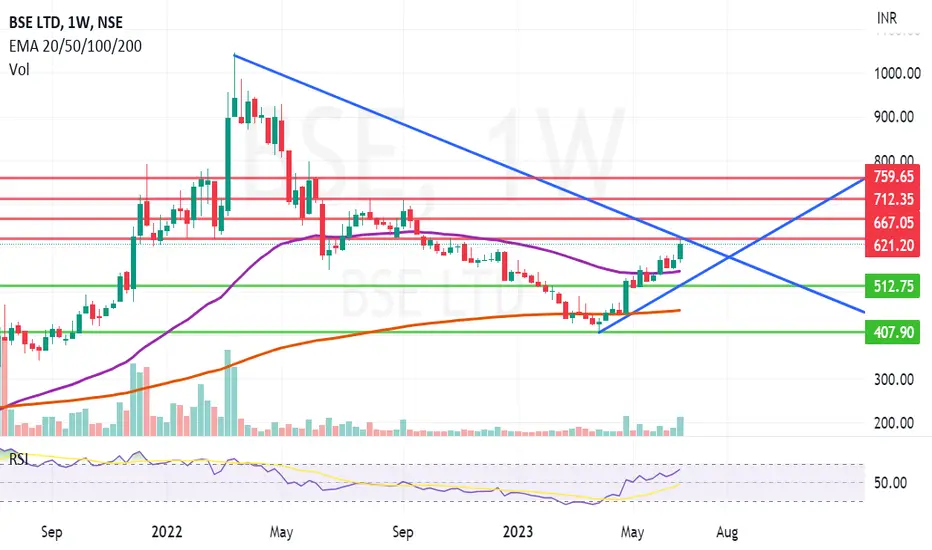
BSE is bouncing.BSE Ltd. is the Asia’s 1st and the one of the largest stock exchange in the world. The company provides efficient and transparent market for trading in equity, currencies, derivatives & Mutual funds. S&P BSE SENSEX is India’s most widely tracked stock benchmark index.
BSE CMP is 608.55. Negative aspects of the company are high valuation (P.E. = 37.4), declining annual net profits & FIIs are decreasing stake. Positive aspects of the company are improving cash from operations, no debt and zero promoter pledge.
Entry can be taken after closing above 622. Targets in the stock will be 667 & 712. Long term target in the stock will be 759. Stop loss in the stock should be maintained at closing below 540.