Amazing breakout on WEEKLY Timeframe - CHEMCONCheckout an amazing breakout happened in the stock in Weekly timeframe, macroscopically seen in Daily timeframe. Having a great favor that the stock might be bullish expecting a staggering returns of minimum 25% TGT. IMPORTANT BREAKOUT LEVELS ARE ALWAYS RESPECTED!
NOTE for learners: Place the breakout levels as per the chart shared and track it yourself to get amazed!!
#No complicated chart patterns
#No big big indicators
#No Excel sheet or number magics
TRADE IDEA: WAIT FOR THE STOCK TO BREAKOUT IN WEEKLY TIMEFRAME ABOVE THIS LEVEL.
Checkout an amazing breakout happened in the stock in Weekly timeframe.
Breakouts happening in longer timeframe is way more powerful than the breakouts seen in Daily timeframe. You can blindly invest once the weekly candle closes above the breakout line and stay invested forever. Also these stocks breakouts are lifelong predictions, it means technically these breakouts happen giving more returns in the longer runs. Hence, even when the scrip makes a loss of 10% / 20% / 30% / 50%, the stock will regain and turn around. Once they again enter the same breakout level, they will flyyyyyyyyyyyy like a ROCKET if held in the portfolio in the longer run.
Time makes money, GREEDY & EGO will not make money.
Also, magically these breakouts tend to prove that the companies turn around and fundamentally becoming strong. Also the magic happens when more diversification is done in various sectors under various scripts with equal money invested in each N500 scripts.
The real deal is when to purchase and where to purchase the stock. That is where Breakout study comes into play.
LET'S PUMP IN SOME MONEY AND REVOLUTIONIZE THE NATION'S ECONOMY!
Trade ideas

Cup & Handle Pattern Breakout in Chemcon Speciality ChemicalsCup & Handle Pattern Breakout in Chemcon Speciality Chemicals from neck line arround 250, Currently stock is trading above all important moving averages(20,50,100,200) & RSI also indicating positive momentum .Target of this breakout will be arround 340 Rs with a stoploss of 230 Rs .
IT'S not a buy or sell call ..For Education only

LONGMay break out from consolidation zone, next resistance at 330. In long run, if the fundamentals improves then 470 can be achieved. With good reserves. Overall Chem sector not performing well. So keep tight stop loss if corrects.


CHEMCON may break the upsideCHEMCON can double from here with in few years. Sl below the trend line.
Chart is self explanatory. Please follow the price action & take the trade as per your appetite.
The information provided here is only for educational purpose. The information provided here is not intended to be any kind of financial advice, investment advice, and trading advice. Investment in stock market is very risky and trading stocks, options and other securities involve risk. The risk of loss in stock market can be substantial. Moreover, I am not a SEBI registered analyst, so before taking any decision or before investing in any Share consult your financial advisor and also do your analysis and research.
Request your support and engagement by liking and commenting & follow to provide encouragement.

Chemchon📈 After a prolonged downturn, stock has shown a promising sign of reversal with a beautiful doji at the bottom. This candlestick pattern suggests a potential turnaround, supported by positive movement in our moving averages.
Based on my technical analysis, I foresee a rapid ascent towards 319 in the near future. 🚀 Stay tuned and keep a close watch as we ride this momentum together!"

CHEMCON Stock always take support on Trend line.
Good for swing Trade.
Disclaimer This is my personal view for education purpose only
No Buy sell recommendations.

Flag pattern in #Chemcon#Chemcon has formed flag pattern in 1 hour timeframe.
Disclaimer : This analysis is purely for educational purpose and does not contain any recommendation. Please consult your financial advisor before taking any financial decision.

CHEMCON Volumes in this counter suggest a trend reversal a early pick
Rise in last one month from 270 to 290
First short term target 330
Financial are not good

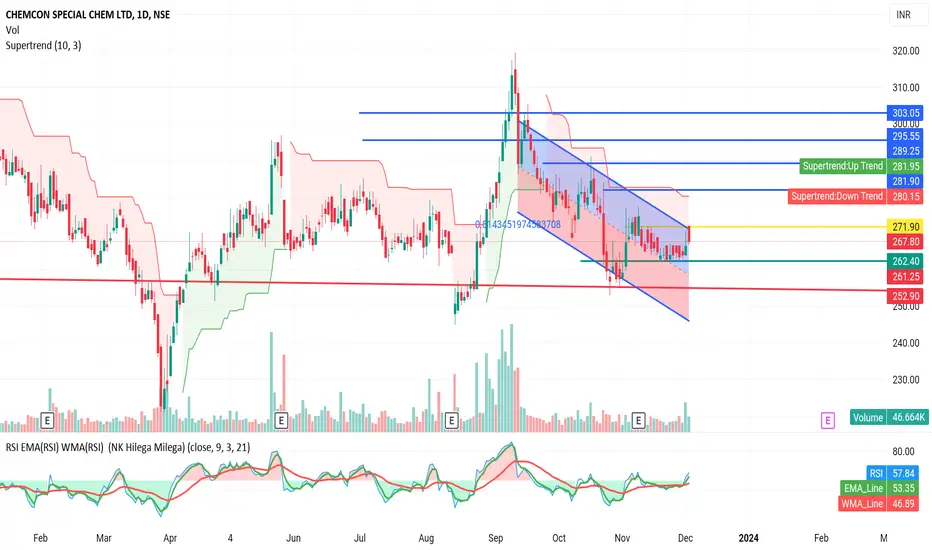
Chemcon Chemcon trade at important support at 250 to 275 range.
It will towards 480.
Important support and resistance on chart.

Chemcon special chemical ltdBuying AT 359 with SL 350
1. double bottom
2. 5 trading day stuck in range and made a base.
it should be reversal candidate.

CHEMCONGood entry oftter break out from falling trend line weekly and daily..good fundamentals as well

ChemCon Opportunity !hi
lets start buying in chunks !
too good time acc to me.
yes i m in !! at good price.


CHEMCON DAILY TIMEFRAMECHEMCON DAILY TIMEFRAME is taking support and ready for breakout of the black line can see little shakeout also till the lower black line acting as a long term support. But currently this support is showing good strength.


CHEMCON 15MINCHEMCON is making a double top pattern with a cup and handle pattern. Can give a breakout.

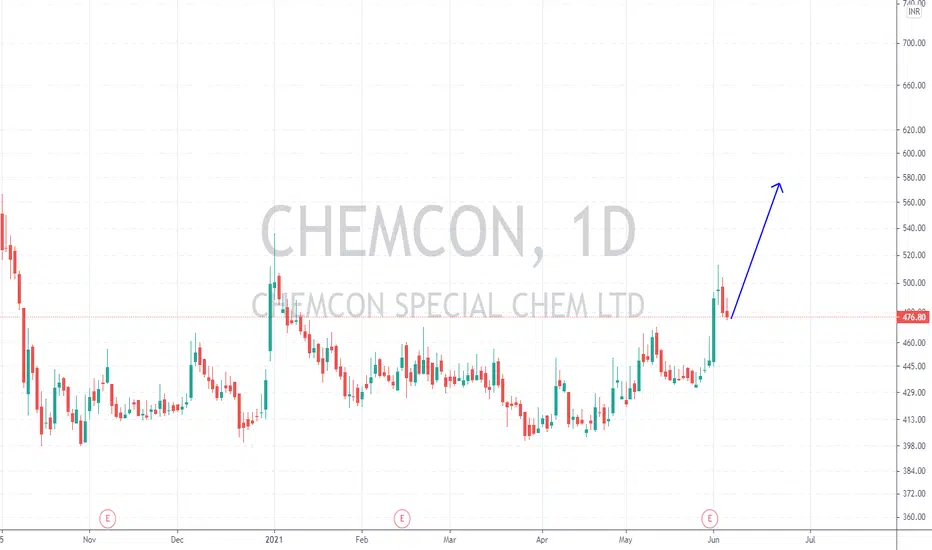
Chemcon - LongChemcon CMP - 476.80 *Positional Trade Setup*
Looking bullish in higher time frame. One can go for Short / Long Term Trade Setup with the following entry, exit & targets.
Buy Range at 465 - 475 / Stop Loss 444
Target 1 - 525
Target 1 - 550
Target 1 - 575
Disclaimer: This is my view and for educational purpose only.