CNXIT trade ideas


CNX IT Index - Knocking to break outIT Index / Nifty Ratio chart has been looking to knock to break out an important resistance. Breaking free will have more legs to IT Index.
DISC: Not a SEBI Registered. I post charts for my own study.

Nifty IT. Bullish Structure.Looks like the smart Money has managed to trap IT bears. Possible upside can be witnessed in the IT stocks in the coming few trading sessions.

Back to uptrend ?It seems NIFTY IT has completed consolidation and back to uptrend. Let's see how it goes..


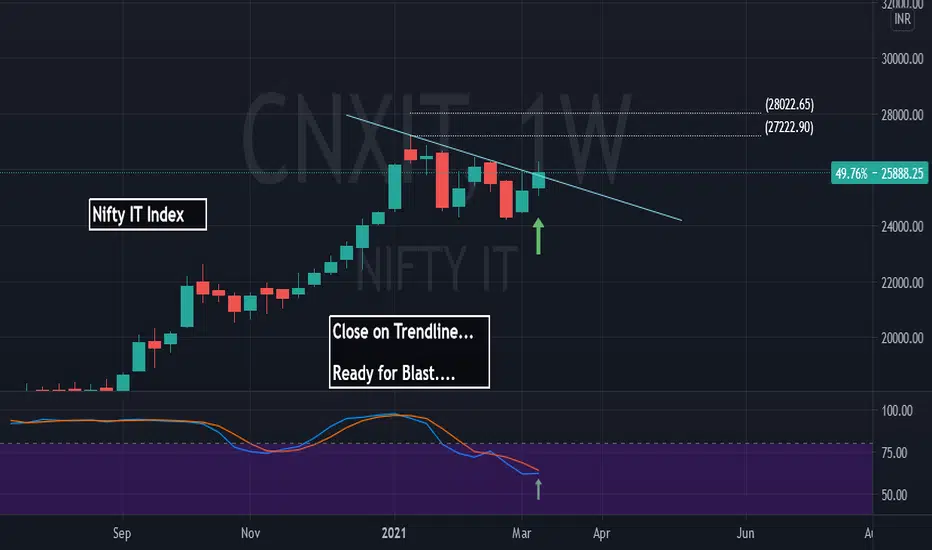
Nifty It Index will it blast ???On the verge of Blast....
Closed right on weekly trend line..
Watch out for many opportunities....
US Economy will do good this year...
Apne IT Majors ki Chandi hi Chandi.....
Nifty IT ViewsNifty IT is dipping down in support zone which I feel is an important support zone. Watch out if support holds.
These are my personal views, not by any means trading idea or investment decision.

IT STOCKS - Start of another leg of bull rally? - ANALYSISThe analysis is done purely based on chart patterns and price action.
The analysis is done on 15 min TF, but the target as shown in charts can take couple of days upto weeks.
As can be seen from NITFY IT chart as well as from charts of stocks linked below, price went for retracement phase, made a low on 21st December 2020 and then gave breakout from trendline.
Thereafter the price gave good breakout and came down to retest the levels.
This can be a signal another leg of bull rally.
Targets are determined with the help of Trend-Based Fib extension tool.
Traders must check for signals of reversal before entering into any trade.
This analysis is just for study purpose and to show beginners how to analyse a sector and its stocks.
This is not a trade recommendation. Traders must trade with their own risk and money management.
TCS chart analysis-
INFY Chart analysis -
WIPRO chart analysis -
HCLTECH chart analysis -
Feel free to comment for any suggestion or query regarding price action or chart analysis.


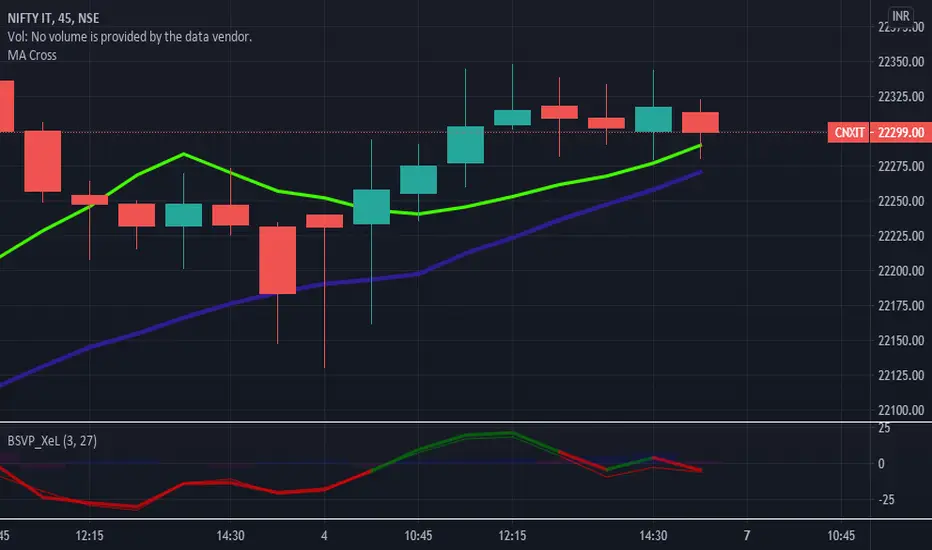
Nifty it index viewNifty it index given upside break out after a correction.
Many stocks like Tcs, Mindtree, Infy, Techm and other stocks also given break out or ready to break out. Buy on dip simple.

CNXIT - ShortRemains buy on euphoria, regret in leisure. While bears have not had any better day, bulls are not happy either save certain individual gems. Technically 21700 is the support that should ideally be attacked and taken. So sell here stop 22150 for break of 21900 taking it to 21700. Break 21700 invites deeper correction.

CNXIT - SELL IT ON RISE. Despite the triangular break out the upside thrust is not encouraging. Support around 21600 is vital and crucial for bulls to survive while bears looking threatened above 22000. Suggest to sell rallies or the break with 1% stop for 2% gain.


NIFTYIT#NIFTYIT broke the triangle, however the up-thrust is so far failed one. Subsequent fall prints an evening star pattern. The momentum is not suggestive of strong up-move while the DX line is neutral at best. Move past 22000 is needed for bulls to re-capture. A break below 21000 bring bears into reckoning. Trade from short with stop 22115 (not able to suggest a lower one) for 21000 break.

IT INDEXNow its time for IT sector so keep eyes on TCS, INFY, COFORGE, MINDTREE, TATA ELXSI, WIPRO, LTI & CYIENT !!

NIFTYITWith broad sectorial rotation, IT joins Pharma and FMCG for softer bias. Price action is near the minor trend line and break there targets the LBB. Further break below LBB 20500 would propel the bear case. RR with 0.5% stop and 1% gain is favoured. Stay short.

Nifty ITAfter forming daily resistance now approaching a support zone on daily. If this support zone is not respected then we will have to go for weekly support zone.


