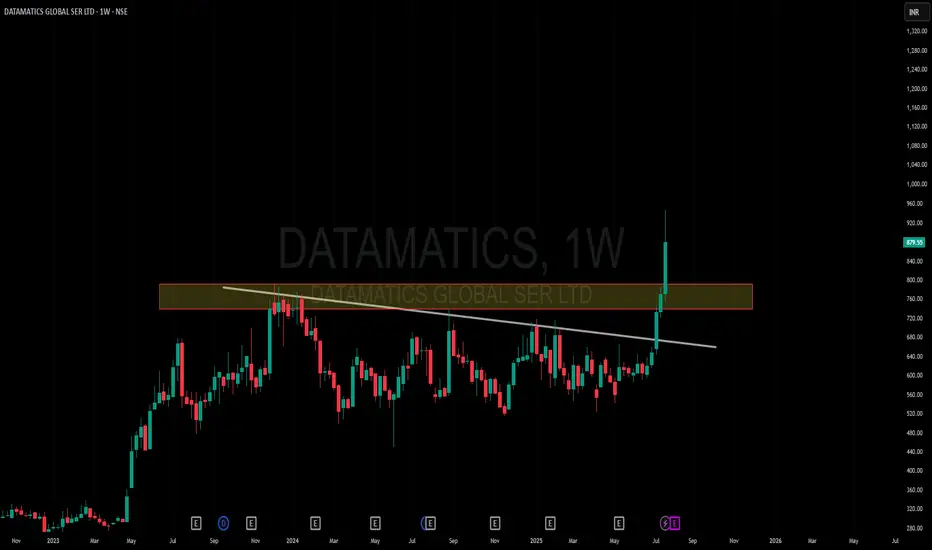
Amazing breakout on WEEKLY Timeframe - DATAMATICSCheckout an amazing breakout happened in the stock in Weekly timeframe, macroscopically seen in Daily timeframe. Having a great favor that the stock might be bullish expecting a staggering returns of minimum 25% TGT. IMPORTANT BREAKOUT LEVELS ARE ALWAYS RESPECTED!
NOTE for learners: Place the breakout levels as per the chart shared and track it yourself to get amazed!!
#No complicated chart patterns
#No big big indicators
#No Excel sheet or number magics
TRADE IDEA: WAIT FOR THE STOCK TO BREAKOUT IN WEEKLY TIMEFRAME ABOVE THIS LEVEL.
Checkout an amazing breakout happened in the stock in Weekly timeframe.
Breakouts happening in longer timeframe is way more powerful than the breakouts seen in Daily timeframe. You can blindly invest once the weekly candle closes above the breakout line and stay invested forever. Also these stocks breakouts are lifelong predictions, it means technically these breakouts happen giving more returns in the longer runs. Hence, even when the scrip makes a loss of 10% / 20% / 30% / 50%, the stock will regain and turn around. Once they again enter the same breakout level, they will flyyyyyyyyyyyy like a ROCKET if held in the portfolio in the longer run.
Time makes money, GREEDY & EGO will not make money.
Also, magically these breakouts tend to prove that the companies turn around and fundamentally becoming strong. Also the magic happens when more diversification is done in various sectors under various scripts with equal money invested in each N500 scripts.
The real deal is when to purchase and where to purchase the stock. That is where Breakout study comes into play.
Check this stock which has made an all time low and high chances that it makes a "V" shaped recovery.
> Taking support at last years support or breakout level
> High chances that it reverses from this point.
> Volume dried up badly in last few months / days.
> Very high suspicion based analysis and not based on chart patterns / candle patterns deeply.
> VALUABLE STOCK AVAILABLE AT A DISCOUNTED PRICE
> OPPURTUNITY TO ACCUMULATE ADEQUATE QUANTITY
> MARKET AFTER A CORRECTION / PANIC FALL TO MAKE GOOD INVESTMENT
DISCLAIMER : This is just for educational purpose. This type of analysis is equivalent to catching a falling knife. If you are a warrior, you throw all the knives back else you will be sorrow if it hits SL. Make sure to do your analysis well. This type of analysis only suits high risks investor and whose is willing to throw all the knives above irrespective of any sectoral rotation. BE VERY CAUTIOUS AS IT IS EXTREME BOTTOM FISHING.
HOWEVER, THIS IS HOW MULTIBAGGERS ARE CAUGHT !
STOCK IS AT RIGHT PE / RIGHT EVALUATION / MORE ROAD TO GROW / CORRECTED IV / EXCELLENT BOOKS / USING MARKET CRASH AS AN OPPURTUNITY / EPS AT SKY.
LET'S PUMP IN SOME MONEY AND REVOLUTIONIZE THE NATION'S ECONOMY!
DATAMATICS trade ideas
DATAMATICS GLOBAL - MOMENTUM BUYNSE:DATAMATICS Weekly classic momentum formation will continue price like fast to furious in short term.
A Real Multi Bagger From NSE $NSE:DATAMATICS NSE:DATAMATICS
hi
i Found Some Surprising Signs, that is telling me its a bagger.
Wait for some year !
it is on road to be a multibagger.
thanks

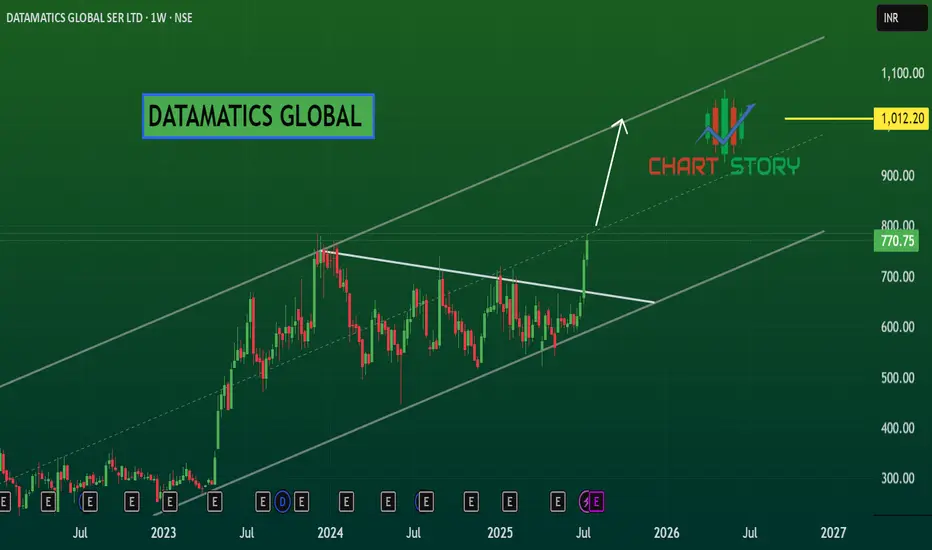
DATAMATICS 34% UP?Entry @CMP with accumulation @530-40(fib) more entry @600(fib) after breakout
pullback up average at 673
Target @792 Fib level sell all.

Datamatics - LongNSE:DATAMATICS Weekly parabolic move possible....with macd and buyers at our location. Momentum is ready to set for good upmoves from here.

DATAMATICS Breakout coming soonDatamatics looks great at this levels For Target 692/720
Short Term 780 can also hit with good volumes

Datamatics Soars Amidst Global Uncertainty - A Tech TitanSubheading: How this Indian IT powerhouse is leveraging AI and digital transformation to drive unparalleled growth
In a world grappling with economic headwinds and technological disruption, one company has emerged as a shining beacon of resilience and innovation - Datamatics Global Services Limited. This Indian IT services and solutions provider has not only weathered the storm but has also managed to scale unprecedented heights, leaving its competitors in the dust.
The secret to Datamatics' success? A relentless focus on embracing the transformative power of Artificial Intelligence (AI) and digital transformation. As the report reveals, the company has made strategic investments in cutting-edge technologies, from intelligent automation and cloud computing to data analytics and AI-powered solutions. This forward-thinking approach has not only boosted its own productivity and efficiency but has also enabled it to deliver unparalleled value to its clients across diverse industries.
The numbers speak for themselves. Datamatics' consolidated revenue grew by a staggering 21.5% year-on-year, while its standalone revenue soared by an impressive 26.8%. But it's not just the top line that's impressive - the company's profitability is equally remarkable, with a consolidated EBITDA margin of 15.7% and an EBIT margin of 13.4%.
What's even more impressive is Datamatics' ability to maintain a healthy balance sheet, with zero debt and a robust cash position. This financial stability, coupled with its impressive return ratios (ROCE of 21.4% and ROE of 20%), underscores the company's ability to create long-term value for its shareholders.
But Datamatics' success isn't just about the numbers. It's also about its unwavering commitment to innovation and customer-centricity. The report highlights the company's investments in developing its own IP solutions, such as the Intelligent Automation Platform, which combines the power of RPA, IDP, and AI/ML to drive process excellence and enhance customer experiences.
As the world grapples with the challenges of the post-pandemic era, Datamatics' ability to adapt and thrive sets it apart. The company's focus on digital transformation, coupled with its deep expertise in emerging technologies, positions it as a true industry leader - one that is poised to capitalize on the growing demand for intelligent, data-driven solutions.
In a world where change is the only constant, Datamatics stands tall as a shining example of how a technology-driven mindset, coupled with strategic vision and execution, can propel a company to new heights of success. For investors and industry watchers alike, this is a story worth following closely - a testament to the power of innovation, resilience, and the relentless pursuit of excellence.

DATAMATICS SWING TRADE IDEADATAMATICS after strong upside move created cup and handle chart pattern according to this chart pattern we can plan to play for upside rally once it gives breakout of its neck line, in this scenario datamatics gave cup and handle chart pattern neck line breakout with strong bullish candle and volume. can play for swing by considering 1:2:3 R/R.


Strong breakout on DATAMATICSA sequence of consolidation patterns in a stock may imply that it is preparing for a noteworthy movement, and if it is trading above important moving averages, it may indicate a robust bullish trend. Furthermore, breaking through the recent all-time high level is a distinct indication of the stock's upward momentum.

DATAMATICS Strong MomentumCMP 346.25
FII / FPI or Institutions increasing their shareholding
Near 52 Week High | Increasing Revenue every Quarter for the past 4 Quarters
Increasing profits every quarter for the past 2 quarters
*Not recommendation. Do your due diligence
👉All updates/posts are only for education and learning purpose and are personal views
👉 Always Consult your financial advisor before taking trades or investment decisions

for swing it looks 20th june week candle holds a bunch of buy orders, looks positive in that area if we get a good wick or a reversal candle we can go for a swing & exit before 400 (i have seen a lot of stocks which reversed before hitting a round figure and stays low for some times).

Data Matics Consolidation : BO Soon StockDatamatics Global Services Ltd is a global provider of Information Technology (IT), Business Process Management (BPM) and Consulting services. The Company provides business aligned next-generation solutions to a wide range of industry verticals that help enterprises across the world overcome their business challenges and achieve operational efficiencies

Above 372 Bullish BreakoutBullish above 372 as 1 day close above
Target 400, 438++
SL: 350
Risk is yours and Reward is too yours totally
Time Frame : 3 Months
Logic Rectangle Pattern breakout and Rising channel


DatamaticsPrice at all time high/ Multi year resistance
Very interesting to see how it reacts after hitting 19%+ today.
ONLY OBSERVING


datamaticsDatamatics provides intelligent solutions for data-driven businesses to increase productivity and enhance the customer experience. With a completely digital approach, Datamatics portfolio spans across Information Technology Services, Business Process Management, Engineering Services and Big Data & Analytics all powered by Artificial Intelligence. The company has a diversified revenue base with a presence across sectors such as banking, financial services and insurance (BFSI), publishing, manufacturing, hospitality, and international organisation, among others.

Datamatics Range breakoutBuy above the rectangle - todays High
Target
Stop
mentioned on the chart
The stock has made a breakout from the recent range with volume to support the same.
Simple Price , Neararest Target and Nearest Support based trade

Rising Wedge PatternCan fall off theoretically as resistance is more. I have just identified the pattern, use your knowledge to build on top of it and trade accordingly.
Any other idea is welcome.

Buy DATAMATICS AT 105 AND IN DIPS TILL 96 SL 89 TGT 140 - 155Buy DATAMATICS AT 105 AND IN DIPS TILL 96 SL 89 TGT 140 - 155 (SL ON CLOSING BASIS)

DATAMETRICS GLOBAL CMP 115I like the chart and last week movement in the stock. Gave breakout on charts and ready to give more returns in very less time. It can be accumulate on dips for higher gains. I will wait for little correction to enter into stock as the risk reward ratio is high.
Target: 200
Time Frame: 3 Months
Entry Range: 100-105
Stop loss: 90
