Godrejcp: New Peaceful Strategy....Details of the screener + Process is updated here..
www.tradingview.com
Market insights

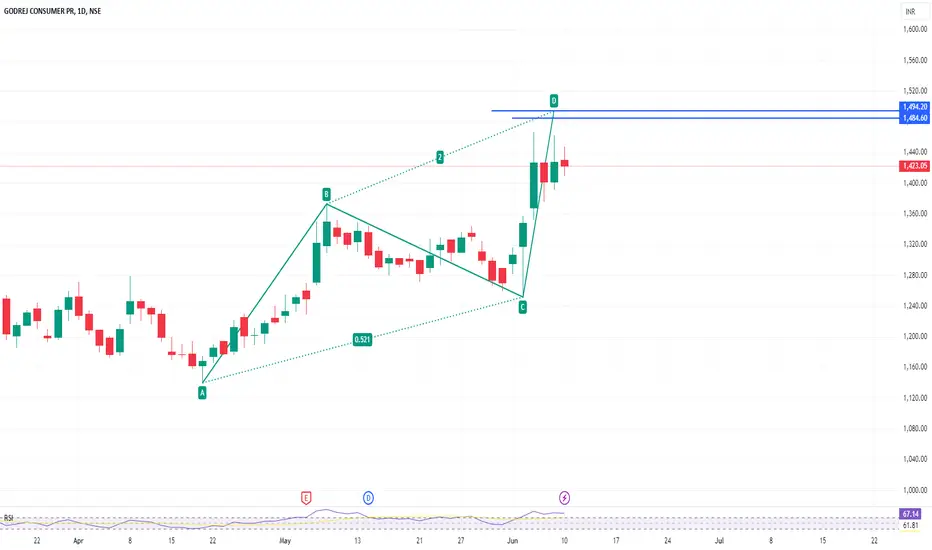
Godrej Consumer Products UptrendGodrej consumer products may show Uptrend from here.
CMP : 1375
Target: 1450+

sell at zone ~ intradayexpecting small fall from the zone . look for confirmation inside zone in smaller tf.
- good for intraday trade
- entry is strictly inside the zone
- SL is day close above zone
- for target draw fib retracement from C to latest swing high , use 0.236 fib as tgt 1 (safe place for intraday), 0.382 as tgt 2 (risk takers).
- don't trade , if u didn't get selling confirmation inside zone
- if day close is above this zone , this pattern becomes invalid , ignore this pick
Godrejcp Intraday level for todayGodrejcp Intraday level for today #GODREJCP
Buying opportunity above 1435
Stop Loss area 1420
Charts for Educational purposes only.
Please follow strict stop loss and risk reward if you follow the level.
Thanks,
V Trade Point

GODREJCP Intraday level for today #GODREJCP GODREJCP Intraday level for today #GODREJCP
Buying opportunity above 1354
Stop Loss area 1340
Charts for Educational purposes only.
Please follow strict stop loss and risk reward if you follow the level.
Thanks,
V Trade Point

Consumer Durables timeThe consumer Durable Index is showing an upward trend, and one of the shares in this index is GODREJCP. Those looking for returns before the election results can consider this stock with a supported stop loss.

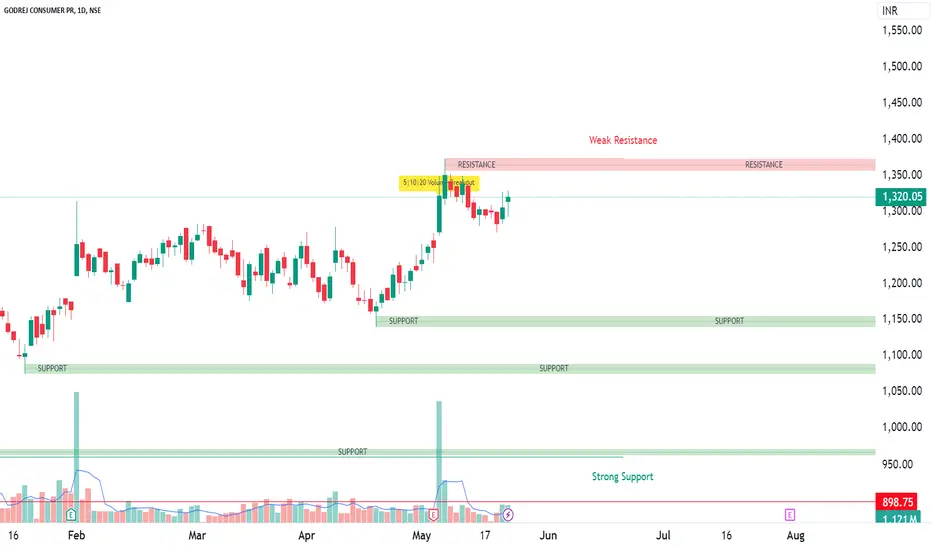
GODREJCP (Godrej Consumer Products Limited) - Swing tradeClosing Price: ₹1,320.05
Change %: 1.1%
Volume: 1,121,198
High: ₹1,329
Godrej Consumer Products saw a 1.1% rise with a relatively lower volume compared to the others. However, closing near its high suggests positive momentum. Given its strong brand presence and stable growth in the consumer goods sector, GODREJCP could continue to perform well in the short term.
Kindly conduct thorough analysis and consider market conditions before making any trading decisions.
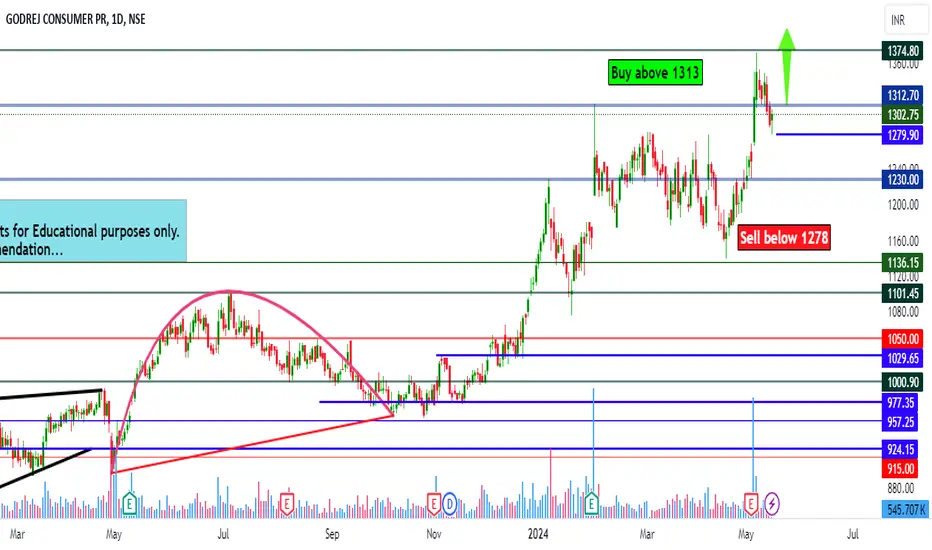
Godrejcp view for tomorrow 17th MayGodrejcp view for tomorrow 17th May
Buying opportunity only above if sustain above 1313
Selling chance below 1393
Charts for Educational purposes only. Not a Trading Recommendation
Strictly follow Risk Reward and Stop Loss
Thanks,
V Trade Point
Consumers are accumulating !Some Support and Resistance Zone you can find in chart,
Trying to explain real example
1 Candlestick
Bullish engulfing
Inside Bar
2 Support
3 Resistance
4 Consolidation
5 Expectation
Gratify if you appreciate the practice then you can like it, share it and
If you want me to investigate any chart for you then would cherish doing that for you.
Thank you for your time and support.
Stay safe.

My view on GodrejcpGodrejcp forming inverse head and shoulder pattern on small time frame.
Looking good above 1194 for tgt 1200-1205-1210++
Keeping on radar Godrejcp 1200 CE (next contact)

Reversal Descending Triangle pattern in GODREJCPGODREJ CONSUMER PRODUCTS LTD
Key highlights: 💡⚡
📈 On 1 Day Time Frame Stock Showing Reversal of Descending Triangle Pattern.
📈 It can give movement upto the Reversal Final target of Above 1251+.
📈 There have chances of breakout of Resistance level too.
📈 After breakout of Resistance level this stock can gives strong upside rally upto Above 1370+.
📈 Can Go Long in this stock by placing a stop loss Below 1150-.

entry level 780 -825entry level 780 -825 or enter above 900 stoploss 768 target 898 ------954 ----- 982 -----------1021

Gorecj consumer break or make trendlinetoday godrej industry got 20% upside
consumer holds 23% in inustry
showing break or make trendline
watch for tomorrow level (bulllish on card )
Market Sentiment Shifts: GODREJCP Faces Potential Sharp SelloffThe initial wave of the third sequence has concluded, priming for a directional move towards the third wave post an ABC correction. Monitor the ABC pattern closely before considering initiating a short position on GODREJCP.

GODREJCP ready for upside againbreakout at 1085 retest done at 61% retracement level can resume upside
cmp 1131
sl 1045
target 1271
add more above 1145

Godrej Consumer Products, a good buyGodrejCP is making an inverse head and shoulder at 30 min
It has retested the weekly resistance level which may act as a support now.
On daily timeframe, it has made a doji on 50 EMA support, which also shows reversal
Apart from that it is happening on FIB golden zone
A very high quality trade indeed

About to break in weekly Monitor this.... If it's closed above the neckline with good bullish candle with some good volume, it's really good to buy and hold for some months. It's only my view not a recommendation.

GODREJ CONS PR (WEEKLY)A nice cup and handle pattern BO after a long consolidation.
Volume also building nicely at Bo.

Big Upmove possible in Godrej ConsumerBounced back from support, about to give Cup & Handle pattern breakout.

Godrej consumer beautiful cup and handle weekly breakout Godrej consumer beautiful cup and handle weekly breakout with huge spurt in volumes buy above 1102 for swing target of 1140,1182 and 1210.

Godrej Consumer Products
Looking very good in almost all the major tf with more volumes coming in
Broke out of gann levels with a big gapup on daily
Target 1 - 1100( intact as the golden Crossover nearing)
SL - below 1020
Good RR


GODREJCP
NSE:GODREJCP
One Can Enter Now !
Or Wait for Retest of the Trendline (BO) !
Or wait For better R:R ratio !
Note :
1.One Can Go long with a Strict SL below the Trendline or Swing Low.
2. R:R ratio should be 1 :2 minimum
3. Plan as per your RISK appetite and Money Management.
Disclaimer : You are responsible for your Profits and loss, Shared for Educational purpose
