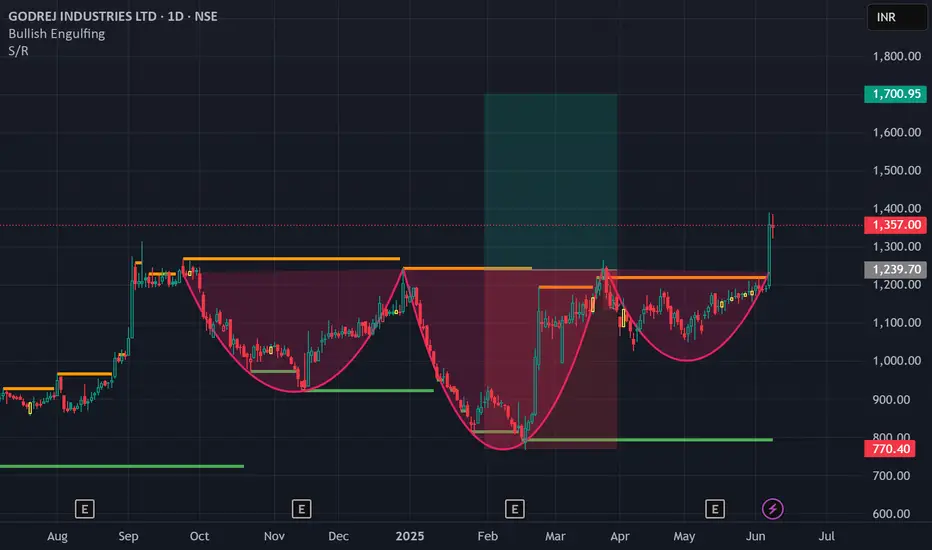
GODREJ INDUSTRIES LTD S/RSupport and Resistance Levels:
Support Levels: These are price points (green line/shade) where a downward trend may be halted due to a concentration of buying interest. Imagine them as a safety net where buyers step in, preventing further decline.
Resistance Levels: Conversely, resistance levels (re
Godrej Industries Limited
No trades
28.60 INR
9.81 B INR
195.36 B INR
28.08 M
About Godrej Industries Limited
Sector
Industry
CEO
Nadir Burjorji Godrej
Website
Headquarters
Mumbai
Founded
1897
Identifiers
2
ISIN:INE233A01035
Godrej Industries Ltd. is a holding company, which engages in the business of consumer goods, real estate, agriculture, and gourmet retail through its subsidiary and associate companies. It operates through the following business segments: Chemicals, Animal Feed, Veg Oils, Estate and Property Development, Finance and Investments, Dairy, Crop Protection, and Others. The Chemicals segment produces and sells oleo chemicals and surfactants. The Animal Feed segment includes the business of production and sale of compound feed for cattle, poultry, shrimp and fish. The Veg Oils segment handles the processing and bulk trading of refined vegetable oils and vanaspati; international vegetable oil trading; and oil palm plantation. The Estate and Property Development segment includes the business of development and sale of real estate and leasing and leave and licensing of properties. The Finance and Investments segment consists of investments in associated companies. The Dairy segment offers milk and milk products. The Crop Protection segment includes agri inputs. The Others segment includes integrated poultry and tissue culture, seeds business, energy generation through windmills, and gourmet foods and fine beverages. The company was founded by Ardeshir Godrej in 1897 and is headquartered in Mumbai, India.
Related stocks

GODREJ Industries Ready to Blast !! Short to Long term GODREJ Inndustries-----DAILY counts indicate Excellent bullish wave structure.
Both appear to be optimistic and this stock invalidation number wave 2 low
target short / long term are already shared as per charts
correction wave leg seems completed
Investing in declines is a smart move for short/

Godrej Industries Formed H&E PatternNSE:GODREJIND has formed Inverse Head and Shoulder Pattern. We could Target for 1700.
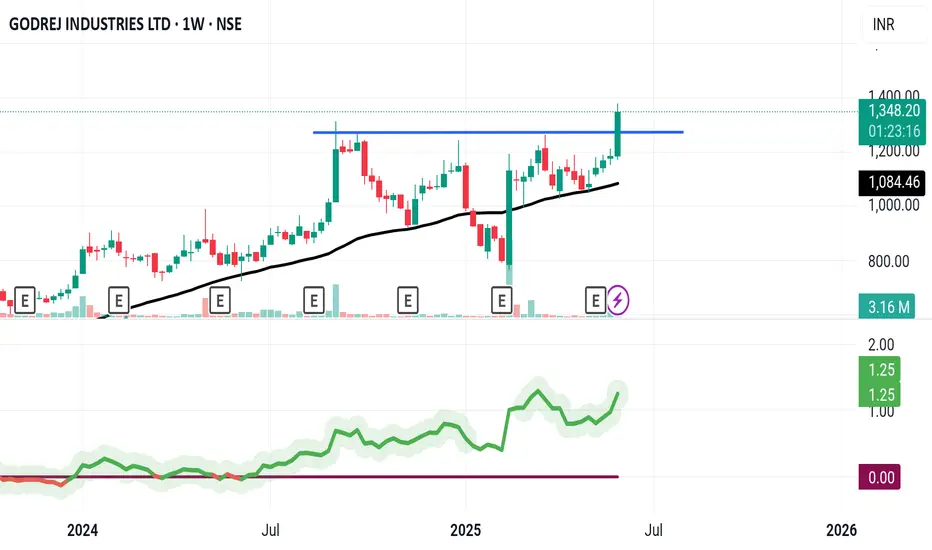
Godrej Industries Ltd Weekly Trend AnalysisGodrej Industries Ltd has broken out to a new all-time high, closing at 1359.50. The stock indicates a potential uptrend with likely targets at 1480 and 1717.
Traders are advised to carry out their own technical analysis before making any trading decisions.

GODREJ INDUSTRIES LTDBreakout happend in this stock with rising 200dma and RS indicator is also showing strength.
Keep your risk and reward ratios according to your own preferance.
This is for educational purpose, do your own research before investing.
Can Break the Supply Zone...?Godrej Industries limited face a heavy supply zone, If its break this time then its on all time high in BLUE SKY ZONE, and its next resistence is 1200-1300...

A trendline breakout monthly TFA trendline breakout of monthly TF.....sl closing below 909......Target 1772......buying zone 1038-1058.....Only for educational purpose and not any recommendation......I am not sebi registered Research analyst......

GODREJ INDUSTRIES LTD S/RSupport and Resistance Levels:
Support Levels: These are price points (green line/shade) where a downward trend may be halted due to a concentration of buying interest. Imagine them as a safety net where buyers step in, preventing further decline.
Resistance Levels: Conversely, resistance levels (re

Darvas Box Strategy -Breakout StockDisclaimer: I am Not SEBI Register adviser, please take advise from your financial adviser before investing in any stocks.
Stock has given break out buy above the High and do not forget to keep stop loss best suitable for swing trading.
Stop loss and Target Shown on the Chart T1 & T2.
Be Discipli

Swing Trade - GODREJIND📊 Script: GODREJIND
📊 Sector: Chemicals
📊 Industry: Chemicals
Key highlights: 💡⚡
📈 Script is trading at upper band of BB.
📈 MACD is giving crossover .
📈 Double Moving Averages are giving crossover.
📈 Right now RSI is around 64.
📈 One can go for Swing Trade.
⏱️ C.M.P 📑💰- 941
🟢 Target 🎯🏆 - 1000
⚠

See all ideas
Summarizing what the indicators are suggesting.
Oscillators
Neutral
SellBuy
Strong sellStrong buy
Strong sellSellNeutralBuyStrong buy
Oscillators
Neutral
SellBuy
Strong sellStrong buy
Strong sellSellNeutralBuyStrong buy
Summary
Neutral
SellBuy
Strong sellStrong buy
Strong sellSellNeutralBuyStrong buy
Summary
Neutral
SellBuy
Strong sellStrong buy
Strong sellSellNeutralBuyStrong buy
Summary
Neutral
SellBuy
Strong sellStrong buy
Strong sellSellNeutralBuyStrong buy
Moving Averages
Neutral
SellBuy
Strong sellStrong buy
Strong sellSellNeutralBuyStrong buy
Moving Averages
Neutral
SellBuy
Strong sellStrong buy
Strong sellSellNeutralBuyStrong buy
Displays a symbol's price movements over previous years to identify recurring trends.
MIDCAPETF
Mirae Asset Nifty Midcap 150 ETF Exchange Traded Fund UnitsWeight
0.12%
Market value
177.22 K
USD
FLQA.USD
Franklin FTSE Asia ex China ex Japan UCITS ETF Accum Shs USDWeight
0.01%
Market value
48.98 K
USD
Explore more ETFs
Frequently Asked Questions
The current price of GODREJIND is 1,016.60 INR — it has increased by 0.49% in the past 24 hours. Watch Godrej Industries Limited stock price performance more closely on the chart.
Depending on the exchange, the stock ticker may vary. For instance, on NSE exchange Godrej Industries Limited stocks are traded under the ticker GODREJIND.
GODREJIND stock has risen by 1.28% compared to the previous week, the month change is a −3.97% fall, over the last year Godrej Industries Limited has showed a −8.00% decrease.
GODREJIND reached its all-time high on Jun 6, 2025 with the price of 1,390.00 INR, and its all-time low was 2.20 INR and was reached on Apr 15, 2003. View more price dynamics on GODREJIND chart.
See other stocks reaching their highest and lowest prices.
See other stocks reaching their highest and lowest prices.
GODREJIND stock is 1.77% volatile and has beta coefficient of 0.55. Track Godrej Industries Limited stock price on the chart and check out the list of the most volatile stocks — is Godrej Industries Limited there?
Today Godrej Industries Limited has the market capitalization of 341.10 B, it has increased by 2.20% over the last week.
Yes, you can track Godrej Industries Limited financials in yearly and quarterly reports right on TradingView.
GODREJIND net income for the last quarter is 2.42 B INR, while the quarter before that showed 3.49 B INR of net income which accounts for −30.57% change. Track more Godrej Industries Limited financial stats to get the full picture.
Godrej Industries Limited dividend yield was 0.00% in 2024, and payout ratio reached 0.00%. The year before the numbers were 0.00% and 0.00% correspondingly. See high-dividend stocks and find more opportunities for your portfolio.
As of Dec 13, 2025, the company has 1.15 K employees. See our rating of the largest employees — is Godrej Industries Limited on this list?
EBITDA measures a company's operating performance, its growth signifies an improvement in the efficiency of a company. Godrej Industries Limited EBITDA is 17.21 B INR, and current EBITDA margin is 19.56%. See more stats in Godrej Industries Limited financial statements.
Like other stocks, GODREJIND shares are traded on stock exchanges, e.g. Nasdaq, Nyse, Euronext, and the easiest way to buy them is through an online stock broker. To do this, you need to open an account and follow a broker's procedures, then start trading. You can trade Godrej Industries Limited stock right from TradingView charts — choose your broker and connect to your account.
Investing in stocks requires a comprehensive research: you should carefully study all the available data, e.g. company's financials, related news, and its technical analysis. So Godrej Industries Limited technincal analysis shows the sell today, and its 1 week rating is neutral. Since market conditions are prone to changes, it's worth looking a bit further into the future — according to the 1 month rating Godrej Industries Limited stock shows the neutral signal. See more of Godrej Industries Limited technicals for a more comprehensive analysis.
If you're still not sure, try looking for inspiration in our curated watchlists.
If you're still not sure, try looking for inspiration in our curated watchlists.