HAL buy HAL has completed the correction..good to buy at 4265 for the target of 5000.. Stop loss 4000 levels.
Market insights

HOW TO WATCHLIST ADVANCED VIEW IN TRADINGVIEWHOW TO OPEN ADVANCED VIEW IN TRADINGVIEW
**AND WHAT FEATURES IT PROVIDES**
✅ HOW TO OPEN ADVANCED VIEW IN TRADINGVIEW
Follow these steps:
1️⃣ Open the Watchlist Panel
➣ On the right side of the Trading-View interface, find the Watchlist panel.
➣ If it is hidden, click the small arrow on the right edge to reveal it.
2️⃣ Find the Layout Icons at the Bottom
➣ At the bottom of the watchlist, you will see multiple icons such as:
➣ List View
➣ Table View
➣ Advanced View (usually an expanded grid-style icon)
3️⃣ Click on “Advanced View”
➣ Click the Advanced View icon.
➣ Your watchlist will switch from the simple list to a more detailed, data-rich layout.
➣ That’s it — Advanced View is now active.
✅ FEATURES OF ADVANCED VIEW IN TRADINGVIEW
The Advanced View provides more detailed market information without needing to open charts.
Here are the key features:
1️⃣ Multiple Data Columns
➣ You can view several data points directly in the watchlist, such as:
➣ Last Price
➣ Price Change
➣ Change %
➣ Volume
➣ High / Low
➣ Bid / Ask
➣ Time / Session Data
➣ Fundamentals (if applicable)
This gives a snapshot of key market info in one place.
2️⃣ Add / Remove Columns
You can customize your watchlist:
➣ Click Add Column (+) to insert new data fields
➣ Click the three-dot menu (⋮) → Remove to delete any column
3️⃣ Reorder Columns
➣ Drag and drop column headers
➣ Arrange symbols in the order that works best for you
4️⃣ Sorting by Any Data
Click any column header to sort:
➣ One click → ascending
➣ Second click → descending
Useful for sorting:
➣ Highest volume
➣ Biggest % movers
➣ Highest price
➣ Top gainers / losers
5️⃣ Expandable Rows
(Some advanced layouts allow expanded detail per symbol.)
This helps you see:
➣ Additional stats
➣ Extended session data
➣ More fundamentals
6️⃣ Cleaner Multi-Symbol Comparison
Advanced View is ideal when watching:
➣ Indices
➣ Futures
➣ Forex pairs
➣ Commodities
➣ Multiple stocks at once
It becomes easier to compare signals and market movements.
7️⃣ Switch Back Anytime
To return to normal view:
➣ Click the List View icon at the bottom
➣ Watchlist returns to default layout
🎯 Summary
➣ Advanced View gives you a more powerful, professional watchlist layout
➣ Perfect for comparing multiple symbols quickly
➣ Provides more data in a structured table-style format
➣ Fully customizable with columns, sorting & layout tools

HOW TO WATCHLIST TABLE-VIEW VOLUME & EXTENDED HOURSComplete Process: HOW TO WATCHLIST TABLE-VIEW VOLUME & EXTENDED HOURS
1️⃣ Open the Watchlist Panel
➺ The Watchlist panel is located on the right side of the Trading-View interface.
➺ If it is hidden, click the small arrow on the right edge to open it.
2️⃣ Locate the Table-View Tool
➺ At the top of the watchlist panel, you will see three dot icon.
➺ This icon opens the table-view tool inside the watchlist.
3️⃣ Open the Table-View
Step-by-step:
➺ Click the table icon at the bottom of the watchlist.
➺ The watchlist will switch from the normal list-view to the table-view layout.
4️⃣ Understanding the Table-View Layout
The table-view displays additional columns and organized data in a tabular format.
Typical columns include:
⤷ Symbol
⤷ Last Price
⤷ Change (%)
⤷ Volume
⤷ High / Low
⤷ Session Data
⤷ Custom fields (depending on settings)
The table-view allows users to compare multiple symbols more clearly.
5️⃣ How to Add Columns in Table-View
Step-by-step:
➺ Hover on the column header area.
➺ Click the plus (+) icon or “Add Column” option.
➺ Choose the data you want to add:
⤷ Price
⤷ Change
⤷ Bid / Ask
⤷ Volume
⤷ Open Interest
⤷ Fundamentals (if supported)
⤷ Other available fields
The selected column will appear immediately.
6️⃣ How to Remove Columns
Step-by-step:
➺ Hover over the column header you want to remove.
➺ Click the three-dot menu (⋮) on that column.
➺ Select “Remove Column”.
➺ The column will be removed from the table.
7️⃣ How to Reorder Columns
Step-by-step:
➺ Click and hold the column header.
➺ Drag it left or right.
➺ Release to place it in the new position.
This helps personalize the table layout.
8️⃣ Sorting Symbols in Table-View
Step-by-step:
➺ Click any column name (for example: Price, Change %, Volume).
➺ Clicking once sorts the column ascending.
➺ Clicking again sorts descending.
➺ A small arrow appears showing the sort direction.
9️⃣ Switch Back to Normal Watchlist View
Step-by-step:
➺ Click the same table icon at the bottom again.
➺ The watchlist returns to the default list-view.
🎯 Short Summary (Optional for Captions)
⤷ Open Table-View → Bottom table icon
⤷ Add Columns → Add Column option
⤷ Remove Columns → Three-dot menu → Remove
⤷ Reorder → Drag column headers
⤷ Sort → Click column name
⤷ Return to List → Click table icon again

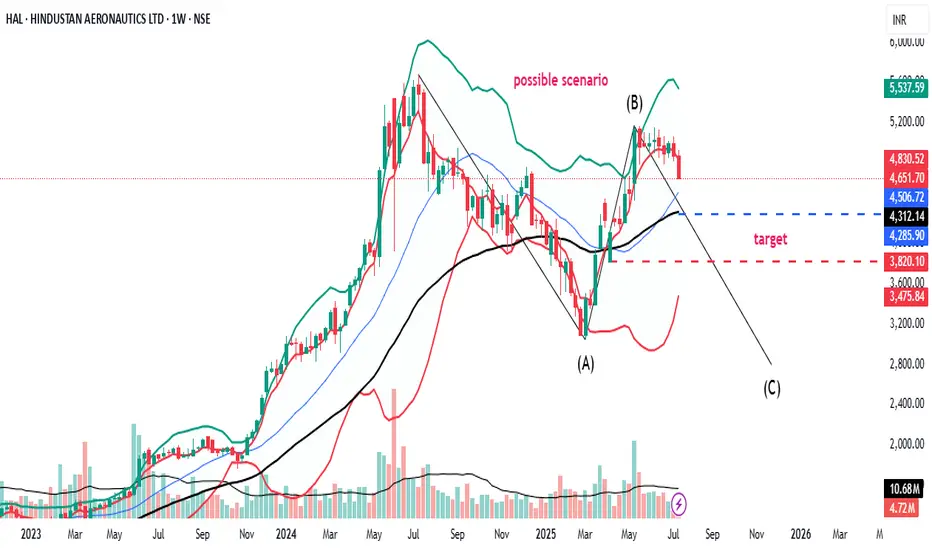
HAL can fall till 1400, plausible fall till 3700.Based on wave analysis and ABC correction and fundamentals view (Tejas crash, hostile environment by adversaries), it can fall till 3700 and if it breaks down then possibly till 1400.

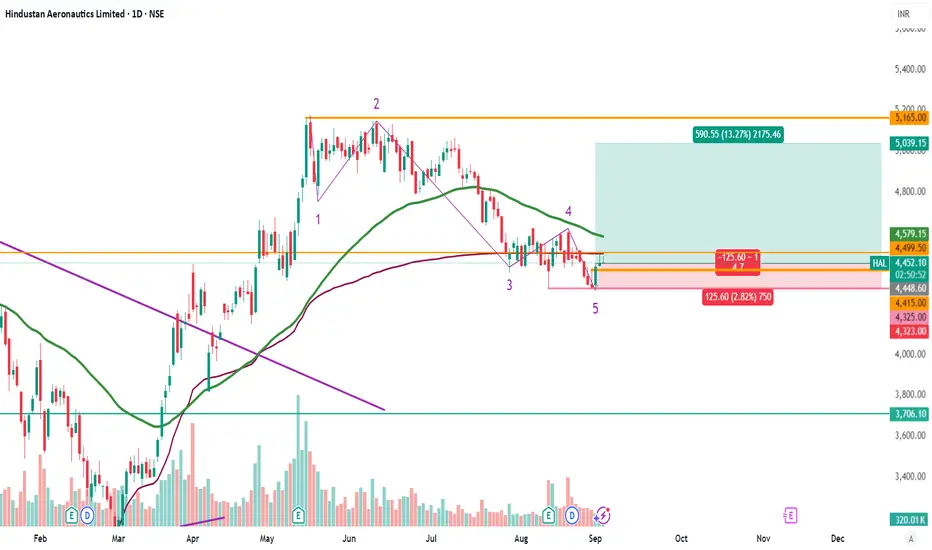
HalHal Chart Analysis ........ 24/11/2025
Short : Below 4590 level
Sl : 4630
Target : 4330 / 3500
Enjoy !
Note : The harmonic pattern will be active below the 4300 level, then your target becomes up to the 3500 level.

Review and plan for 24th November 2025 Nifty future and banknifty future analysis and intraday plan.
This video is for information/education purpose only. you are 100% responsible for any actions you take by reading/viewing this post.
please consult your financial advisor before taking any action.
----Vinaykumar hiremath, CMT

Can it be breakout Stock or Breakdown, Walkthrough on HALThis Video is on HAL which is consolidating for a long time
Whether it will give breakout or Breakdown is all explained in Detailed in this video

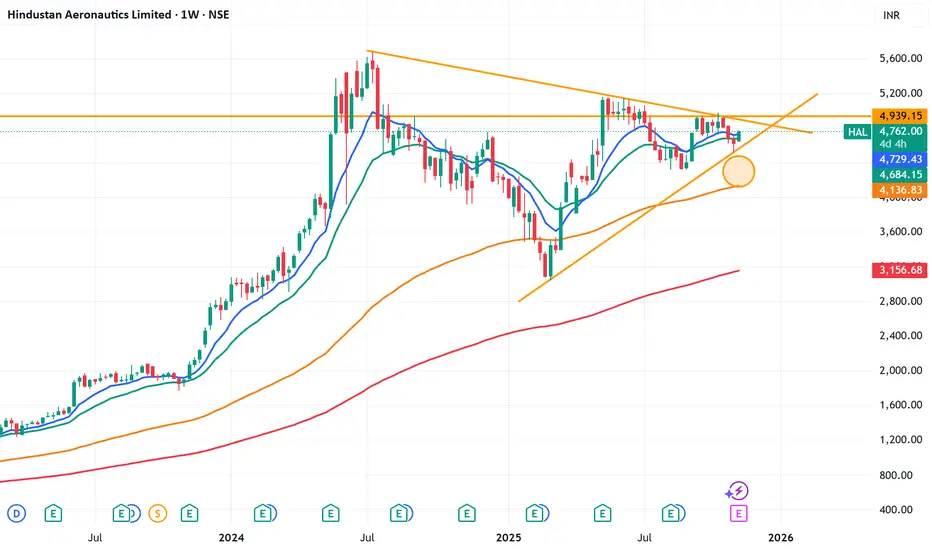
What HAL chart is trying to say?HAL, analyse on weekly TF. I think, it should try to attempt 4930 again. If it consolidates there, expect 5600+ thereafter.
Also if it closes below previous day low, and also breaks the lower trend, then a gap would appear and it may try to fill that for 4100 level
Disclaimer: This post is just for educational purpose
HALHi,
Price traded at near resistance area so possiblity that it will be moves down side. Let's see what happens
This idea is for Educational purpose and paper trading only. Please consult your financial advisor before investing or making any position. Facts or Data given above may be slightly incorrect. We are not SEBI registered

Bullish On HAL Defence Sector₹6.2L Cr budget and 75% indigenization target drive 15% CAGR; order backlog at ₹2L Cr. Sector P/E ~50-60; picks emphasize execution over hype
P/E ~39 (undervalued vs. sector 55+), PEG ~2 on 20% growth from Tejas/LCA orders. 26% ROE, 34% ROCE, and ₹94,000 Cr backlog; stable PSU moat. Target: ₹5,500 (13% upside).


A HEALTHY RETRACEMENT IN A BULLISH HALa healthy retracement in a bullish hindustan aerounautics
BEARISH CORRECTION WAVE IS COMPLETED
BULLISH CANDLE TO TRUST IS FORMED
HAL - Target 3839.40 or 6159.20 ?Date: 19-05-2025
#HAL Current Price: 5016.3
Mid-Point: 4999.30
Upside Targets: 5426.46, 5662.10, 5910.65 and 6159.20
Downside Targets: 4572.97,4336.50, 4087.95 and 3839.40
Support: 4809.43
Resistance: 5190.83
#HAL
#HALChartAnalysis
#HALChartPatterns

HAL bearish, Kindly do your own studyHAL is looking bearish on higher time frame.
Monthly price action is bearish
Monthly MACD is NCO stat
Weekly bearish price action. Price has broken last 8 weeks range. Looks like C wave is pending
Weekly MACD has given downtick
Weekly RSI is below 60
Daily price has challenged lowe bollinger band with good volume
Daily MACD is in NCO stat and below zero line
Daily RSI is below 40
Daily ADX is strong
HAL: fake breakdown and a possible bullish move.Stock: Hindustan Aeronautics Ltd NSE:HAL
• Timeframe: 1-day candles (each candle represents one day of trading)
1. Consolidation Zone: A grey rectangular box highlights an area of "consolidation" starting from around May 14th. This means the stock price has been trading sideways within a relatively narrow range, not showing a clear uptrend or downtrend.
2. Fake Breakdown: An arrow points to a price dip below the lower boundary of the consolidation zone. The annotation calls this a "fake breakdown." This implies that the price temporarily moved below the support level, but then quickly bounced back up.
3. Potential Trade Setup: The chart suggests a potential long (buy) trade based on the fake breakdown and the subsequent recovery.
• Entry Point: Around 4,897.55 (labeled "ENTRY" on the chart) which is the price at which the stock could be bought.
• Stop Loss: Around 4,733.75 (likely intended to be the "4733.60")
This is the level below which the trader would exit the position to limit potential losses if the price moves against them.
• Targets: The chart identifies three potential profit targets:
* Target 1: 5,087.85
* Target 2: 5,305.15
* Target 3: 5,497.80

HAL - no wonder it is forming a FlagThe usual suspect among Defence Names in the country. Keep an eye out

accumulation phase if breakout will create new 52highConsolidation above 9ema and already bounched from 26ema


tejas is ready to fly highcan look for a short oppurtunity in this. chart looks good sector is good and rising

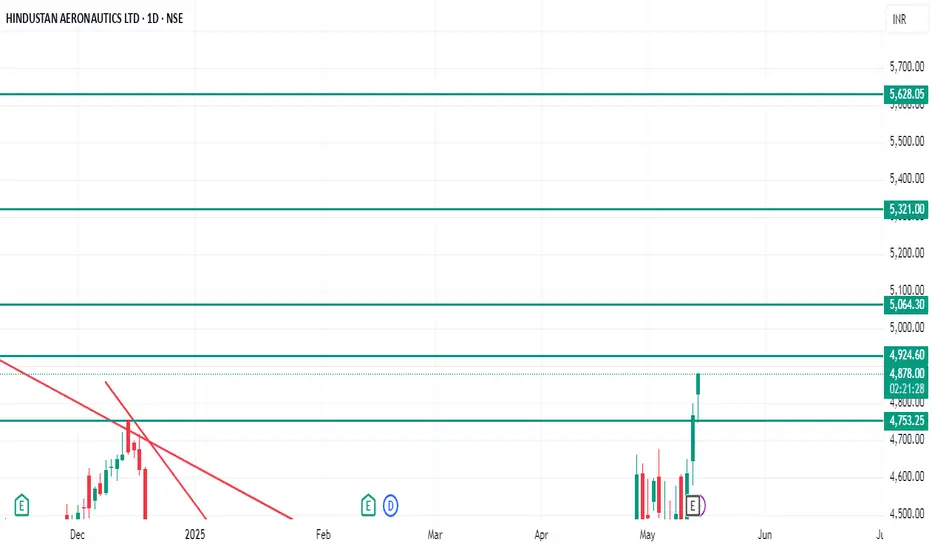
Go long in HALIt's a very good breakout in Hindustan aeronautics Ltd. 4755 was an important resistance in HAL on daily frame basis. Now it's breakout of this level. From here (CMP - 4877) we can expect upside targets in HAL: 4925,5065, 5320 & 5620.
Stoploss against this investment can be placed near 4740.
HAL -Hindustan Aeronautics Ltd. (45 minutes chart, NSE) - LongHAL -Hindustan Aeronautics Ltd. (45 minutes chart, NSE) - Long Position; short-term research idea.
Risk assessment: High {volatility risk}
Risk/Reward ratio ~ 2.05
Current Market Price (CMP) ~ 4740
Entry limit ~ 4665 on May 14, 2025
1. Target limit ~ 4780 (+2.47%; +115 points)
2. Target limit ~ 4880 (+4.61%; +215 points)
Stop order limit ~ 4560 (-2.25%; -105 points)
Disclaimer: Investments in securities markets are subject to market risks. All information presented in this group is strictly for reference and personal study purposes only and is not a recommendation and/or a solicitation to act upon under any interpretation of the letter.
LEGEND:
{curly brackets} = observation notes
= important updates
(parentheses) = information details
~ tilde/approximation = variable value
-hyphen = fixed value

Hindustan aeronautics Here is the English version, ready to copy:
---
This chart is of Hindustan Aeronautics Ltd (HAL). It shows a technical pattern known as the "Cup and Handle" pattern.
The chart shows a resistance zone around 4600–4700, which the stock has recently tested.
If the breakout is successful, an upward rally can be expected.
If you find this helpful and want more FREE forecasts in TradingView, Hit the 'BOOST' button
Drop some feedback in the comments below! (e.g., What did you find most useful?
How can we improve?)
Your support is appreciated!
Now, it's your turn!
Be sure to leave a comment; let us know how you see this opportunity and forecast.
Have a successful week
DISCLAIMER: I am NOT a SEBI registered advisor or a financial adviser. All the views are for educational purpose only
