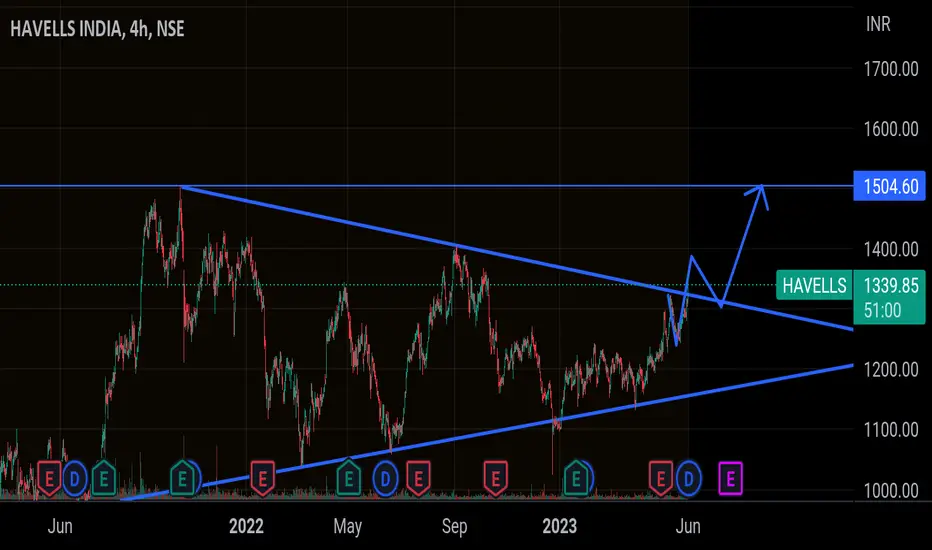
HAVELLS Make symmetrical triangle chart pattern in 4 hour time fram , take break out with High volume , MACD and RSI saw fair value , also take support of 50 EMA so first Target will be 1504.05 and Stop loss will be 1268.75
This is for educational purpose not a trading advice so that's my view comment down your view 🤗
HAVELLS trade ideas
HAVELLS - Weekly AnalysisIn the Weekly Chart of HAVELLS ,
we can see that, it is at decision making.
it can make or break.
Chart looks positive as Trendline is respected Multiple times.


#Havells cash : Looks good above 1270#Havells cash -Positional call
10.05.2023
Looks good above 1270
Stoploss 1240
Target 1316-1320/1360
Cmp 1255.70

Havells India NSE:HAVELLS
Setup for range trading
Two trades each with 7% gains.
Duration: 2-3 months each
*Not a financial advice.
My charts speaks louder than words.
I'm a chartist and I paint charts.

HAVELLS : ShortThese kind of Stock setups which is a combination of:
>> High PE
>> Degrading Momentum
>> No fall yet
Are rare to come by.
Not a Recommendation, but looks juicy!

#Havells looking good movement #HAVELLS...
Intraday as well as swing trade
All levels given in charts
IF good potential seen then we work in options also
if activate then possible a huge movement Keep eye on this
We take trade only when it activates...

HAVELLS Bullish Trendline Breakout
Havells is ready to continue its bullish trend with trendline breakout on daily chart

HAVELLS TRENDLINE BREAKOUT !!! The price following descending trendline resistance from a very long time. Whenever the price reaches near the trendline price taking resistance and slopes down. Now finally price breaks the trendline and closes above the trendline with good breakout candle. Price can retest the level of 1200 after breakout and than go up towards the upper targets. Above the level of 1245 price will show good strength and potential towards upside.
HAVELLS 📊
👉 Trendline Breakout👍
👉Strong Closing✅
👉Bullish Structure
👉More Strength above 1245+
👉Support ---1185
👉Keep on radar✅👍


Buy Long - Havells India at 1230 for target of 1431, SL-1213.NSE:HAVELLS Cup and Handle formation break out with high volume, Expected returns-16.34%

Havels Giving BO in Daily TF with volumes and bullish formationThis is my analysis on Havells giving Break out In Daily Timeframe .
Price is above 9,20,50,100, EMA
The stock has made multiple attempts to break the trendline, and BO with increasing volume and also making lower Highs and Higher lows.
this is just a thought / idea for the trade and not a recommendation or call.
please do your due research and place your orders according to your risk appetite.

HAVELLSIn the Daily chart of HAVELLS ,
we can see that, it is near the breakout of Cup & Handle.
Enter on breakout with strict SL.
HAVELLS has good future. this stock can be considered as investment also.

HAVELLS Buy for intraday tradingHAVELLS Buy for intraday trading if stock breaks the given resistance level...........

Havells India: reversal stockHavells India is a potential reversal stock. Keep it on your radar!!!!!

Havells Havells looks good on weekly chart in which it is taking support at trendline now it can show some gain for short term


Havells Forming Head and Shoulder patternHavells is at good levels and forming Head and Shoulder pattern. While taking trade do your own analysis to get most out of it.

Havells one day chart traders this is the chart of havells for me strong resistance is 1274 and support is not defined but we can consider trendline as support

Havells one day chart havells one day chart looks bullish it test multiple times its supoort zone now it can go up but now it will be late entry as we have miss it

HAVELLS, RANGE BREAKOUT!!we could see in further few days to increase volume and give a range breakout. havells is a great company.
the major black line is the actual trend the stock should follow.
currently its undervalued.
great for swing trades.
one can take a target till 1420.

HAVELLSHavells made double bottom pattern on broke above previous swing high with good volumes.
Could be bought with mentioned stoploss & target.

HAVELLSGo long in Havells India As You Can Clearly See in The Above Chart That After Giving A Nice Breakout Havells India Has Again Taken Support From Its Breakout Level And After Couple Of Days Havells is Going To Post Its Q2 Result Which is High Probably Excellet As Diwali Is Coming And Havells Has The Dominant Market Share In The Elctric And Electronic Market So Go Agressive Bullish Buy Stock or Option As Much As You Can.
Trade At Your Own Risk Its Just My View What I Believe .
