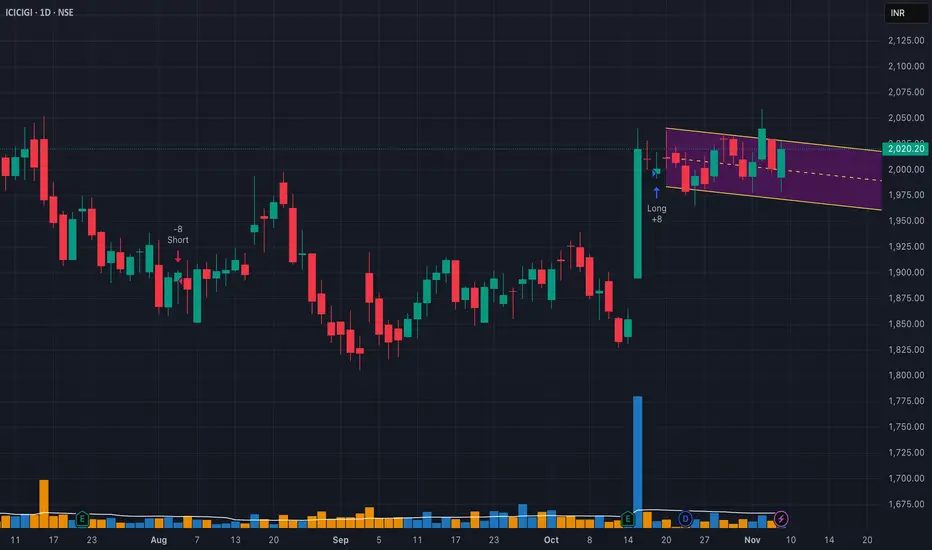
ICICI Lombard Signalling Flag PatternObserved Volume breakout on 15 th October.
Now consolidating in a channel.
Showing an Pole and Flag Pattern.
Entry above on Channel Breakout.
SL below Channel
Target 2080/2250
Next report date
—
Report period
—
EPS estimate
—
Revenue estimate
—
56.45 INR
25.08 B INR
239.89 B INR
216.35 M
About ICICI Lombard General Insurance Co. Ltd.
Sector
Industry
CEO
Sanjeev Radheyshyam Mantri
Website
Headquarters
Mumbai
Founded
2000
IPO date
Sep 27, 2017
IPO offer price
10.20 USD
Identifiers
2
ISININE765G01017
ICICI Lombard General Insurance Co. Ltd. engages in the provision of general insurance products and services. It operates through the following segments: Fire, Marine-Cargo, Marine-Others, Motor-OD, Motor-TP, Worksmen’s Compensation, Public and Product Liability, Engineering, Aviation, Personal Accident, Health Insurance, Credit Insurance, Crop and Weather Insurance, and Others. The company was founded on October 30, 2000 and is headquartered in Mumbai, India.
Related stocks
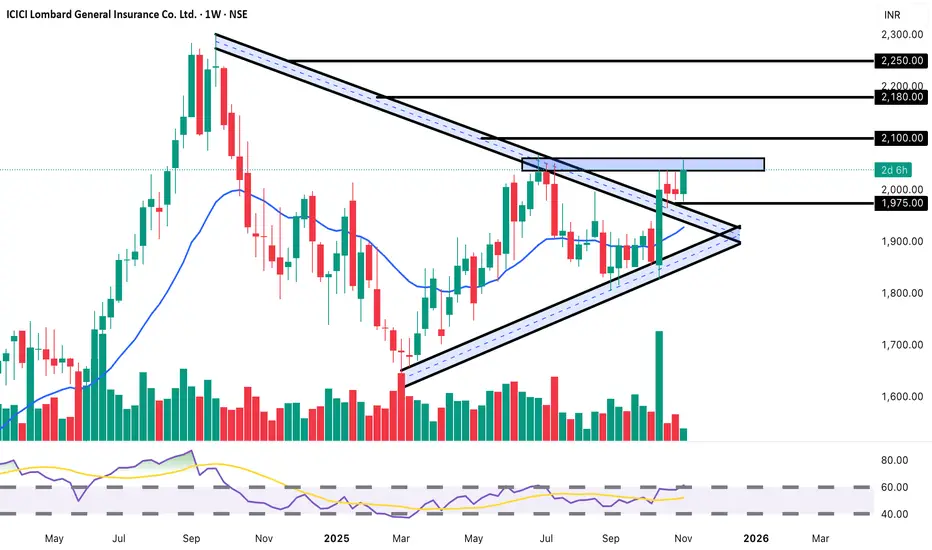
ICICIGI: Weekly Triangle Squeeze | Explosive Move Expected Soon BUY Setup 🛡️
Entry: ₹2,040-2,050 (Current Level)
Target 1: ₹2,080-2,100
Target 2: ₹2,150-2,180
Target 3: ₹2,250+ (Extended - Post Breakout)
Stop Loss: ₹1,975
Technical Rationale:
MAJOR PATTERN: Symmetrical Triangle forming on Weekly chart - apex approaching
Trading at upper boundary of triangle -
ICICI Lombard General Insurance Co. Ltd for 16th Oct #ICICIGI ICICI Lombard General Insurance Co. Ltd for 16th Oct #ICICIGI
Resistance 2030 Watching above 2033 for upside momentum.
Support area 2000-1995 Below 2000 gnoring upside momentum for intraday
Watching below 1994 for downside movement...
Above 2030 gnoring downside move for intraday
Charts for Edu

ICICIGI - TRIANGLE FORMATIONPrice is consolidating in an ascending structure and now testing a key resistance zone around 1900–1920. A breakout above this level may open the way toward 2014+ levels.
Entry: On breakout & close above 1915–1920
Target: 2014
Stop Loss (SL): 1885
Risk-Reward Ratio (RR): ~2.0
The stock is forming
ICICI GI Long_Support at 20 Daily EMAICICI GI Long:
- Price takes support at 20 DEMA
- 2 days before the Earnings call (Caution)
- Enter long when the prices favorable in the lower timeframe
- SL: CLose below 20 DEMA

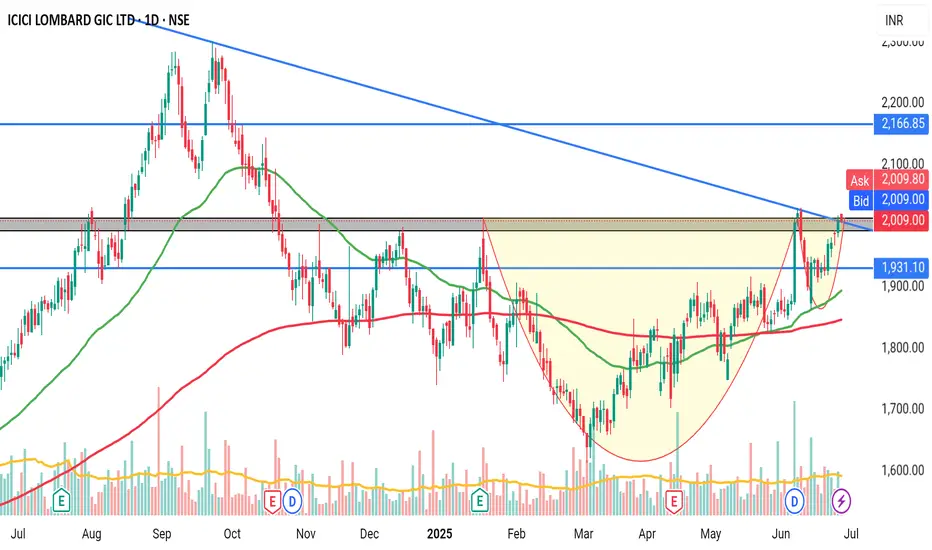
ICICI LOMBARDOn the verge of giving breakout of cup and handle pattern. If volume supports the breakout, it will shoot up in no time.
ICICIGI | Buy @LTP | SL below 1865 | Targets 2170, 2280, 2950Disclaimer:
This is not financial advice. Please do your own research or consult with a financial advisor before making any investment decisions. Investments in stocks can be risky and may result in loss of capital.

ICICIGI breakout inverse head and shoulders pattern bullish activated
The bullish inverse head and shoulders pattern is a chart formation that signals a potential shift from a bearish trend to a bullish one

ICICIGI - A comfortable Triple bottom pattern Analysis:
This chart indicates a potential triple bottom pattern, which is a bullish reversal pattern. This pattern typically forms after a downtrend and suggests that the stock may reverse its trend upwards.
Support: The triple bottom is forming around the 17880 level, indicating strong support

ICICIGI Swing TradeHello,
Trend-Based Analysis. Buy the Dips, Sell The Rallies, Also Following the Trend. Let's see where the Price Action takes us, Riding the wave. Potential trade setups based on trend momentum.
Technical analysis based on trend identification and momentum, Looking for high-probability setups with

See all ideas
Summarizing what the indicators are suggesting.
Neutral
SellBuy
Strong sellStrong buy
Strong sellSellNeutralBuyStrong buy
Neutral
SellBuy
Strong sellStrong buy
Strong sellSellNeutralBuyStrong buy
Neutral
SellBuy
Strong sellStrong buy
Strong sellSellNeutralBuyStrong buy
An aggregate view of professional's ratings.
Neutral
SellBuy
Strong sellStrong buy
Strong sellSellNeutralBuyStrong buy
Neutral
SellBuy
Strong sellStrong buy
Strong sellSellNeutralBuyStrong buy
Neutral
SellBuy
Strong sellStrong buy
Strong sellSellNeutralBuyStrong buy
Displays a symbol's price movements over previous years to identify recurring trends.
Frequently Asked Questions
The current price of ICICIGI is 1,951.20 INR — it has decreased by −0.03% in the past 24 hours. Watch ICICI Lombard General Insurance Co. Ltd. stock price performance more closely on the chart.
Depending on the exchange, the stock ticker may vary. For instance, on NSE exchange ICICI Lombard General Insurance Co. Ltd. stocks are traded under the ticker ICICIGI.
ICICIGI stock has risen by 0.22% compared to the previous week, the month change is a −4.54% fall, over the last year ICICI Lombard General Insurance Co. Ltd. has showed a −1.91% decrease.
We've gathered analysts' opinions on ICICI Lombard General Insurance Co. Ltd. future price: according to them, ICICIGI price has a max estimate of 2,380.00 INR and a min estimate of 1,450.00 INR. Watch ICICIGI chart and read a more detailed ICICI Lombard General Insurance Co. Ltd. stock forecast: see what analysts think of ICICI Lombard General Insurance Co. Ltd. and suggest that you do with its stocks.
ICICIGI reached its all-time high on Sep 23, 2024 with the price of 2,301.90 INR, and its all-time low was 638.65 INR and was reached on Sep 27, 2017. View more price dynamics on ICICIGI chart.
See other stocks reaching their highest and lowest prices.
See other stocks reaching their highest and lowest prices.
ICICIGI stock is 1.29% volatile and has beta coefficient of 0.81. Track ICICI Lombard General Insurance Co. Ltd. stock price on the chart and check out the list of the most volatile stocks — is ICICI Lombard General Insurance Co. Ltd. there?
Today ICICI Lombard General Insurance Co. Ltd. has the market capitalization of 971.40 B, it has decreased by −2.45% over the last week.
Yes, you can track ICICI Lombard General Insurance Co. Ltd. financials in yearly and quarterly reports right on TradingView.
ICICI Lombard General Insurance Co. Ltd. is going to release the next earnings report on Jan 16, 2026. Keep track of upcoming events with our Earnings Calendar.
ICICIGI earnings for the last quarter are 16.35 INR per share, whereas the estimation was 15.88 INR resulting in a 2.93% surprise. The estimated earnings for the next quarter are 14.61 INR per share. See more details about ICICI Lombard General Insurance Co. Ltd. earnings.
ICICI Lombard General Insurance Co. Ltd. revenue for the last quarter amounts to 70.59 B INR, despite the estimated figure of 66.38 B INR. In the next quarter, revenue is expected to reach 73.80 B INR.
ICICIGI net income for the last quarter is 8.20 B INR, while the quarter before that showed 7.47 B INR of net income which accounts for 9.70% change. Track more ICICI Lombard General Insurance Co. Ltd. financial stats to get the full picture.
ICICI Lombard General Insurance Co. Ltd. dividend yield was 0.70% in 2024, and payout ratio reached 24.63%. The year before the numbers were 0.65% and 28.19% correspondingly. See high-dividend stocks and find more opportunities for your portfolio.
As of Dec 17, 2025, the company has 16.7 K employees. See our rating of the largest employees — is ICICI Lombard General Insurance Co. Ltd. on this list?
Like other stocks, ICICIGI shares are traded on stock exchanges, e.g. Nasdaq, Nyse, Euronext, and the easiest way to buy them is through an online stock broker. To do this, you need to open an account and follow a broker's procedures, then start trading. You can trade ICICI Lombard General Insurance Co. Ltd. stock right from TradingView charts — choose your broker and connect to your account.
Investing in stocks requires a comprehensive research: you should carefully study all the available data, e.g. company's financials, related news, and its technical analysis. So ICICI Lombard General Insurance Co. Ltd. technincal analysis shows the sell today, and its 1 week rating is buy. Since market conditions are prone to changes, it's worth looking a bit further into the future — according to the 1 month rating ICICI Lombard General Insurance Co. Ltd. stock shows the buy signal. See more of ICICI Lombard General Insurance Co. Ltd. technicals for a more comprehensive analysis.
If you're still not sure, try looking for inspiration in our curated watchlists.
If you're still not sure, try looking for inspiration in our curated watchlists.