INDUS TOWER1. Trend Overview
Trend: Strong UP across HTF, MTF, and ITF.
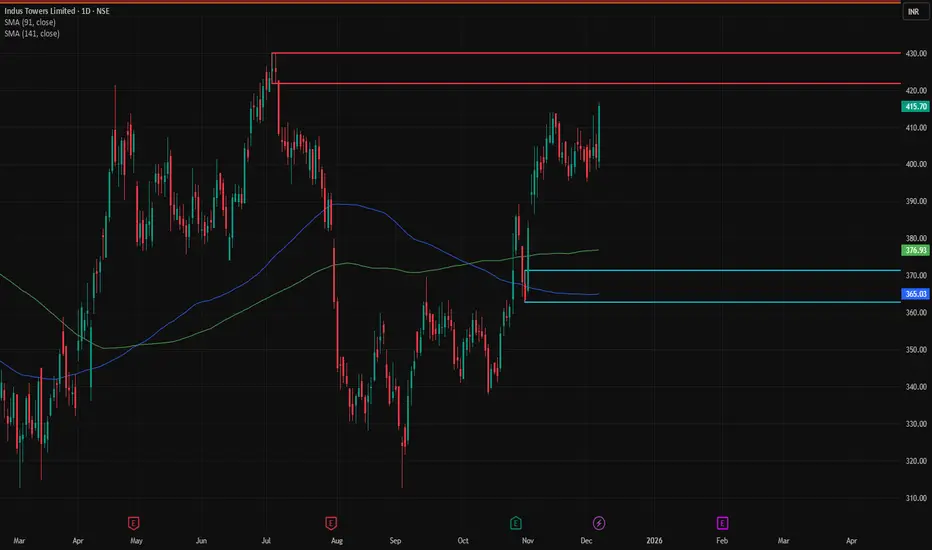
Support / Momentum Zones:
HTF Average: 244–281
MTF Average: 322–338
ITF Average: 362–375
Observation: Multi-timeframe alignment confirms strong bullish momentum.
2. Trade Plan
Parameter Value
Entry 375
Stop Loss (SL) 362
First Target 432
Positional Target 450
Risk (per unit) 13
Quantity 1000
Total Buy Value 375,000
Profit if trade hits target 63,300
Net Profit after costs 61,462
Loss if SL hit 13,000
Net Loss after costs 14,838
Risk-Reward (RR) 4.1 – 4.14
3. Upside & ROI
Upside Potential: 507
Real ROI:
12 months: ~30%
4 months: ~30%
Summary:
Buy near 375, strong multi-timeframe support.
Targets: First 432, then 450.
SL: 362.
Strong RR (~4x) with clear upside potential.
Market insights
BUY - TGT 470Indus Tower , expected to hit the levels of 470Get your 30% returns
BUY @ 363. TGT 470.
348 is another entry level.

INDUSTOWERS_16.11.2025With vodafone repayment, industowers will be stronger. This will allow momentum in stock above 460, may break life high (approx 500).

INDUSTOWERINDUSTOWER - good setup with potential to become double, tgt 800. accumulate on retracement with proper RR

INDUS TOWERS Ltd for 29th Oct #INDUSTOWER INDUS TOWERS Ltd for 29th Oct #INDUSTOWER
Resistance 387-388 Watching above 388 for upside momentum.
Support area 380 Below 380 gnoring upside momentum for intraday
Watching below 380 for downside movement...
Above 387 ignoring downside move for intraday
Charts for Educational purposes only.
Please follow strict stop loss and risk reward if you follow the level.
Thanks,
V Trade Point

Indus towers Ltd for 27th Oct #INDUSTOWER Indus towers Ltd for 27th Oct #INDUSTOWER
Resistance 365 Watching above 365 for upside momentum.
Support area 356-358 Below 360 gnoring upside momentum for intraday
Watching below 356 for downside movement...
Above 360 ignoring downside move for intraday
Charts for Educational purposes only.
Please follow strict stop loss and risk reward if you follow the level.
Thanks,
V Trade Point

IndusTower, Resistance, 1D, LongIndusTower at resistance at day time frame, if it closes above 363 then it can go long from here.
Entry 363
Target 383

Indus Tower looks bullish for short term target of 385.Indus Towers once Crosses 360 will be bullish for 385 target in short term.
It is trading above all moving averages and looks bullish with great volume for the target of 385 in a short term.
My Recommendation is to hold and add on dips.
Thanks!

Indus tower at support Indus tower looking good for upside, with strong fundamentals keep an eye on this,

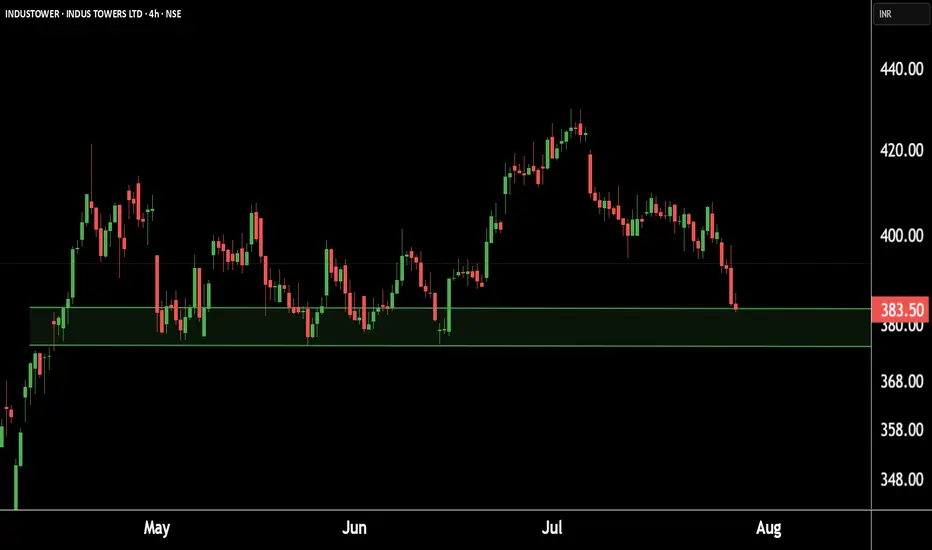
Indus Towers showing strength at key levels!Eyes on a potential.This is the 4 hour chart of INDUSTOWER.
INDUSTOWER having a good Support level near at 370-375.
if this level is sustain , then we may see higher prices in INDUSTOWER.
Thank You !!
INDUS TOWER - BREAKOUTNSE:INDUSTOWER Breakout stock with momentum indicators and multiple timeframe.

INDUS TOWER- BREAKOUTNSE:INDUSTOWER Monthly breakout almost 9 years consolidation breakout and retest on monthly chart. price will continue further rally from here.

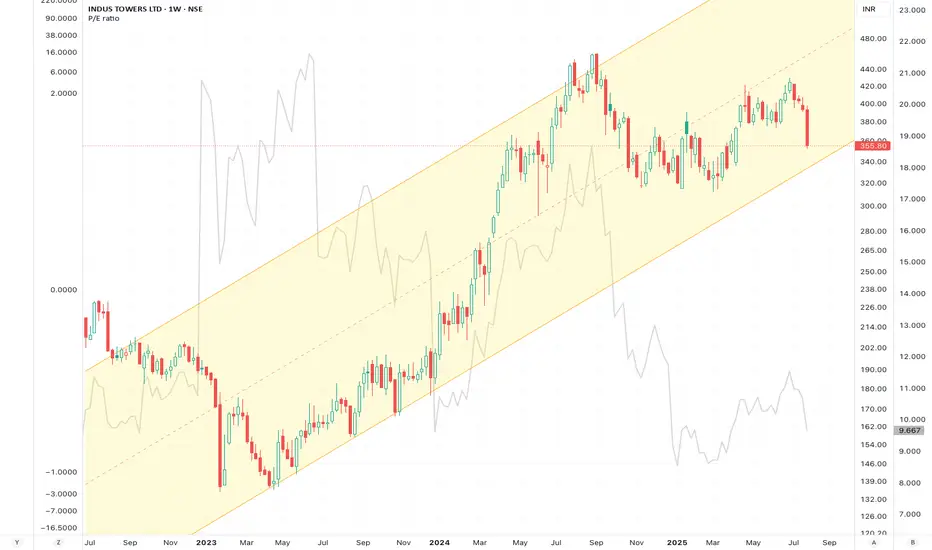
Indus on the MoveIndus Towers Ltd is India’s largest telecom tower infrastructure company, operating over 220,000 towers and enabling more than 340,000 colocations across all 22 telecom circles. Backed by Bharti Airtel (holding ~50%), the company offers long-term revenue visibility, steady cash flows, and a crucial position in India’s telecom value chain—especially as the country rapidly expands its 5G infrastructure.
In Q4 FY25, the company reported a standalone revenue of ₹7,727 crore, up 7.4% year-on-year. Consolidated revenue also rose to ₹7,547 crore. Net profit margins remain robust at around 33%, while the return on equity (ROE) stands strong at 30–33%. Operating efficiency is also reflected in the return on capital employed (ROCE), which is approximately 28.6%.
Liquidity remains healthy, with ₹33.4 billion in cash and short-term investments, positive working capital of ₹31.4 billion, and operating cash flow of ₹11,582 crore in FY2024. The company has a manageable debt-to-equity ratio of ~0.65 and net debt around ₹178 billion. Valuation metrics are attractive: a price-to-earnings (P/E) ratio near 10.8x and EV/EBITDA of ~5.6x suggest the stock is undervalued relative to its cash-generating strength. The Piotroski F-score of 7–8 reflects solid financial health.
Overall, the fundamentals indicate that Indus Towers is a stable, cash-rich business with long-term growth potential linked to telecom and data consumption growth in India.
📉 Technical Outlook
The 2-hour chart reflects a significant breakout pattern. A long-standing descending trendline has acted as dynamic resistance since April, repeatedly pushing the price lower. However, recent price action shows a strong breakout above this trendline, accompanied by bullish candles and higher volume.
The reversal zone between ₹388–392 acted as a key support area where buyers stepped in. The breakout above this zone followed by a push beyond the ₹404–408 zone signals strong upside momentum.
Key levels to monitor:
Close Above ₹408: Confirms the breakout and initiates bullish momentum.
Resistance Targets: ₹424 (R1), ₹438 (R2), and ₹462 (R3).
Support Zone: ₹388–392 remains a demand area. A move below this may invalidate the setup.
The pattern suggests a shift from lower highs to potential higher highs, which can attract swing and positional traders.
✅ Conclusion
Indus Towers is a classic case where fundamentals and technicals align. On one hand, it boasts strong earnings, consistent cash flow, low valuation, and strategic importance in India’s 5G rollout. On the other, the recent breakout from a long-term resistance trendline shows a potential trend reversal on the chart.
For investors and traders, this confluence presents a compelling opportunity. An entry in the ₹404–408 range could yield solid returns, with targets at ₹424, ₹438, and ₹462. A stop-loss below ₹388 is advisable to manage risk.
Disclaimer: lnkd.in

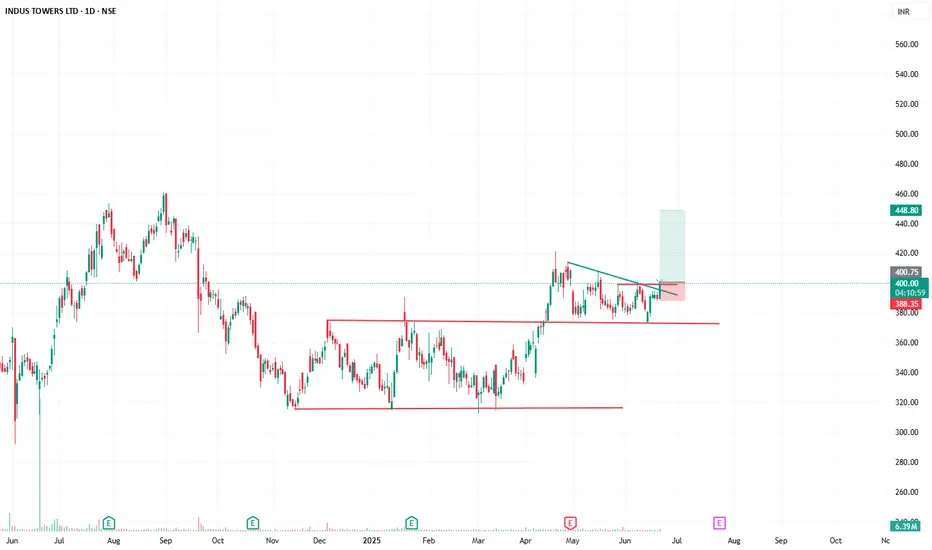
INDUSTOWER BULLISH PATTERN📡 "Tower Break! Signal Caught at ₹400"
🚀 Chart Pattern: Falling Trendline Breakout + Range Break
📈 Current Price: ₹400.25
🎯 Target: ₹448.80
🛡️ Stoploss: ₹388.15
📊 Risk:Reward ≈ 1:3.75
🔍 Volume Spike confirms breakout
🔻 Accumulation between ₹360–₹395 now acting as base
💡 Trade Setup:
After a long consolidation in a rectangular range, the price has broken out of both horizontal and descending resistance lines with strong volume. The price is above the breakout zone and retesting the level.
INDUSTOWER at Best Support Zone !!This is the 4 hour chart of INDUSTOWER .
INDUSTOWER having good Law of Polarity at 360-370 range.
The stock is forming a Descending Triangle pattern on th L.O.P at 375 range .
If this level is sustain , then we may see higher prices in INDUSTOWER.
Thank You !!

Bullish on INDUSTOWERINDUSTOWER has been in a triangular consolidation since 30th Aug 2024.
The stock corrected sharply since Sep2024 and then consolidated through the months of Nov2024 to March 2025 which is quite a considerable consolidation period.
The stock is now showing a Bullish momentum and is set to breakout.
We can anticipate a Target of 421 price level in the near term.
P.S. Not a Recommendation. Pls do your own due diligence.

Indus Towers Good to BUYIndus tower ( 384 ) has support at 377 and resistance at 415. With ROE @ 33 and ROCE @ 29 currently trading at 10.4 of its FY26 EPS. FII's have increase their stake. WE expect it is under valued and has potential to move to 487. Based on this factors we consider Indus tower a good to have in portfolio.

Pre-momentum stocks be identified in trading viewWhich indicator in trading view very precisely identifies pre-momentum bullish trend of a stock that would yield 5 to 10% of price rise in next couple of trading sessions .

Industower updated chartIndustower updated chart it can go upto 1.618 level as looking butterfly pattern

INDUSTOWERINDUSTOWER, watch below levels on chart.
DISCLAIMER : I am NOT a SEBI registered advisor or a financial adviser. All the views are for educational purpose only.

INDUSTOWER
Overall Trend:
Upward Trend: The green lines suggest an overall upward trend in the stock's price. This means the price has been generally increasing over the period shown.
Price Movement:
Volatility: The price has experienced significant fluctuations, with periods of sharp rises and falls. This is indicated by the vertical lines, which represent the price at different points in time.
Support and Resistance: The green and red lines might represent support and resistance levels. Support levels are price points where the price tends to find support and stop falling. Resistance levels are price points where the price tends to encounter resistance and stop rising.
Technical Analysis:
This chart is likely used for technical analysis, which involves studying past price and volume data to predict future price movements. Technical analysts use various tools and indicators (like the lines and boxes in this chart) to identify patterns and make trading decisions.
Disclaimer: This is a basic interpretation of the chart. Technical analysis is complex, and interpreting charts requires expertise and experience.

INDUSTOWERS -- looking bullishINDUSTOWERS -- looking bullish With Year on Year & QoQ increased Earnings with DOUBLE BOTTOM AND SPRING pattern developing on charts - looking for a bullish trades
