INOXWIND | Short if close below 135 | Strict SL above 140INOXWIND | Short if close below 135 | Strict SL above 140 | Targets 101, 80
Disclaimer (Please Read Carefully):
This is not investment advice. The stocks shared here are purely for educational and informational purposes. Please do your own research or consult with a financial advisor before making any investment decisions.
******************************************************************************************************************
Stock market में सिर्फ risk ही risk होता है। Market में survive करने का एक ही तरीका है, stop loss को पूरी discipline के साथ accept करना। अपनी capital को protect करने का इससे बेहतर कोई तरीका नहीं है।
मैं जो भी stock यहाँ शेयर करता हूँ, वो या तो मेरी existing holding में होता है, या फिर मैं उसी level पर fresh buying या add on करता हूँ जिसे मैं mention करता हूँ।
मैं हमेशा buy करते समय अपने system में stop loss ज़रूर लगा देता हूँ, और मेरे लिए stop loss, target से भी ज़्यादा important होता है।
Target achieve होने के बाद मैं पहले profit book करता हूँ और फिर retest या fresh breakout का इंतज़ार करता हूँ।
मैं सिर्फ breakouts पर buy करता हूँ, कभी भी support पर नहीं। और मैं resistance पर sell भी नहीं करता।
******************************************************************************************************************
The stock market involves risk, risk, and only risk. To survive in the market, accepting stop-loss with discipline and without hesitation. There is no other way to protect you capital.
Any stock I share is either already part of my existing holding or I take a fresh entry at the same level I mention. I always place the stop-loss in my system at the time of buying, and I give the highest importance to stop-loss more than the target. Once the target is achieved, I usually book profit once and then wait for either a retest or a fresh breakout.
I buy only on breakouts, never on supports. I also do not sell at resistance levels.
That is simply my trading style.
Trade ideas
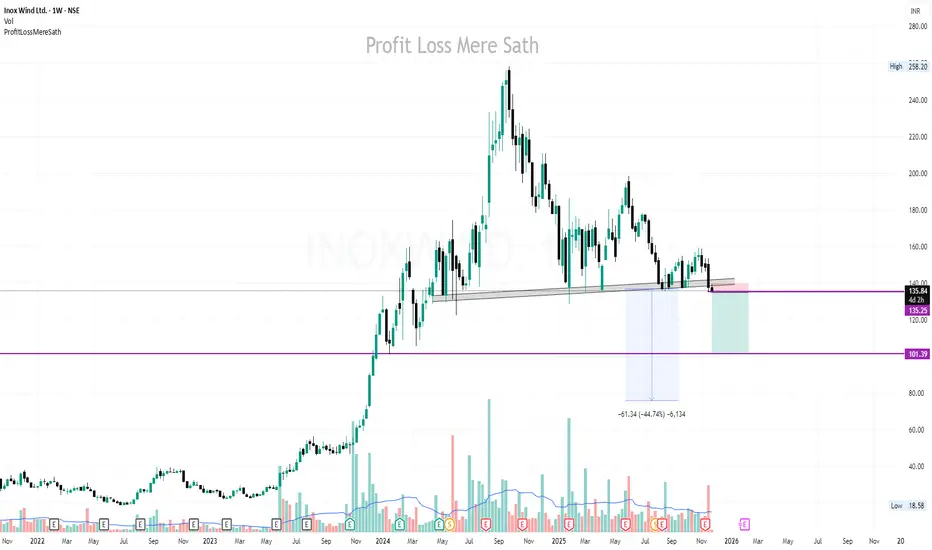
I’m personally shorting Inox Wind Ltd.I’m personally shorting Inox Wind Ltd. as per our Technical Analysis.
Reason : Strong Trendline Breakout.
“This is for educational purposes only, not a buy/sell recommendation.”
“I’m sharing my personal view, please do your own research before investing.”

Swing trade opportunity in INOX WINDSwing trade opportunity in INOX WIND.
Entry - 150
Targets - 175 & 190
DISCLAIMER: I am not SEBI registered and the ideas posted are only for educational purpose. Always trade with proper STOP LOSS.

INOXWIND | RSI divergence | Buy @138 | SL below 134 | Target 164Disclaimer:
This is not financial advice. Please do your own research or consult with a financial advisor before making any investment decisions. Investments in stocks can be risky and may result in loss of capital.

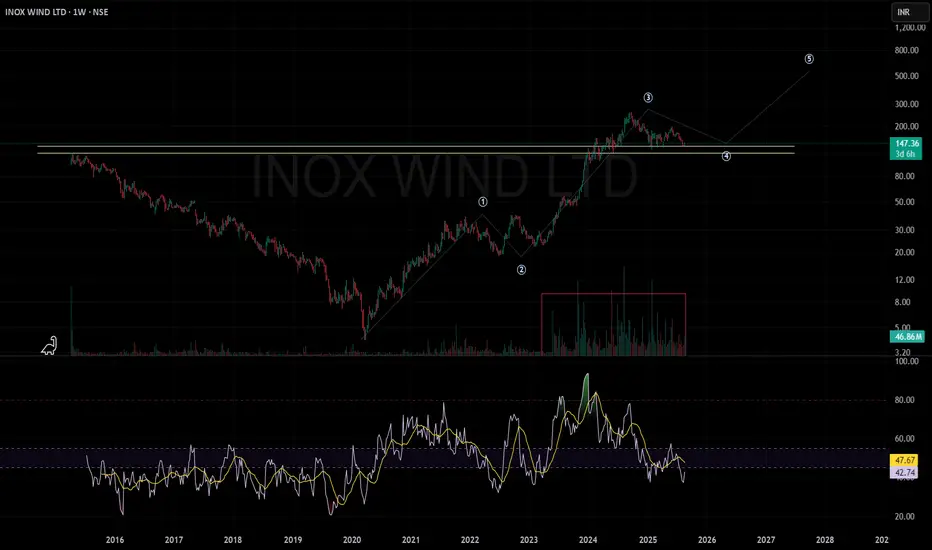
INOX WIND LTD Positional AnalysisLooks good for a 5th wave ride..
Structure: INOX Wind has completed waves 1, 2, and 3 (Elliott Wave count), now correcting in wave 4 near strong support (120–150INR zone).
Volume: Significant accumulation seen during recent rally, with volume expansion confirming breakout strength.
RSI: Currently at 42.91, indicating the stock is out of the overbought zone and resetting momentum for the next leg.
Outlook: If support holds, wave 5 could target higher levels (500–600 zone).
Invalidation: Breakdown below support could trigger further downside.

INOX WIND cmp 195Buying Zones are given on a chart .
It will retrace or will go directly up from here so invest in two part .
Fundamentals are looking great for long term .
I'm not SEBI registered
just shearing my view for educational purpose .
Join our group for9158774077send Hi for more Ideas

INOX WIND BREAKOUT Target Levels
- Short-Term Target: 204–211.
- Medium-Term Target: 261–343
Stop-Loss Levels
- Short-Term Stop Loss: 184.2 near immediate support
- Medium-Term Stop Loss: 157.1–153.8 strong support zone
- Long-Term Stop Loss: 170.6 major trend support

INOXWIND - Long Set-UPNSE:INOXWIND
𝐈𝐧𝐨𝐗 𝐖𝐢𝐧𝐃
𝐄𝐧𝐭𝐫𝐘 Between 173 -- 180
𝐒𝐋 Below 160 (Swing Low)
𝐓𝐚𝐫𝐠𝐞𝐭 Above 200+

Inox WindInox wind after a good consolidation in the form of a rounding bottom, has given a breakout retest. Keep eye on its breaking out frm trendline towards a new high! 👁️

INOXWIND | If Closing above 192Disclaimer:
This is not financial advice. Please do your own research or consult with a financial advisor before making any investment decisions. Investments in stocks can be risky and may result in loss of capital.

INOX WIND BREAKOUT LEVELS
"📊 INOX WIND Breakout Levels 🚀
🚨 Key Levels to Watch:
Resistance Level: [214 💥
🔍 Breakout Zone: Monitor for a potential breakout above the resistance level or a pullback to support for entry opportunities.
📈 Stay updated and trade wisely! 🚀
#INOXWIND #BreakoutLevels #TradingAnalysis #Stocks #TechnicalAnalysis #MarketWatch"
Feel free to customize the price levels based on your analysis.

INOX WIND LTD S/R Support and Resistance Levels:
Support Levels: These are price points (green line/shade) where a downward trend may be halted due to a concentration of buying interest. Imagine them as a safety net where buyers step in, preventing further decline.
Resistance Levels: Conversely, resistance levels (red line/shade) are where upward trends might stall due to increased selling interest. They act like a ceiling where sellers come in to push prices down.
Breakouts:
Bullish Breakout: When the price moves above resistance, it often indicates strong buying interest and the potential for a continued uptrend. Traders may view this as a signal to buy or hold.
Bearish Breakout: When the price falls below support, it can signal strong selling interest and the potential for a continued downtrend. Traders might see this as a cue to sell or avoid buying.
MA Ribbon (EMA 20, EMA 50, EMA 100, EMA 200) :
Above EMA: If the stock price is above the EMA, it suggests a potential uptrend or bullish momentum.
Below EMA: If the stock price is below the EMA, it indicates a potential downtrend or bearish momentum.
Trendline: A trendline is a straight line drawn on a chart to represent the general direction of a data point set.
Uptrend Line: Drawn by connecting the lows in an upward trend. Indicates that the price is moving higher over time. Acts as a support level, where prices tend to bounce upward.
Downtrend Line: Drawn by connecting the highs in a downward trend. Indicates that the price is moving lower over time. It acts as a resistance level, where prices tend to drop.
Disclaimer:
I am not a SEBI registered. The information provided here is for learning purposes only and should not be interpreted as financial advice. Consider the broader market context and consult with a qualified financial advisor before making investment decisions.

Go long in INOX WINDHere is a trendline breakout in INOX WIND. From here, on the upper side we can expect targets of 218,227 & 241.
Stoploss against this investment can be placed near 200.

InoxwindInoxwind
CMP 202
At crucial support zonecan bounce back from support zone or it will complete H&S if it breaks support
Key support 170-176 level

INOX WIND Swing Long TradeEnter only when 15minute candle closes above the Entry Zone Price - 229.45
Target with Risk to reward 1:2 is 280.35
Stoploss only when 1 day candle closes below the price - 204
Note: This is not any financial advice, this is for education purpose only.

INOXWIND - BullishStock name - Inox Wind ltd.
Weekly chart setup
Chart is self explanatory everything.
Master score - B
Disclaimer : This is for demonstration and education purpose only. This is not buying or selling recommendations. I'm not SEBI registered.

INOXWIND potential breakout 6 months long base
Out of the base pullback entry
Low risk entry point
High relative strength


INOX WINDKindly do your own study. This study is for view discussion only.
This stock is making new high and Wind is very high and stock is flying.
Monthly price is challenging upper bollinger band
Monthly MACD is in PCO stat
Monthly RSI is above 60
Weekly price has challenged upper bollinger band
Weekly MACD has given uptick above zero line
Weekly RSI is above 60
Weekly stochastic has given PCO
Weekly =DI crossed -DI
Daily price has given BO with high volume
Daily MACD is in PCO and above zero line
Daily RSI is above 60
Daily ADX is strong

INOX WIND SWING STOCK 50% swing trade perfect symmetrical triangle long term opportunity take trade according to own risk this is not call just a analysis.

Inox windStrong Upmove building up
Company becomes Debt free
Recently split happened 1 : 4 qty
Strong Renewables tailwind
