Khaitan Chemcial Ready for a major upsideKhaitan Chemcial Ready for a major upside. I have bought at 93 for the upside for 160-210 with a stop loss of 82
6.61 INR
13.99 M INR
7.20 B INR
26.55 M
About Khaitan Chemicals & Fertilizers Ltd.
Sector
Industry
Website
Headquarters
Indore
Founded
1982
ISIN
INE745B01028
FIGI
BBG000CV6KJ6
Khaitan Chemicals & Fertilizers Ltd. engages in the manufacturing and marketing of single super phosphate, sulphuric acid, and other chemicals. It also involves in the processing of oil seed and crude edible oil, selling of de-oiled cake and crude/refined oil and generation, and selling of wind power. It operates through the following business segments: Fertilizers, Chemicals and Specialty Chemicals, and Agro (Soya) and Others. The company was founded on June 2, 1982 and is headquartered in Indore, India.
Related stocks

Khaitan Chemicals & Fertilizers Short-Term Trading IdeaStock trade above all the ema and form a rounding bottom pattern after breakdown on 13 July 2022 stock try to breach the levels of 91 two time but failed, today stock breach the level of 91 with significant trading volume after 2 years with crossover on 24 june 2024. now we can wait for its retracem

khaitan chem already broke out falling wedge and retesting donekhaitan chem already broke out falling wedge and retesting done factor here on higher time frame weekly trading above 20ema.
there was breakout with high volume on daily time frame and seems retesting also done now showing 1hr hammer candle on support level seems chance to get lowest risk reward.

NEARING ITS SUPPORT LEVELPleasure to have you here. This is an analysis done for the Tickr, and potential in the Technical.
In this Chart ,Waiting for the big player to enter the trade, as the stock is at its support level,
High risk to reward potential, we will decide to make a position in the stock,
if you like the idea

KHAICHEM BUY 78-81 SL 69 TGT 95/107/140/164/200KHAICHEM BUY 78-81 SL 69 TGT 95/107/140/164/200
DISCLAIMER: These videos are for educational purposes only. Investing of any kind involves risk. While it is possible to minimize risk, your investments are solely your responsibility. It is imperative that you conduct your own research. I am merely

KHAICHEMBreakout with Massive Volume.
Good for both short term and long term.
Target 115 , 152 .
Disclaimer : This is not a Buy or Sell recommendation. Please consult your financial advisor before making any investments . This is for Educational purpose only.

KHAICHEM !! PERFECT STOCK for Swing TradingKHAICHEM !! PERFECT STOCK for Swing Trading
Perfect setup !! #VolumeHunter
- Huge Consolidation
- Huge Volume

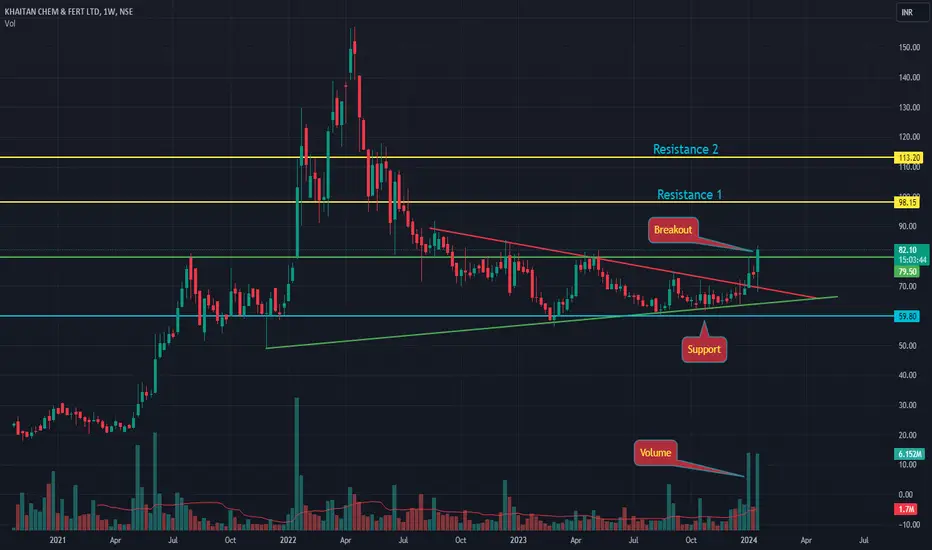
KHAICHEMStock name = Khaitan Chemicals & Fertirilizers Limited.
Weekly chart setup
Chart is self explanatory. Levels of breakout, possible up-moves (where stock may find resistances) and support (close below which, setup will be invalidated) are clearly defined.
Master Score = D
Weak earnings and laggard p
KHAICHEM 1d time frame buy@ 66.25 target @ 68.90, 69.90, 73.80 KHAICHEM 1d time frame
buy@ 66.25 target @ 68.90, 69.90, 73.40
symentric triangle breakout
risk reward 2.85
its just a view trade @ your own risk
sl@ 63.80

KHAICHEM - Weekly AnalysisIn the Weekly Chart of KHAICHEM ,
we can see that, it is at decision making.

See all ideas
Summarizing what the indicators are suggesting.
Oscillators
Neutral
SellBuy
Strong sellStrong buy
Strong sellSellNeutralBuyStrong buy
Oscillators
Neutral
SellBuy
Strong sellStrong buy
Strong sellSellNeutralBuyStrong buy
Summary
Neutral
SellBuy
Strong sellStrong buy
Strong sellSellNeutralBuyStrong buy
Summary
Neutral
SellBuy
Strong sellStrong buy
Strong sellSellNeutralBuyStrong buy
Summary
Neutral
SellBuy
Strong sellStrong buy
Strong sellSellNeutralBuyStrong buy
Moving Averages
Neutral
SellBuy
Strong sellStrong buy
Strong sellSellNeutralBuyStrong buy
Moving Averages
Neutral
SellBuy
Strong sellStrong buy
Strong sellSellNeutralBuyStrong buy
Displays a symbol's price movements over previous years to identify recurring trends.
Frequently Asked Questions
The current price of KHAICHEM is 97.40 INR — it has decreased by −1.46% in the past 24 hours. Watch Khaitan Chemicals & Fertilizers Ltd. stock price performance more closely on the chart.
Depending on the exchange, the stock ticker may vary. For instance, on NSE exchange Khaitan Chemicals & Fertilizers Ltd. stocks are traded under the ticker KHAICHEM.
KHAICHEM stock has fallen by −6.09% compared to the previous week, the month change is a −21.18% fall, over the last year Khaitan Chemicals & Fertilizers Ltd. has showed a 41.57% increase.
KHAICHEM reached its all-time high on Apr 18, 2022 with the price of 157.00 INR, and its all-time low was 18.00 INR and was reached on Nov 10, 2020. View more price dynamics on KHAICHEM chart.
See other stocks reaching their highest and lowest prices.
See other stocks reaching their highest and lowest prices.
KHAICHEM stock is 0.23% volatile and has beta coefficient of 1.77. Track Khaitan Chemicals & Fertilizers Ltd. stock price on the chart and check out the list of the most volatile stocks — is Khaitan Chemicals & Fertilizers Ltd. there?
Today Khaitan Chemicals & Fertilizers Ltd. has the market capitalization of 9.59 B, it has decreased by −3.34% over the last week.
Yes, you can track Khaitan Chemicals & Fertilizers Ltd. financials in yearly and quarterly reports right on TradingView.
KHAICHEM net income for the last quarter is 214.82 M INR, while the quarter before that showed 214.14 M INR of net income which accounts for 0.32% change. Track more Khaitan Chemicals & Fertilizers Ltd. financial stats to get the full picture.
As of Nov 14, 2025, the company has 671 employees. See our rating of the largest employees — is Khaitan Chemicals & Fertilizers Ltd. on this list?
EBITDA measures a company's operating performance, its growth signifies an improvement in the efficiency of a company. Khaitan Chemicals & Fertilizers Ltd. EBITDA is 841.39 M INR, and current EBITDA margin is 3.39%. See more stats in Khaitan Chemicals & Fertilizers Ltd. financial statements.
Like other stocks, KHAICHEM shares are traded on stock exchanges, e.g. Nasdaq, Nyse, Euronext, and the easiest way to buy them is through an online stock broker. To do this, you need to open an account and follow a broker's procedures, then start trading. You can trade Khaitan Chemicals & Fertilizers Ltd. stock right from TradingView charts — choose your broker and connect to your account.
Investing in stocks requires a comprehensive research: you should carefully study all the available data, e.g. company's financials, related news, and its technical analysis. So Khaitan Chemicals & Fertilizers Ltd. technincal analysis shows the sell today, and its 1 week rating is sell. Since market conditions are prone to changes, it's worth looking a bit further into the future — according to the 1 month rating Khaitan Chemicals & Fertilizers Ltd. stock shows the buy signal. See more of Khaitan Chemicals & Fertilizers Ltd. technicals for a more comprehensive analysis.
If you're still not sure, try looking for inspiration in our curated watchlists.
If you're still not sure, try looking for inspiration in our curated watchlists.