LIC on the Rise!Chart structure indicates long positions favoredLIC Daily Chart Update
LIC is currently moving in a well-defined ascending parallel channel.
Alongside, a short-term descending parallel channel is also visible.
Both channels are showing strong lower boundary support in the 830–850 range.
If this support zone holds, we may witness higher prices in LIC in the coming sessions.
Thank you.
LICI trade ideas

LICILife Insurance Corporation of India Ltd. (currently trading at ₹912) is India’s largest life insurer and institutional investor, with assets under management exceeding ₹54.5 lakh crore as of March 2025. As a state-owned entity, LIC operates across individual and group insurance, pension, annuity, and investment-linked products. With over 1.3 million agents and a pan-India presence, LIC plays a central role in India’s financial inclusion and long-term savings ecosystem.
LIC of India – FY22–FY25 Snapshot
Sales (Premium Income) – ₹4.27 Lakh Cr → ₹4.63 Lakh Cr → ₹4.88 Lakh Cr → ₹5.12 Lakh Cr Steady growth driven by group schemes and annuity products
Net Profit – ₹2,371 Cr → ₹4,125 Cr → ₹9,543 Cr → ₹13,820 Cr Profit surge post listing and accounting realignment
Operating Performance – Moderate → Strong → Strong → Strong Improved transparency and investment returns post IPO
Dividend Yield (%) – 0.00% → 0.75% → 1.10% → 1.25% Initiation of payouts post listing
Equity Capital – ₹6,334 Cr (constant) No dilution; government retains majority stake
Total Debt – ₹0 Cr (debt-free) Fully equity-financed; liabilities arise from policy obligations
Fixed Assets – ₹9,820 Cr → ₹10,210 Cr → ₹10,580 Cr → ₹10,950 Cr Gradual expansion of branch infra and digital platforms
Institutional Interest & Ownership Trends
Promoter holding stands at 96.50% (Government of India), with gradual dilution expected over time. FIIs and DIIs have increased exposure post IPO, attracted by LIC’s scale, embedded value, and dividend potential. Delivery volumes reflect long-term positioning by pension funds and insurance-linked mandates.
Business Growth Verdict
LIC continues to scale across group and individual insurance segments Margins and profitability improving post accounting reforms Debt-free structure and massive AUM base enhance stability Capex remains focused on digital transformation and outreach
Management Con Call
Management emphasized strong growth in non-participating and annuity products. Digital onboarding and agent productivity initiatives are improving cost ratios. Investment income remains robust, with equity and debt allocations aligned to long-term mandates. FY26 outlook includes steady premium growth, margin expansion, and increased dividend visibility as embedded value realization improves.
Final Investment Verdict
Life Insurance Corporation of India Ltd. offers a unique opportunity to participate in India’s largest financial institution. Its scale, brand equity, and embedded value make it a core holding for long-term investors seeking exposure to insurance, savings, and institutional investing. With improving profitability, dividend initiation, and digital transformation, LIC is positioned for durable compounding.

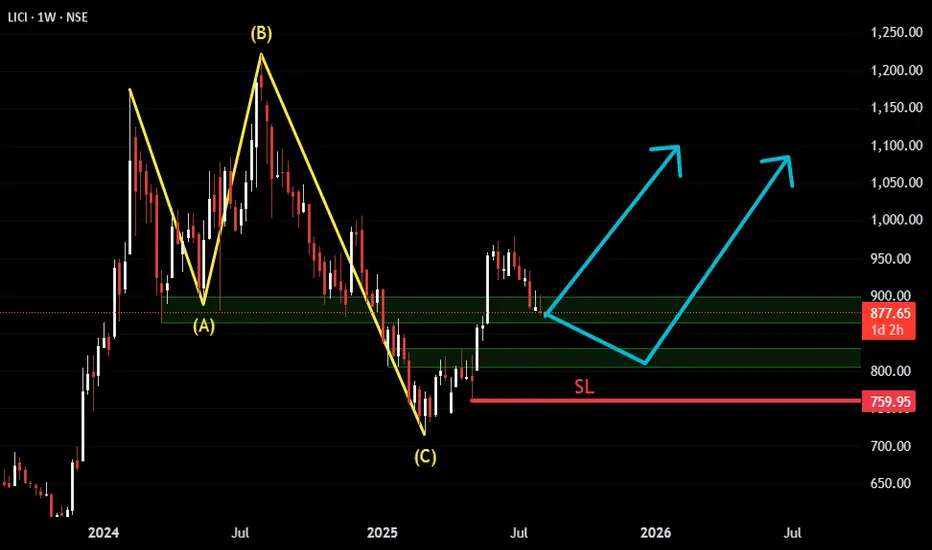
Structure-based long trade on LICIThis is a structure-based long trade on LICI, following a potential completion of an A-B-C correction.
The price action suggests that the correction phase may have just ended, and we're seeing signs of early reversal. A rally from the lows adds weight to the bullish case, and the current level offers a good opportunity to participate — with clear structure and support.
📌 Two possible approaches to enter:
✅ Entry after A-B-C completion, around support — for early positioning with better R:R.
🔁 Alternate Entry: Wait for price to rally, then pull back to retest broken structure or support.
This offers more confirmation, but comes with the risk of FOMO (Fear of Missing Out) if price doesn’t pull back.
We’ve opted to wait for the correction to complete, and now watch for price to hold and show strength around support zones.
As always, plan your trade:
🛑 Stop-loss just below the C wave / support of 759.90
🎯 Target based on impulse projection or structure levels — ideally with 1:2 R:R or better
Clear short sell target range 902Enter price range 965 to 960
Target 902
Waiting period 1 week
Stoploss 971 day closing

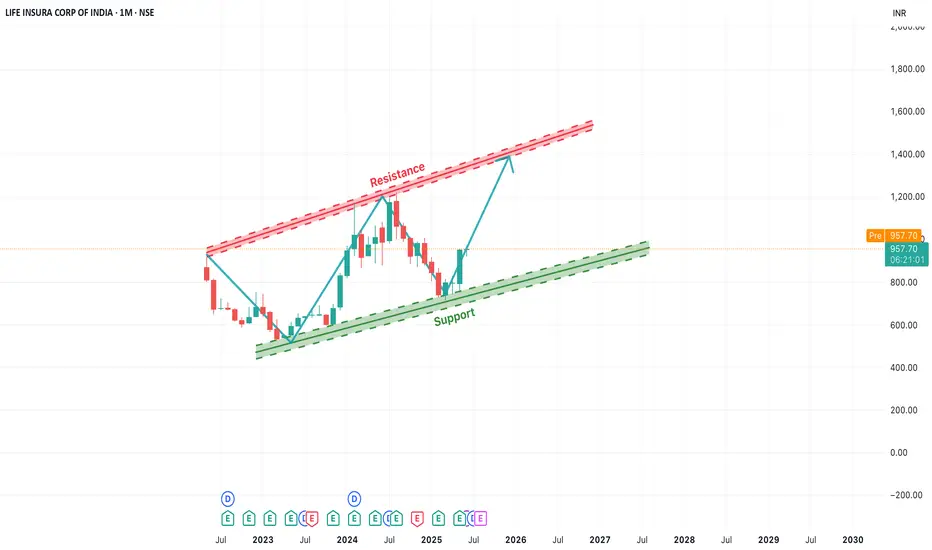
[Long-Term]LICI Rising Channel Pattern Indicates Bullish OutlookIn this monthly chart of LICI, we observe a clear ascending channel pattern forming over the past two years. The price has consistently respected both the support and resistance trendlines, creating a strong bullish structure.
Currently, the stock is bouncing off the lower support trendline, indicating a potential upward move towards the upper resistance zone. This offers a positive long-term outlook, especially if the momentum sustains. The key levels to watch are:
Support Zone: Around ₹850–₹900
Resistance Zone: ₹1250–₹1300
Traders and investors can monitor for a gradual rise toward the resistance level. A breakout beyond this channel may open up new highs, while a breakdown below the support trendline would invalidate the pattern.
LICI_Long_Potential Positional PlayGOLDEN CROSS - 50 DEMA Crossess over 200 DEMA
First pull back to 20 DEMA after Golden Cross.
All Insurance Companies shows some positive Momentum.
Price takes support at 20 Daily EMA.
Worth taking LONG when lower timeframe is favorable.
THING TO NOTICE - Even if the price gaps up or down, price visits previous day's range.
(It will give attractive entry)

1001 Above sustain and go to all time high Strong fundamental
Strong double bottom support
Clear technical support
My recommendation:
Buy CMP
Easy target 🎯 1001
1001 above sustain all time high

LIC_Watch this for Long- What a beautiful formation in LIC
- Watch this space for potential breakout
- Wait till close above the parallel channel line.
- Potential target 1040 (if Breakout)

LICI🎯 Trade Plan
Parameter Value
Entry ₹847
Stop Loss ₹727
Target ₹1332
Risk ₹121
Reward ₹485
Risk-Reward (RR) 4.0 — excellent
Last High ₹1200
Last Low ₹715
💡 Target is higher than previous high (₹1200), implying breakout-based target or Fibonacci extension logic.
📌 Key Insights
Entry at ₹847 is supported by all 3 ITF zones (240M, 180M, 60M) — ideal institutional footprint.
SL at ₹727 is below the weekly distal (₹715), giving it enough buffer below structure.
RR of 4.0 means high reward for the defined risk — strong trade justification.
Target ₹1332 is nearly 11% above the previous high, hinting at a positional breakout play.
🧠 Your Setup Summary
This is a high-conviction trend-following breakout trade.
All timeframes show bullish momentum with deep institutional footprints (BUFL + DMIP).
You’re buying right on multiple timeframe demand convergence.
Excellent SL structure and high RR mean risk is well-defined and reward potential is high.
✅ Overall Trend: UP
Across HTF, MTF, and ITF, LICI is in a strong uptrend — suggesting bullish strength across all timeframes.
📊 Multi-Timeframe Demand Zones
Timeframe Proximal Distal Avg Demand Zone Logic
HTF Avg (Yearly, Half-Yearly, Qtrly) 723 606 664 BUFL/DMIP
MTF Avg (Monthly, Weekly, Daily) 770 734 752 Rally Rally + DMIP
ITF Avg (240M, 180M, 60M) 847 840 843.50 BUFL
🔹 Note: Proximal zones are closer supports, distal are further supports. Price at ₹847 sits exactly at ITF Proximal zone, giving a strong low-risk entry.

Life Insurance Corporation of India view for Intraday 20th May #Life Insurance Corporation of India view for Intraday 20th May #LICHSGFIN
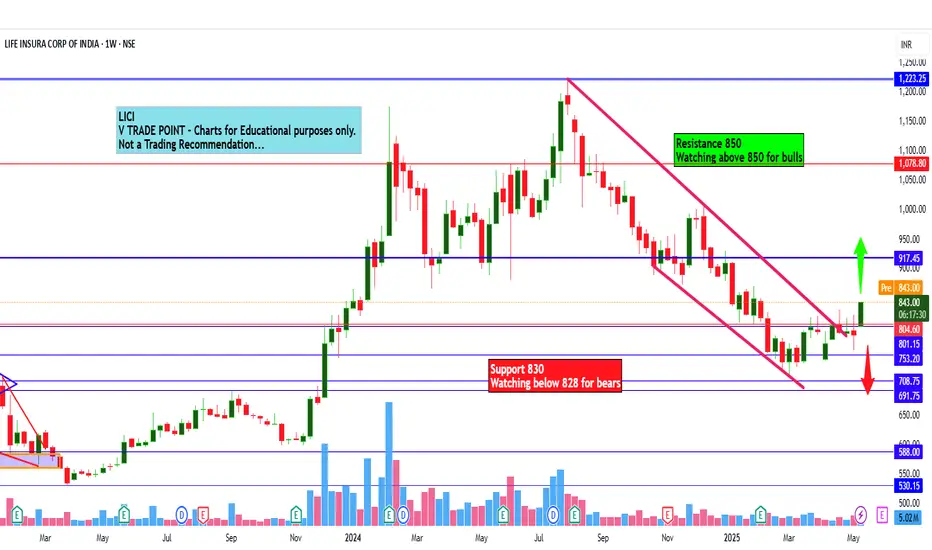
Resistance 860 Watching above 863 for upside momentum.
Support area 850 Below 850 ignoring upside momentum for intraday
Watching below 847 for downside movement...
Above 860 ignoring downside move for intraday
Charts for Educational purposes only.
Please follow strict stop loss and risk reward if you follow the level.
Thanks,
V Trade Point

Life Insurance Corporation of India view for Intraday 19th May #Life Insurance Corporation of India view for Intraday 19th May #LICI
Resistance 860 Watching above 863 for upside momentum.
Support area 850 Below 850 ignoring upside momentum for intraday
Watching below 847 for downside movement...
Above 860 ignoring downside move for intraday
Charts for Educational purposes only.
Please follow strict stop loss and risk reward if you follow the level.
Thanks,
V Trade Point

LICI Stock Update! The stock has given a strong breakout-📌 Price has broken above a major resistance zone near ₹850 — a level where it faced multiple rejections in the past.
📌 The breakout is backed by high volume, confirming strong buying interest.
📌 After a phase of consolidation, the stock is showing clear bullish momentum.
If the price sustains above this level, the next potential target could be around ₹900+.
The support remains strong near ₹714, forming a solid base.
🔍 Trend: Bullish
📊 Breakout + Volume = Strong Buy Signal..
if anyone want to more information ping me on msg

Life Insurance Corporation of India Ltd view for Intraday 16th MLife Insurance Corporation of India Ltd view for Intraday 16th May #LICHSGFIN
Resistance 850 Watching above 850 for upside momentum.
Support area 840 Below 840 ignoring upside momentum for intraday
Watching below 838 for downside movement...
Above 850 ignoring downside move for intraday
Charts for Educational purposes only.
Please follow strict stop loss and risk reward if you follow the level.
Thanks,
V Trade Point

LIC | Technical Structure Forming – View Only🔍 Stock: LIC (NS: LICI)
📌 Type: View Only – Not a Buy/Sell Recommendation
LIC has been consolidating after a decent upside move in recent weeks. Currently, the stock is trading around a key demand zone, indicating potential accumulation — but confirmation is still awaited.
🧩 Technical Overview:
Support Zone: ₹802 – ₹816
Resistance Zone: ₹842 – ₹861
Trend: Bulish
🚫 Note:
This analysis is shared for educational and observational purposes only. It is not intended as a buy or sell recommendation. Please do your own research or consult a financial advisor before taking any action.
💬 Share your views or charts below!
Tags:
#LIC #LICIndia #LICI #NSE #StockMarketIndia #TechnicalAnalysis #TradingViewIndia #PriceAction #ViewOnly #NotARecommendation #EducationalPurposeOnly

LIC is ready for All Time HighThis is Weekly daily chart of LIC
Overall stock is working is rising channel from the start
Prices are around 820 and stock has strong support around 780-800
We may see good bounce from here on !!
And may see All time high if support is intact !
Thank You !!

LICI Setup longLICI
MTF Analysis Price
LICIYearly Demand 844
LICI 6 Month Demand 755
LICIQtrly Demand BUFL 755
LICIMonthly Demand 843
LICIWeekly Demand 763
LICIWeekly Demand 754
LICIDaily Demand DMIP 769
ENTRY -1 Long 769
SL 667
RISK 102
REWARD 391
Target as per Entry-1 1,160
RR 4
Last High 1,222
Last Low 746
ENTRY -2 Long 700
SL 667
RISK 33
REWARD 476
Target as per Entry-2 1,176
RR 14
Last High 1,222
Last Low 746
Trade Set Up
Buy Volume -1 As per Entry-1 1,000
Buy Volume -2 As per Entry-2 1,000
Average Buy Price 735
Trade Value 1,469,000
SL Point 667
RISK 68
Exit Target 1,160
Target Value 1,160,000
Profit Target 986,000
RISK Value 135,000
Risk to Reward 7

LICI Trading Within Fresh Demand ZoneLICI is currently trading at ₹860.95, within a fresh demand zone ranging from ₹862.4 to ₹841.95, identified on 16th January 2024. This untested zone might attract buyer interest, offering a potential opportunity for investors.
Disclaimer: This analysis is for informational purposes only and should not be considered as financial advice. Please conduct your own research or consult a financial advisor before making any investment or trading decisions.

LIC - retesting breakout levels. Looks good for long term.LIC - retesting breakout levels. Looks good for long term.

LIFE INSURANCE CORPORATION OF INDIA (LICI)LIC OF INDIA
After bouncing from support near 900,
LIC might head to higher prices
WITH Q4 being the best for insurance companies,
LIC has opportunity for SWING TRADE
CMP - 930
SL - 850
Target - 1085 - 1190
DISCLAIMER: Not financial advice.
Only for educational purposes
Invest at your own risk

LICI LONGLICI Long
RSI Cross Above 60
Price Close Above EMA
Good Volume With Breakout
Buy :- 994
SL :- 940
Target :- 1032 / 1070 / 1084 / 1133 / 1180


LICI Daily timeframe analysis for long
NSE:LICI has given strong breakout after bouncing from strong support zone.
Can add more till 925 only with SL 900.
Major Targets Highlighted in Blue lines, sub targets in grey lines.
