MAHINDRA & MAHINDRA FINM&M FINANCIAL SERVICES LTD has breakout 7 years long resistance so TGT are mation in chart, and this is just for educational purpose not any buy and sell recommendation
Trade ideas

Breakout Backed by Fundamentals: M&MFINMahindra & Mahindra Financial Services (M&MFIN) stands as one of India’s largest rural- and semi-urban-focused NBFCs, playing a crucial role in financing tractors, utility vehicles, used vehicles, SME loans and other retail credit products. Backed by the Mahindra Group, the company benefits from strong brand recall, wide distribution, and deep penetration in under-served markets—key drivers for long-term sustainable growth.
Fundamental Overview – Stability With a Growth Trigger Ahead
✔ Strengthening Business Foundation
M&MFIN continues to deliver stable performance with:
Revenue around ₹186B
Net profit near ₹22B
EPS ~₹19 and
P/E around 19, placing the valuation in a reasonable range for a rural-centric NBFC.
The company has successfully diversified across tractors, utility vehicles, used vehicles and SME financing — reducing concentration risk and keeping the loan book broad-based.
✔ Rural Growth Cycle Turning Positive
Because the company is heavily tied to rural income trends, revival in tractor sales, improvement in agricultural liquidity, and government-led rural spending all work in its favour.
As these macro factors strengthen, the credit cycle for rural NBFCs typically improves.
✔ Operational Improvement Signals
Better visibility on NPAs
Improved collection efficiency
Stable funding structure
Moderate dividend and consistent profitability
Though ROE still sits at moderate levels, improvements in asset quality and steady AUM growth can meaningfully lift long-term return metrics.
In short, fundamentals are solid, stable, and quietly strengthening beneath the surface — setting the stage for a technical shift.
📈 Technical Breakout – The Market Confirms the Fundamentals
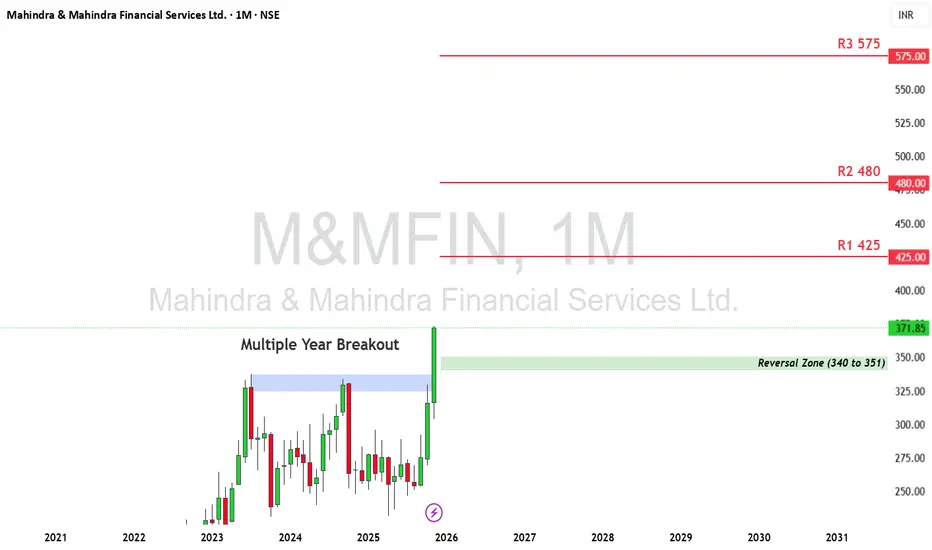
The monthly chart clearly reflects what the fundamentals have been hinting for months:
a strong, decisive multi-year breakout.
🔥 Multi-Year Breakout Zone Taken Out
The stock has pushed above a long-term consolidation range that held for several years. This breakout generally signifies the start of a new long-term trend, not just a short-term bounce.
🟩 Reversal Zone (Demand Zone: ₹340–₹351).
Any retest here becomes a high-probability long entry zone for positional traders.
🎯 Upside Levels
R1: ₹425
R2: ₹480
R3: ₹575
These levels map the probable path for higher timeframe targets if the breakout holds.
📌 Monthly Candle Strength
A strong +17–18% monthly breakout candle shows institutional participation, confirming long-term bullish strength.
🎯 Final View – Fundamentals First, Technicals Confirm
M&MFIN showcases the perfect techno-fundamental alignment:
Fundamentals: steadily improving rural credit cycle, stable earnings, reasonable valuation, and strong Mahindra ecosystem support.
Technicals: a powerful multi-year breakout that validates the fundamental strength and signals the start of a new trend.
As long as the stock stays above the ₹340–₹351 demand zone, long-term momentum remains intact and the journey toward ₹425 → ₹480 → ₹575 stays open.
Disclaimer: aliceblueonline.com
M&M BROKEN OUT AFTER LONG TIMEM&MFIN has broken out clearly from C&H pattern with 8 years of pattern formation.
one can buy with target 440 , 550

M_M finM&M Finance Technical View:
M&M Finance is showing signs of a potential breakout after nearly one year of tight consolidation between the ₹250–₹300 zone. The stock has been forming a solid base pattern, reflecting strong accumulation at lower levels.
A decisive close above ₹300 with good volume can confirm the breakout, opening the path for a fresh uptrend and a possible move toward ₹340–₹360 in the near term.
The RSI is gradually strengthening, and price action indicates higher lows on the weekly chart — a bullish sign suggesting renewed momentum. Sustaining above ₹280 will keep the structure positive, while any pullback toward ₹270–₹280 could be a healthy retest.
In summary:
📊 1-year consolidation base: ₹250–₹300
⚡ Breakout confirmation: Above ₹300 (with volume)
🎯 Potential targets: ₹340–₹360
🛡️ Support zone: ₹270–₹280
📈 Bias: Bullish on breakout and sustained momentum

M&M FIN. SERVICE LTD at Key Zone this is the Daily chart of M&M FIN. SERVICE LTD
M&MFIN having a good law of polarity at 255-260 level .
If this level is sustain ,then we may see higher prices in M&MFIN and if stock sustain below this level then M&MFIN will touch it's support zone 240 level.
Thank you !!

M & M fin service M & M fin service updated weekly chart it can go up to the mark D and revese from PR zone as marked will see ..cmp 297 on 08.02.2025

M&M FinanceAccumulate with Stop Loss 254, TGT 1 - 282, TGT 2 - 286, TGT 3 - 341
Enter once RSI crosses up 46.
I am not SEBI Registered.

m&m fin- multiple indicators flipped long todayUnderperformer well priced stock. turning to long after 9th april


Mahindra & Mahindra Financial S - Good Time for InvestmentMahindra & Mahindra Financial S - Good Time for Investment RSI* is the Key.


Mahindra and Mahindra finance 07 July 2020Mahindra and Mahindra finance 07 July 2020
Mahindra and Mahindra finance buy given at 195
As per the day trends and hour charts we have hit the bulls eye again.
All clients made profits with least investment. Our hourly charts are our forte and our analysis sticks to beyond technical analysis we do.
M-MFIN levels are clearly explained in the picture.
Our analysis is based on 1 Hr charts and we believe 1 hour charts are a perfect tool for the daily trends and intraday analysis. Our support and resistancelevels are unlike others , we opt for hourly charts and technical analysis . Our analysis is based on levels , algorithms which we created , beyondtechnical analysis and mathematical equations and derivatives.
In the chart you can see the red and blue rounds. Clearly it shows the Supprt and resistance levels with accurate dynamics.
Sometimes we work on daily and weekly charts too for derivatives and fundamental analysis .
It’s a good idea to short sell at the current price as it’s averaging there.
Top resistance and Support is given clearly.
However average sell can be given at current price.
The lower highs and the lower lows give are also clearly explained and detailed for our intraday Analytics.
Our ideas and levels are our own created and out of our strong fundamental basic knowledge on trading and the self created analysis. That’s the reason we are highly accurate on forecasts we give.
Contact me for more analysis and recommendations.


