Mazdock 2800 neckline target 3000Mazdock is ready for breakout above 2800
It should hold the level atleast 1 hr above 2800
To achieve 3020 target.
2800 is neckline of head and shoulder and also a crucial resistance.
Given the good quarterly result strong possibility of the target to meet within a month.
Market insights

MAZAGON DOCK SHIPBUILDERS LTD - BULLISHGetting support @ 2585 at 3rd time.
Upmove possible from here.
Entry, Targets & SL marked in the chart.


Mazgaon dock ship builder Another name which is showing strength relatively another good choice for learning look at this

Mazdock Swing Trade Setup📊 Price Action & Trend Analysis
Analyzing market trends using price action, key support/resistance levels, and candlestick patterns to identify high-probability trade setups.
Always follow the trend and manage risk wisely!
Price Action Analysis Interprets Market Movements Using Patterns And Trends On Price Charts.
👉👉👉Follow us for Live Market Views/Trades/Analysis/News Updates.

MAZAGON DOCK - 1 HOUR ANALYSIS1. Chart Structure
Timeframe: 30-min
Price action shows a clear downtrend from the top (~₹3,200) with multiple lower highs and lower lows.
After a sharp fall, price entered into a sideways consolidation zone (~₹2,700–₹2,800).
The circled area shows a selling confirmation candle (bearish rejection at resistance).
Projection arrows indicate potential further downside continuation.
2. Key Technical Levels
Immediate Resistance: 2,790 – 2,800 (selling zone)
Immediate Support: 2,680
Breakdown Confirmation: Below 2,680, strong fall expected
Downside Targets:
First: 2,600
Next: 2,530 (highlighted in chart)
Upside Risk Zone: If price closes above 2,800, bearish bias weakens → could see short covering toward 2,900+.
3. Indicators & Market Behavior
Trend: Strong bearish → consolidation is acting as a distribution zone.
Volume: Likely higher on down candles, suggesting distribution rather than accumulation.
Pattern: Bearish continuation pattern forming (possible breakdown from range).
Momentum: Weak, with sellers active at every bounce.
4. Trade Setup
Bias: Bearish
Entry Zone: Short below 2,680 with breakdown confirmation candle
Target Zone: 2,600 → 2,530
Stop Loss: Above 2,800
Risk–Reward: Good, approx. 1:2 to 1:3 if trade managed well.
5. Conclusion
MAZAGON DOCK is currently in a distribution phase, with clear selling confirmation candle suggesting sellers are regaining control.
A breakdown below 2,680 can trigger a strong downside move toward 2,600–2,530.
Bias: Positional bearish | Short opportunities favored.
Rating: 8.8/10 bearish setup
Position Type: Positional short.
⚠️ Disclaimer:
This analysis is for educational and informational purposes only. It does not constitute investment advice or a recommendation to buy or sell any securities. Trading in stocks, futures, and options involves significant risk of loss and may not be suitable for all investors. Please consult with your financial advisor before making any investment decisions. You are solely responsible for your trading actions.

Mazdock Short_Rejectiojn @ 200 demaMazdock:
- Price breaks 200 dema
- Bearish Engulging candle.
- Enter short when the prices are favorable
- SL - close above 200 dema

MAZGAON DOCKMazagon Dock Shipbuilders Ltd. (currently trading at ₹2,124.00) is a premier public sector shipyard under the Ministry of Defence, specializing in the construction of warships, submarines, and offshore platforms. With over 800 vessels built since inception, the company plays a strategic role in India’s naval modernization and maritime infrastructure. It is a Navratna PSU with strong execution capabilities and a robust order book from the Indian Navy and Coast Guard.
Mazagon Dock Shipbuilders Ltd. – FY22–FY25 Snapshot
Sales – ₹5,733 Cr → ₹7,210 Cr → ₹9,820 Cr → ₹11,432 Cr Strong topline growth driven by defense contracts and export orders
Net Profit – ₹610 Cr → ₹1,120 Cr → ₹1,780 Cr → ₹2,325 Cr Margin expansion from scale, efficiency, and high-value projects
Operating Performance – Strong → Strong → Strong → Strong Consistent execution across shipbuilding and submarine segments
Dividend Yield (%) – 1.85% → 2.10% → 2.35% → 2.50% Healthy payouts supported by strong cash flows
Equity Capital – ₹203.40 Cr (constant) No dilution; stable capital structure
Total Debt – ₹0 Cr (debt-free) Fully equity-financed operations
Fixed Assets – ₹1,980 Cr → ₹2,050 Cr → ₹2,120 Cr → ₹2,200 Cr Capex focused on dry dock upgrades and automation
Institutional Interest & Ownership Trends
Promoter holding stands at 84.83% via the Government of India. FIIs and DIIs have steadily increased exposure due to defense capex visibility and strong return metrics. Delivery volumes reflect long-term institutional positioning aligned with India’s naval modernization theme.
Business Growth Verdict
Mazagon Dock is scaling efficiently across warship and submarine programs Margins remain robust due to high-value defense contracts Debt-free structure enhances financial flexibility Capex supports long-term execution and strategic capacity
Management Con Call
Management reiterated strong visibility in the order book, including stealth frigates, destroyers, and offshore patrol vessels. Production activity commenced for the first Fast Patrol Vessel (FPV) and second Next Generation Offshore Patrol Vessel (NGOPV) for the Indian Coast Guard. Export orders from Denmark and other global clients are gaining traction. FY26 outlook includes double-digit revenue growth and sustained margin profile, supported by automation and dry dock expansion.
Final Investment Verdict
Mazagon Dock Shipbuilders Ltd. offers a high-quality defense infrastructure play with strong financials, strategic relevance, and execution depth. Its debt-free status, robust order book, and consistent profitability make it suitable for accumulation by investors seeking exposure to India’s defense and maritime growth. The company’s alignment with national security priorities and global shipbuilding standards ensures long-term value creation.
MAZAGON DOCK SHIPBULL looking strong 2 hrs ( short to medium tLOOKING stable and strong bullish contracting triangle
pattern suggest us abv 3284 closing
price action may show some strength
These classic patterns sometime shows sparkle in price action
pattern may be wrong
do your analysis
this is for educational purpose

Mazdock - Cup pattern breakout and pullbackMazagon Dock Shipbuilders Ltd.
Cup pattern breakout and in pullback on Weekly timeframe.
Close within 52 week zone.
Strongly outperforming sectoral and benchmark index.
Decreasing Relative strength.
Close crossing last week low.
Disclaimer:
For educational purpose only.
Please do your own research before taking any trades.
Happy Trading!

Review and plan for 30th May 2025Nifty future and banknifty future analysis and intraday plan.
Quarterly results.
This video is for information/education purpose only. you are 100% responsible for any actions you take by reading/viewing this post.
please consult your financial advisor before taking any action.
----Vinaykumar hiremath, CMT

MazdockMazdock after giving a nice beeakout , its still good fr a positional hold . Script has potential to make a new high! 💫

MAZDOCK - Buy setupBroke all time high with good volume.
Targets - 3500, 4000
Stop loss could be Daily close below Previous ATH

Mazdock can give its third base Breakout. Leading defence stock Mazdock firstly in all defence stocks , it can give its third base breakout. due to india pak war defence stock can give a rally.

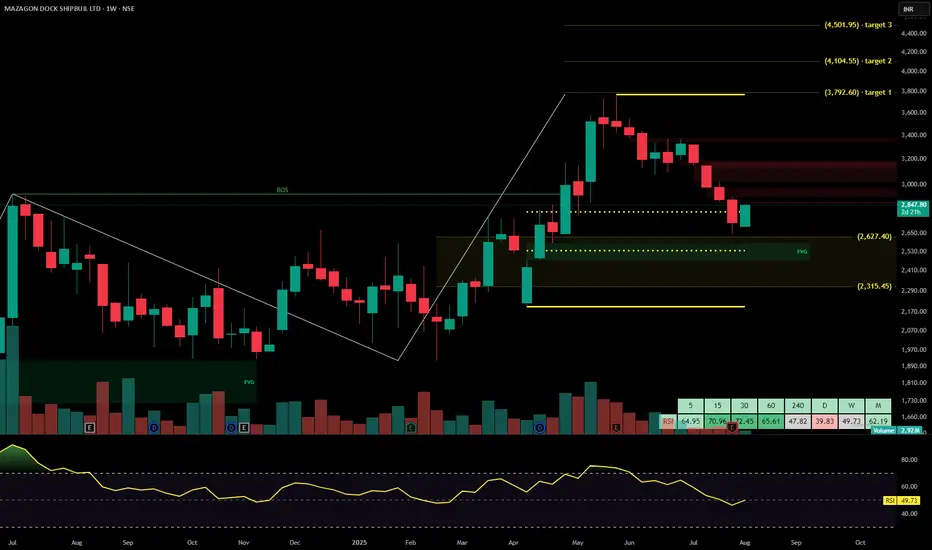
MAZAGON DOCK SHIPBUILRetest of the Neckline: After the breakout, the price has come back down to retest the neckline. This is a normal and healthy move to confirm the previous resistance as a new support.
If the price bounces from this neckline support, there is a strong possibility of an upward move, with the next target potentially around 3,400–3,600.
However, if the price breaks below this neckline support, the pattern may fail, and the price could fall to around 2,600 or lower.
If you find this helpful and want more FREE forecasts in TradingView, Hit the 'BOOST' button
Drop some feedback in the comments below! (e.g., What did you find most useful?
How can we improve?)
Your support is appreciated!
Now, it's your turn!
Be sure to leave a comment; let us know how you see this opportunity and forecast.
Have a successful week
DISCLAIMER: I am NOT a SEBI registered advisor or a financial adviser. All the views are for educational purpose only

mazagon dock looks niceMazagon dock - looks good. i opened it up cuz war starting and ships needed. and its above all time high(recent breakout). with a retrace. also a round bottom. looks gud

How I traded Defence Stocks last weekThis is a video about how I approach swing trading in stocks In this video I have covered Defense Stocks which were a flavor of last week

BO and entry wait for the retest 📊 Chart Overview:
Current Market Price (CMP): ₹2,996.60
Previous Resistance Level: Around ₹2,878.35 (now potentially acting as support)
Recent Price Action:
Strong bullish breakout above previous resistance.
Followed by a red candle (possible profit booking or retest of breakout zone).
🔍 Technical Insights:
Breakout Confirmation Zone:
The price has broken out from a previous resistance zone (~₹2,878) with strong momentum.
It's now hovering slightly above this level.
Volume Analysis:
Volume on the breakout was significantly higher than average (suggesting strength).
Pullback candle shows reduced volume, indicating it may just be a minor correction.
Trend Structure:
Higher highs and higher lows forming since February 2025 — clear uptrend.
Retest of breakout zone may offer a low-risk entry.
📈 Suggested Trade Plan (Short-Term Swing)
✅ Entry:
Ideal Buy Zone: ₹2,930 – ₹2,975 (on a retest or small dip near breakout support at ₹2,878)
Confirmation Entry: Above ₹3,025 with strong volume (if price bounces strongly from here)
🎯 Target Levels:
T1: ₹3,150 (recent swing high)
T2: ₹3,300 (psychological round level)
T3: ₹3,450 (Fibonacci extension zone, if momentum continues)
🛑 Stop-Loss:
Conservative SL: ₹2,870 (below breakout support)
Aggressive SL: ₹2,825 (below last swing low from April)
🔄 Alternate Scenario:
If the price breaks below ₹2,870 with strong volume, avoid long entries. Wait for stability or signs of reversal before re-entering

Title: “Mazagon Dock: History Repeats? Chart Pattern Suggests AnTitle: “Mazagon Dock: History Repeats? Chart Pattern Suggests Another Breakout Ahead!”
Description: Mazagon Dock Shipbuilders Ltd (MAZDOCK) is showing a strong resemblance to its previous bullish pattern from early 2024. The highlighted ellipses show two nearly identical consolidation and breakout formations. The blue projection line mirrors the past 2024 price movement, suggesting a potential rally.
Key Levels to Watch:
Resistance: 3095 — if broken, expect a move toward 3148.
Support Zone: Around 2930-2970.
If the pattern continues, we could see a strong upward move. This setup is a great example of price action repeating itself—classic case of a fractal pattern in technical analysis.
Idea Type: Bullish | Timeframe: 1D
👉 Note: Always manage risk. Patterns can fail—set your stop loss wisely!

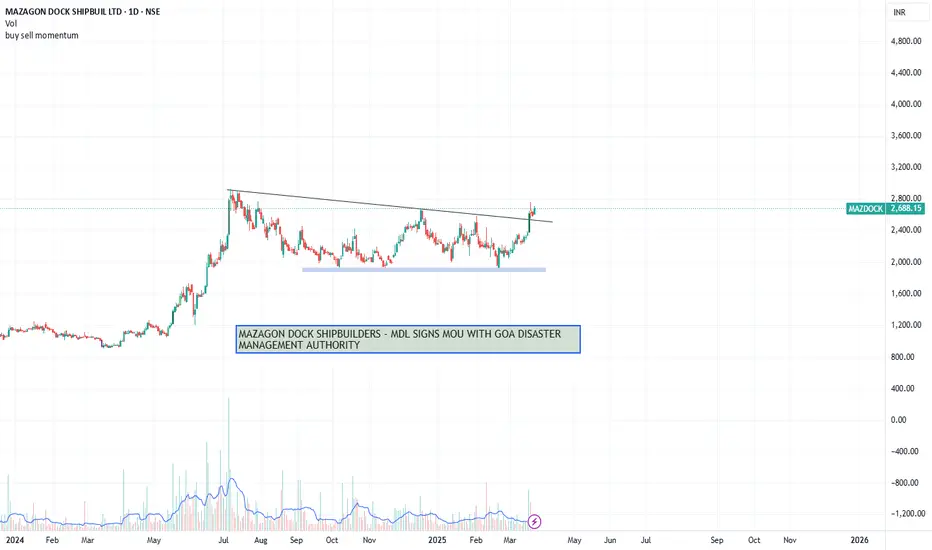
looks good for 4400MAZAGON DOCK SHIPBUILDERS (MDL) has signed a Memorandum of Understanding (MOU) with the Goa Disaster Management Authority. This agreement aims to collaborate on initiatives related to disaster management in the region. Through this partnership, MDL and the authority will work together to improve disaster preparedness, response, and recovery efforts in Goa, leveraging MDL's resources and expertise in support of the community's safety and resilience.
Strong month chart , holding support zoneThe company is among India’s leading shipbuilding yards, specializing in constructing and repairing warships and submarines for the Ministry of Defence and commercial vessels. It is the only Indian shipyard to have built destroyers and conventional submarines for the Navy, among the first to manufacture Veer and Khukri-class corvettes, and a lead builder of 4 Nilgiri-class stealth frigates. It is the only shipyard to be conferred with the Navratna status.

Mazdock: Reversal from Strong Support with Volume1. Strong Support Zone Holding
Mazdock has rebounded from a key support level, confirming buying interest.
Multiple touches at this level indicate a strong demand zone.
2. Volume Surge on Reversal
Increased buying volume signals institutional accumulation.
3. Potential Targets & Stop-Loss
Immediate resistance: Near previous swing high.
Breakout target: Box pattern height added to breakout level.
Stop-loss: Below recent support or breakout candle low.

Stock Analysis – Mazagon Dock Shipbuilders Ltd (MAZDOCK)📅 Date: January 30, 2025
📊 Timeframe: Daily Chart
📌 Market Snapshot
Change: +147.80 points (+6.29%)
🔴 Key Resistance Zones (Above Current Price)
🚀 2,560.68 – Immediate resistance
🚀 2,622.87 – Major resistance
🚀 2,730.73 – Long-term resistance
🟢 Key Support Zones (Below Current Price)
🔻 2,390.63 – Significant support
🔻 2,282.77 – Major support zone
🔻 2,220.58 – Strong historical support
📈 Candlestick Patterns
Recent Pattern: Strong bullish candle
🔥 Volume
Volume: 5.59M (compared to 2.95M, indicating strong participation and interest)
📊 Trend Analysis
Current Trend: Uptrend
Momentum Indicator: RSI Breakout
🚀 Conclusion
Mazagon Dock Shipbuilders Ltd is showing strong bullish momentum with a notable RSI breakout and an increase in volume, indicating robust participation. The stock is currently trending upwards, with key resistance levels in sight. Watch for price action near these resistance zones to gauge the sustainability of the trend.
Could Mazagon Dock sustain its rally and breach the next resistance levels, or will it encounter selling pressure that brings it back toward its support zones?
