Aggressive Entry → SL Hit → Patience Test → Trader's Reality.Today was a classic reminder of why trading is more psychology than charts.
I started the morning with an aggressive entry.
It was technically valid but not the kind of entry I usually take and it cost me a small SL.
No excuses. I took it, accepted it, moved on.
My second trade was the real setup:
Nifty 50 Index
No trades
About Nifty 50 Index
NIFTY 50 is the main index for the National Stock Exchange of India (NSE). It tracks the performance of the top 50 stocks by market capitalization from 13 sectors of the Indian economy. With such a relatively small number of companies within the index it still represents over 60% of the free float market capitalization of the stocks listed on NSE, and serves as a benchmark for fund portfolios and index funds. The list of the NIFTY 50 Index constituents is rescheduled every 6 month.
Related indices

#Nifty directions and levels for December 17th:Good morning, friends! 🌞
Market directions and levels for December 17th:
> No major changes occurred in global or Indian markets overnight. The Dow Jones shows bullish sentiment, while the Indian market indicates a moderately bullish outlook.
> Today, the GIFT Nifty is expected to open with a neu

This Live Market Video Can Save You From Years of Losses. This is a live market video where I break down how trades are planned in real time — not hindsight.
In this video I show:
How I read live price action
How trade plans are built during market hours
What NOT to do when emotions kick in
Real psychology mistakes traders make live
How patience

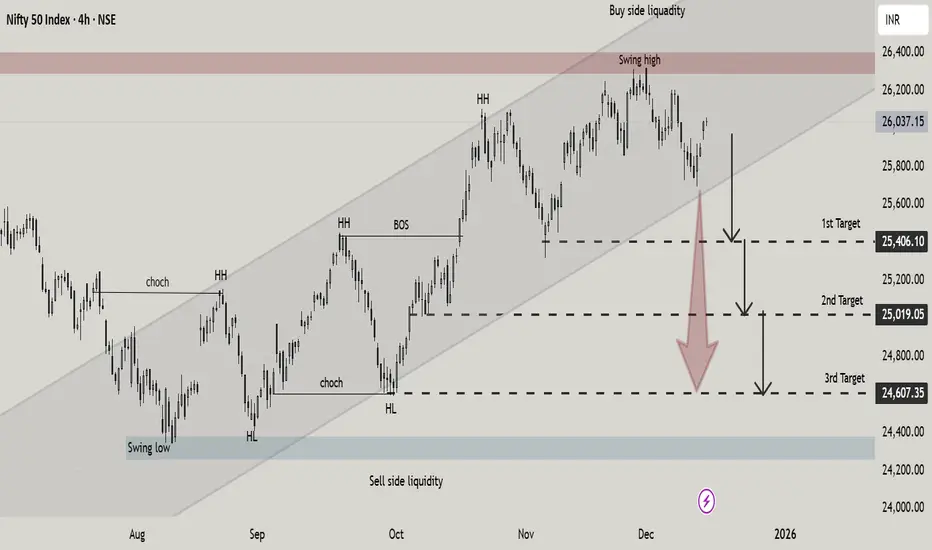
NIFTY 50 Rejection & Downside Targets in Focus NIFTY 50 on the 4H timeframe has reached a key buy side liquidity zone near the upper boundary of an ascending channel. After forming a swing high price shows signs of distribution and potential reversal. A downside move is anticipated toward sell-side liquidity with projected targets at 25,406, 25,
Called It Before. Traded It Live. STBT Trap DeliveredThis LIVE TRADE video is about planning the trade and then trading the plan.
In my previous live videos and analysis, I repeatedly spoke about a specific STBT trap scenario.
Today, the market opened gap down, formed exactly that setup, and the trade played out clean.
In this video you’ll see:
How

Market Ignored My Plan… So I Ignored My Ego | Options Buying |In today’s video, I did something most traders struggle with — I let go of my own analysis when the market clearly showed me a different story.
I started the day visualising multiple scenarios and expecting a certain move…
But price action had its own plan.
Instead of forcing my bias, I adapted.
I

NIFTY at AVWAP support and SHARK PRZ
TF: 15 Minutes
CMP: 25750
It appears that the price has reached the PRZ of Harmonic Shark formation.
Price is also at the developing AVWAP from Sept 2025 lows (25730).
Finally, this is the demand zone where buyers stepped in previously.
As per Harmonic pattern, we should expect 50% retracement

STOP LOSS HIT… And That’s Exactly Why I’ll Win Long-Term.Today’s trade hit my stop loss exactly as planned.
And honestly, this is the part most traders never show.
In the last few sessions, the same setup gave me:
1. one clean target
2. one break even
3. one small profit
Today it gave a stop loss.
And I still executed it without hesitation.
Why?
Becaus

#Nifty Directions and Levels for December 18thGood morning, friends! 🌞
Market Directions and Levels for December 18th
> No major changes occurred in global or Indian markets overnight. The Dow Jones shows bullish sentiment, while the Indian market indicates a moderately bearish outlook.
> As usual today, the GIFT Nifty is expected to open wi

Tomorrow’s NIFTY Plan:Structure, Trendlines & High ProbabilitiesIn this video, I’ve broken down NIFTY’s structure for tomorrow in the simplest possible way — trendlines, key levels, price behaviour, and the exact trade plans I’ll be looking at.
No indicators.
No clutter.
Just pure price-action logic you can apply instantly.
I’ve explained both sides — bullish

See all ideas
Summarizing what the indicators are suggesting.
Oscillators
Neutral
SellBuy
Strong sellStrong buy
Strong sellSellNeutralBuyStrong buy
Oscillators
Neutral
SellBuy
Strong sellStrong buy
Strong sellSellNeutralBuyStrong buy
Summary
Neutral
SellBuy
Strong sellStrong buy
Strong sellSellNeutralBuyStrong buy
Summary
Neutral
SellBuy
Strong sellStrong buy
Strong sellSellNeutralBuyStrong buy
Summary
Neutral
SellBuy
Strong sellStrong buy
Strong sellSellNeutralBuyStrong buy
Moving Averages
Neutral
SellBuy
Strong sellStrong buy
Strong sellSellNeutralBuyStrong buy
Moving Averages
Neutral
SellBuy
Strong sellStrong buy
Strong sellSellNeutralBuyStrong buy
Displays a symbol's value movements over previous years to identify recurring trends.
Frequently Asked Questions
The current value of Nifty 50 Index is 25,815.55 INR — it has fallen by −0.01% in the past 24 hours. Track the index more closely on the Nifty 50 Index chart.
Nifty 50 Index reached its highest quote on Dec 1, 2025 — 26,325.80 INR. See more data on the Nifty 50 Index chart.
The lowest ever quote of Nifty 50 Index is 279.00 INR. It was reached on Jul 3, 1990. See more data on the Nifty 50 Index chart.
Nifty 50 Index value has increased by 0.17% in the past week, since last month it has shown a −0.79% decrease, and over the year it's increased by 6.25%. Keep track of all changes on the Nifty 50 Index chart.
The top companies of Nifty 50 Index are NSE:RELIANCE, NSE:HDFCBANK, and NSE:BHARTIARTL — they can boast market cap of 231.16 B INR, 167.44 B INR, and 132.89 B INR accordingly.
The highest-priced instruments on Nifty 50 Index are NSE:MARUTI, NSE:ULTRACEMCO, and NSE:BAJAJ_AUTO — they'll cost you 16,329.00 INR, 11,461.00 INR, and 8,831.00 INR accordingly.
The champion of Nifty 50 Index is NSE:EICHERMOT — it's gained 50.43% over the year.
The weakest component of Nifty 50 Index is NSE:TRENT — it's lost −41.90% over the year.
Nifty 50 Index is just a number that lets you track performance of the instruments comprising the index, so you can't invest in it directly. But you can buy Nifty 50 Index futures or funds or invest in its components.
The Nifty 50 Index is comprised of 50 instruments including NSE:RELIANCE, NSE:HDFCBANK, NSE:BHARTIARTL and others. See the full list of Nifty 50 Index components to find more opportunities.