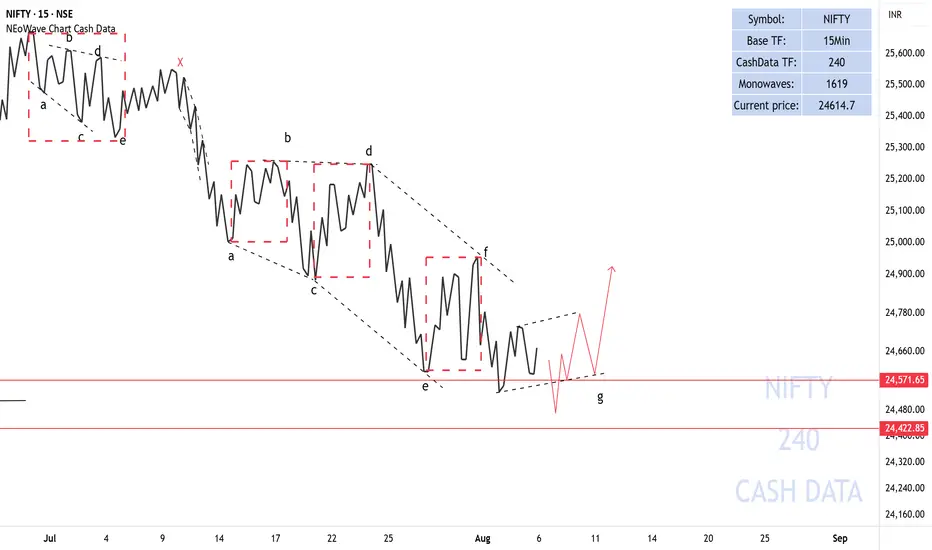
Forecasting the Movement of NIFTY50As previously mentioned, the NIFTY50 index is in the process of completing a diametric pattern. The news of the U.S. imposing tariffs on imports from India has already impacted the chart. Therefore, I believe the g-wave of the diametric will transform into a reverse contracting triangle, and the anticipated bullish correction, which I discussed earlier, will take shape in the NIFTY50.
Note:
If the U.S. imposes significantly heavier tariffs than the market expects, the g-wave may become larger.
Good luck
NEoWave Chart
NIFTY trade ideas
NIFTY50.....Miss a final sell-off! Part III!Hello Traders,
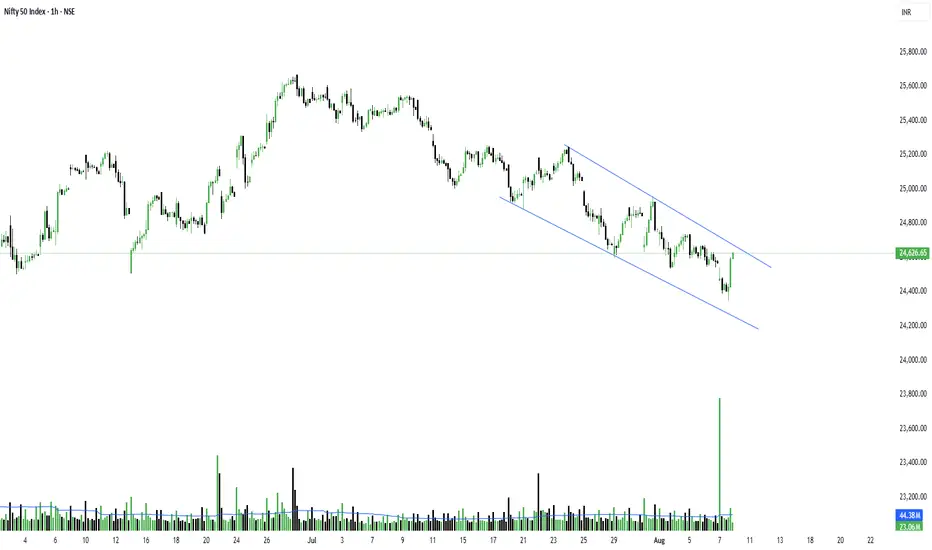
the NIFTY50 declined this week about ~370 points. That was inline with my expectations, and it also touched the sky-blue rectangle, to see at the chart! At the past two weeks, a loss of nearly 640 points!
Whether there will be a "final sell-off" at the start of a longer lasting correction or a crash?
Last week price have hit my target range, marked with the sky-blue rectangle @24363 points. I expect price to go lower in the coming trading week.
Chart analysis!
I have checked the pattern, and I am still waiting for the final sell-off! This kind of correction often ends in an "exhausting gap down" and it recovers imminently! After, if so to come, the next move should bring N50 to new ATH`s in the coming week, probably for the rest of the year!
An alternate scenario is that this pattern is a huge w-x-y correction and a wave "b" has ended @25669 on Monday 30th! In this case, the next move is a huge wave down with an a-b-c to new lows below the wave z @21743 on April 7th!
Note, that it can morph into a "running or expanding-flat" in the coming weeks!
It is too early to judge and call out a target. I depend on the internal structure of the pattern and how it develops.
Above 22540, the targets are at 28905.
We'll see how the market will makes its decision!
Have a great week.....
Ruebennase
Please ask or comment as appropriate.
Trade on this analysis at your own risk.

#Nifty directions and levels for August 4th:Good morning, friends! 🌞
Here are the market directions and levels for August 4th:
The global market (based on the Dow Jones) has shown a moderately bearish sentiment,
while the local market continues to display a bearish tone. However, today, Gift Nifty indicates a positive opening.
What can we expect today?
In the previous session, both Nifty and Bank Nifty closed with a negative bias.
However, today’s market is indicating a gap-up start of around 80 points. Structurally, if this gap-up doesn't sustain,
we can expect the correction to continue, possibly with some consolidation.
On the other hand, if the gap-up sustains and breaks the 38% Fibonacci level with a solid candle or after some consolidation,
we can expect a pullback of at least 50% to 78% in the minor swing.
In this case, even if the market takes a pullback but fails to break the 38% Fibonacci level,
another round of correction may follow.

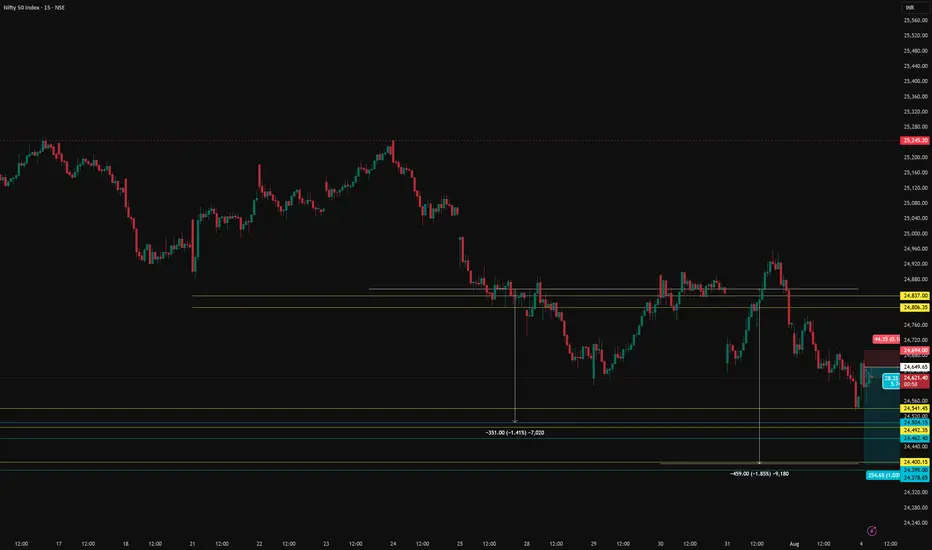
Intraday Setup for Tuesday 05 August Market Structure Over Sentiment
The market is currently trading in a confusing zone, especially with negative global sentiment in the backdrop. But remember — that sentiment only matters if the Friday hourly low breaks. Until then, stay technical, stay objective
🧭 Market Structure Overview:
Daily Trend: Continues to form lower lows, indicating weakness in the broader trend.
Hourly Timeframe: Trading near key support, forming a triple bottom at 24,500 – an important level to watch for breakdown or bounce.
5-Minute Chart (Intraday): Showing signs of higher highs, suggesting short-term buying interest.
Key Intraday Levels (Nifty):
24,800 – Critical Resistance Zone
➤ Watch Price Action Closely Here
If reversal comes from this level, it may offer a high-probability shorting opportunity.
A breakout above 24,800 is tricky – may trigger false moves, so wait for confirmation.
24,640 – Scalp Short Opportunity
➤ A good level for a quick short, provided the momentum supports it.
Ideal for scalpers looking for small, sharp moves.
Final Note:
Don’t get influenced by noise. Let the structure guide your trades. As long as Friday’s hourly low holds, bulls have a reason to defend. Below that — bears take the lead.

NIFTY AUGUST 2ND WEEK ANALYSISNifty can complete a retracement cycle this week, and we can expect upside momentum in the upcoming week. No major downside is expected beyond 24000. If the index fails to resume upside, then below marked levels can trigger strong short covering. On the upside, 24480 is the level from which we can expect upside momentum to continue up to 24750-900.
ALL LEVELS ARE MARKED IN THE CHART POSTED.

NIFTY50.....Miss a final sell-off! Part IIHello Traders,
the NIFTY50 is on track with my forecast! It declined over the course of the week to a level of 24565 points - a loss of almost 271 points, (nearly 1.09%).
The question is, if N50 is declining lower in the coming week. The question is, to what degree will it decline ?
Chart analysis:
Today, I'd like to show you another idea of the count. Here, at the level of 25669, a wave (v), green, has been established, and the following correction is a wave (iv), pink, to the level I have mark with the sky blue rectangle. This rectangle ranges from 24473 to 23934.90. If we reach these levels, wave (iv), whether of wave ((iv)) or wave (iv), should end!
In either case, there is more downside potential and has more room to go, and is not finished yet.
The first sign, that something went wrong would be at the point, when the high @ 23368, wave (i), green, were to be touched! This is because it is not permitted for a wave (iv) to touch the high of any degree of wave (i).
The indicators, too, have much room to decline for the rest of the week.
So, it will be exiting to watch how the market will makes its decision.
Have a great weekend.....
Ruebennase
Please ask or comment as appropriate.
Trade on this analysis at your own risk.

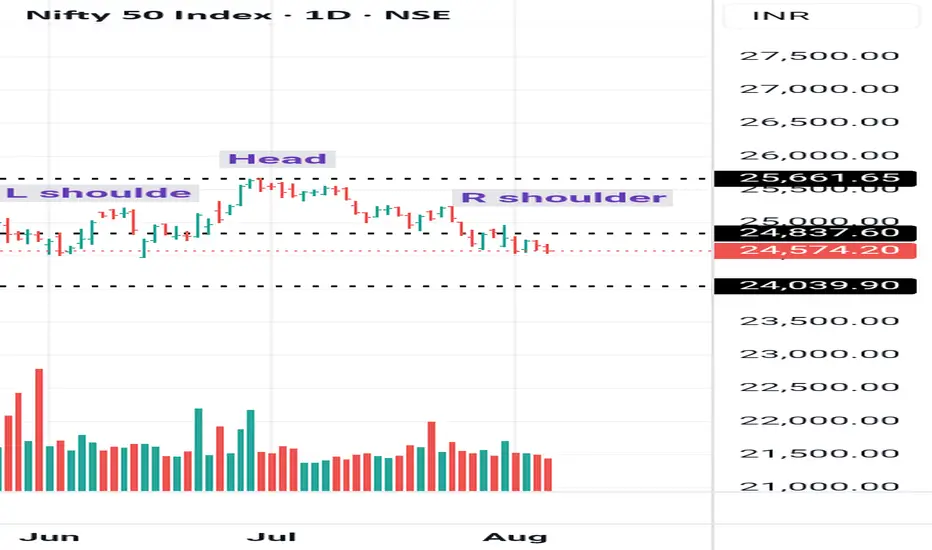
Nifty breakdown of HS patternNifty 24570 has broken down of H S pattern.technical target 24080.indicator is negatively diverged.volume falls with price.fii's have sold contracts and negetive in derivatives.we expect nifty will move down further with resistance at 24837
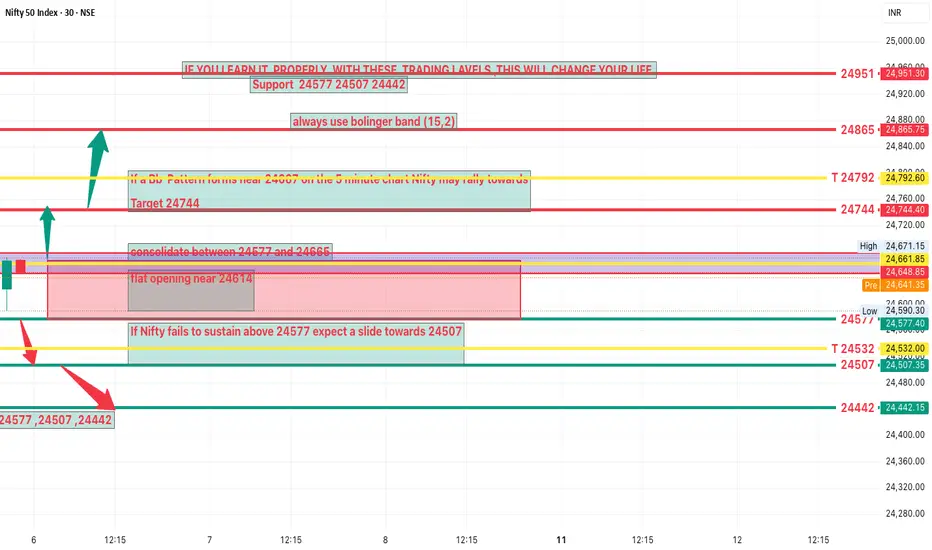
NIFTY Analysis 6 AUGUST, 2025 ,Morning update at 9 amDue to uncertainty in US tariffs on India short covering is unlikely
This global factor could lead to a flat opening near 24614
Expected Intraday Range
Likely to consolidate between 24577 and 24665
Upside Scenario
If a bb Pattern forms near 24666 on the 5 minute chart Nifty may rally towards
Target 24746
Downside Scenario
If Nifty fails to sustain above 24577 expect a slide towards
Support 24507
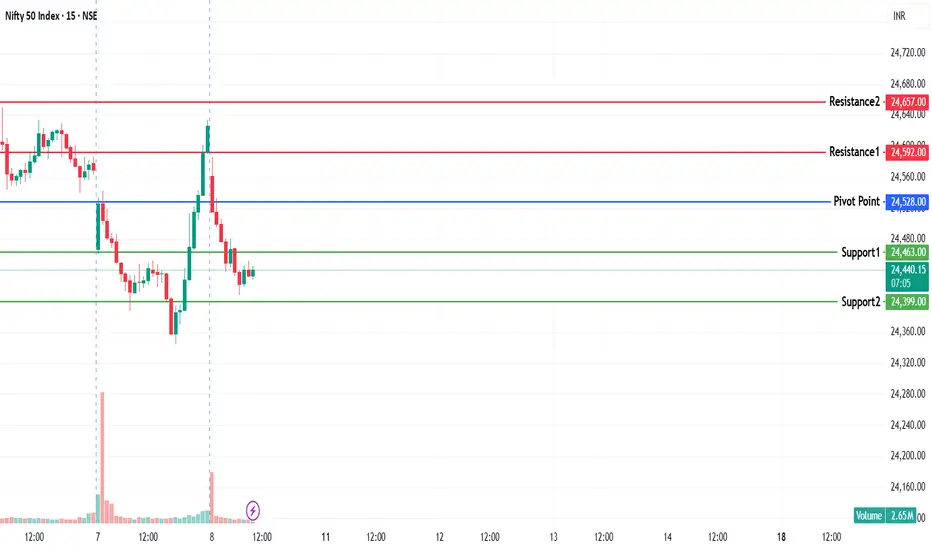
NIFTY KEY LEVELS FOR 08.08.2025NIFTY KEY LEVELS FOR 08.08.2025
Apologies for the delay in sharing this..
If the candle stays above the pivot point, it is considered a bullish bias; if it remains below, it indicates a bearish bias. Price may reverse near Resistance 1 or Support 1. If it moves further, the next potential reversal zone is near Resistance 2 or Support 2. If these levels are also broken, we can expect the trend.
If the range(R2-S2) is narrow, the market may become volatile or trend strongly. If the range is wide, the market is more likely to remain sideways
📢 Disclaimer
I am not a SEBI-registered financial adviser.
The information, views, and ideas shared here are purely for educational and informational purposes only. They are not intended as investment advice or a recommendation to buy, sell, or hold any financial instruments.
Please consult with your SEBI-registered financial advisor before making any trading or investment decisions.
Trading and investing in the stock market involves risk, and you should do your own research and analysis. You are solely responsible for any decisions made based on this research.
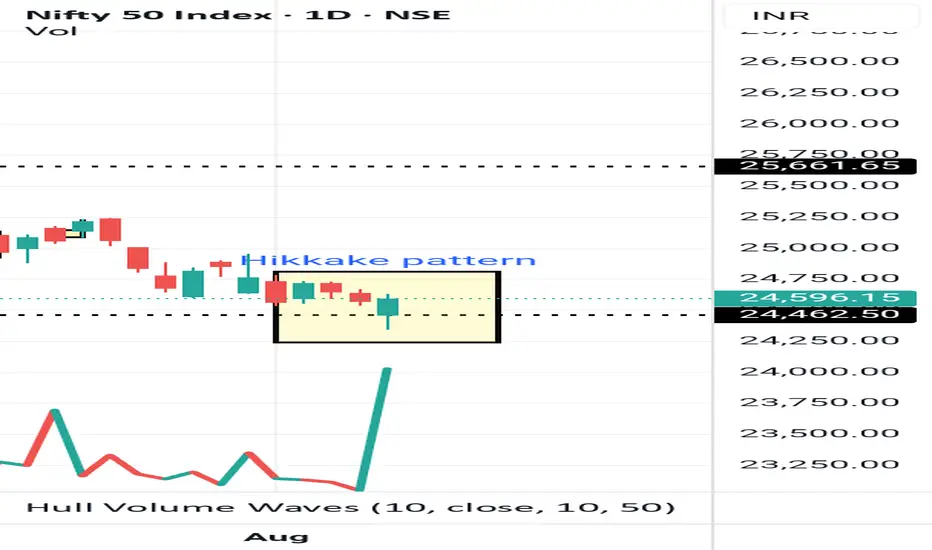
Nifty hikkake pattern.Nifty 24596 has given an excellent example for hikkake pattern to trap call writers.
Nifty Analysis - WeeklyWith simple Monthly OHLC setup - Here is the Nifty's current support for the coming week.
23935 is the level where Sharks have laid their bet.
If 23935 falls for gaining support this time then the next level is at 22195 - 21965

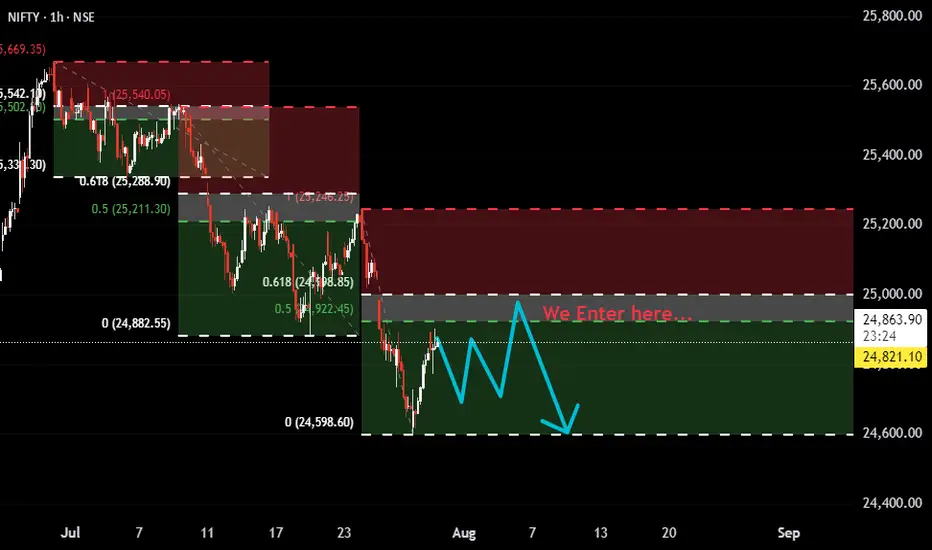
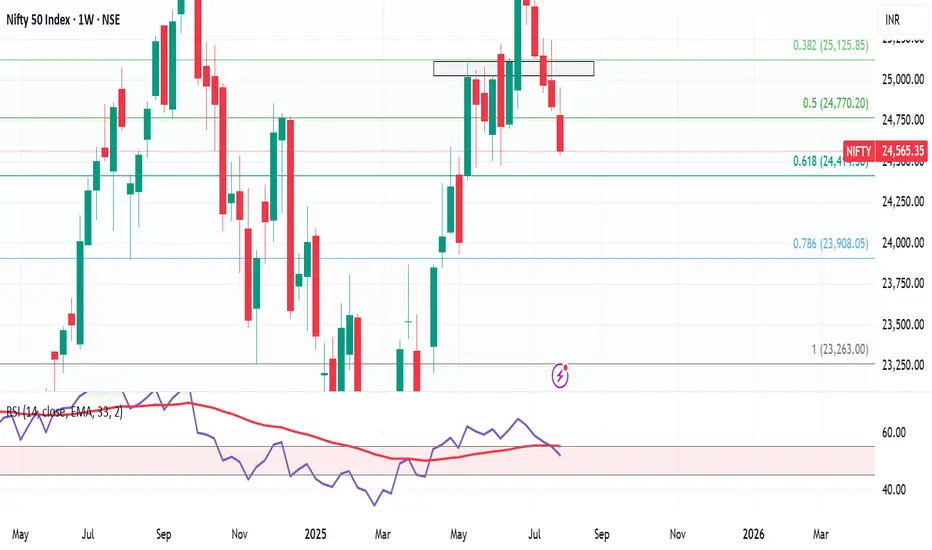
Nifty Bearish Setup: Watching 50–61.8% Fib Zone for Short EntryThis is more of an observation-based post rather than a trade setup.
It appears that Nifty, in its current bearish trend, is consistently respecting the 50–61.8% Fibonacci retracement zone before continuing downward. We’ve seen multiple pullbacks stall and reverse from this zone — making it a key area to watch.
🔸 If you're looking to short, avoid entering too early.
🔸 Let price pull back into the 50–61.8% zone, wait for structure or weakness to develop (e.g., reversal candles, BOS on lower timeframe), and then consider action.
🔸 Trying to catch tops or jumping in too soon can lead to poor entries and stop hunts.
This zone seems to be where sellers are stepping in with conviction.
Staying patient and respecting the structure can offer better entries and risk management.
⚠️ Disclaimer:
This is for educational and observational purposes only. I am not SEBI registered. Always do your own analysis before taking any trades.
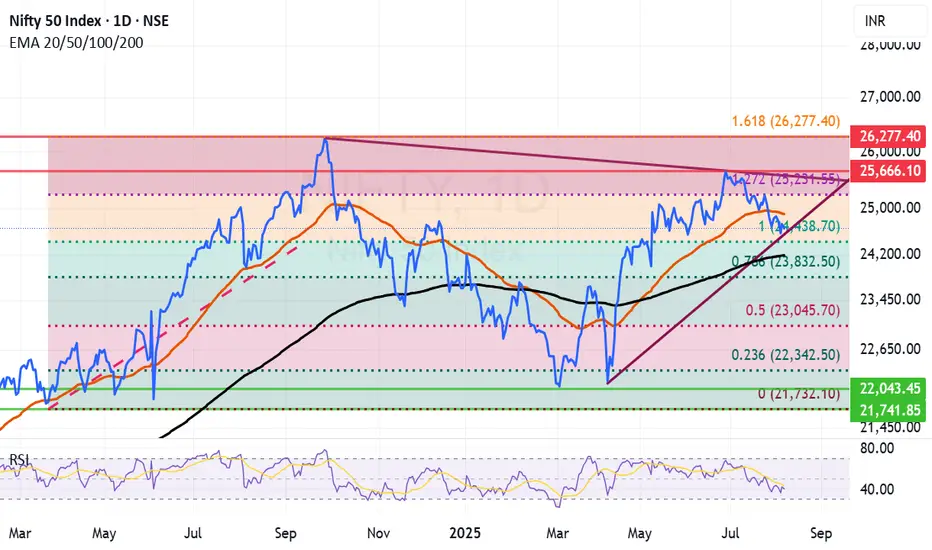
important Fibonacci retracement level approaching for NiftyVery important fibonacci retracement level for Nifty is arriving with ever increasing Trump tantrum and Indian defiance to toe US and EU line on Russian Crude and other trade practises. Market looks delicately placed at this juncture as investors fear that action from the West would undermine Indian growth story. The current fall can be utilized for shifting the balance of the portfolio towards goods that will be 100% made in India and will be consumed in India. For long term investors the current fall can be used to accumulate long term investment ideas with a horizon of 2 to 3 years.
Supports for Nifty remain at: 24438 (Important Fibonacci support), 24190 (Father line support, closing below this will enable bears to pull down Nifty towards next supports), 23832 (Next Fibonacci support), 23045 (Major Fibonacci support).
Resistance for Nifty remain at: 24896 (Mother Line Support), 25231 (Next Fibonacci resistance. A closing above this level will enable bulls to pull Nifty towards next trend line resistance), 25666 (Next Trend line resistance).
Disclaimer: The above information is provided for educational purpose, analysis and paper trading only. Please don't treat this as a buy or sell recommendation for the stock or index. The Techno-Funda analysis is based on data that is more than 3 months old. Supports and Resistances are determined by historic past peaks and Valley in the chart. Many other indicators and patterns like EMA, RSI, MACD, Volumes, Fibonacci, parallel channel etc. use historic data which is 3 months or older cyclical points. There is no guarantee they will work in future as markets are highly volatile and swings in prices are also due to macro and micro factors based on actions taken by the company as well as region and global events. Equity investment is subject to risks. I or my clients or family members might have positions in the stocks that we mention in our educational posts. We will not be responsible for any Profit or loss that may occur due to any financial decision taken based on any data provided in this message. Do consult your investment advisor before taking any financial decisions. Stop losses should be an important part of any investment in equity.
#NIFTY50 View for 5th AugNSE:NIFTY We see Nifty cycle from April low have ended, and currently correcting the rally. The first leg of the rally seem to have ended and currently should bounce in 3 waves higher and should potentially reverse for one more leg lower.And where it can find some potential buyers. We don't recommend Selling.
Some stocks are showing potential reversal signal like NSE:INDIANB Indian bank, NSE:PIDILITIND Pidilite, NSE:TATAPOWER Tata Power, NSE:TATASTEEL Tata steel to suggest the above view.

Nifty trend directionNifty 24596 has closed well gai ed the support. 24468.Volume burst suggest covering. Indicator is negatively diverged.fii's have sold contracts and pushed price high by selling derivatives.we expect nifty will face resistance at 24770 to 24855

Nifty is bullish but the concern is...Total Volume and closing were strong today — that’s a good sign.
But the only concern is that sellers' volume was 218 million more than buyers. That’s a big gap and something we can’t ignore.
NSE:NIFTY Pivot is at 24,524, and Pivot Percentile is 0.29% — that’s slightly high, so expect volatility.
If Nifty opens with a gap down and then sustains above the Pivot for 1 hour, we might see a good upside, and it would be worth chasing.
A gap-up open won’t be ideal — a controlled open near the pivot is better.
Apart from sellers’ volume, everything else looks bullish.
Even the options data is pointing toward a move up, with a target zone near 24,800.
So, my view for tomorrow is cautiously bullish.
NSE:BANKNIFTY is looking much stronger than Nifty.
This time, the rally might be led by NSE:CNXPSUBANK .
- Support: 55,294
- Resistance: 55,650
If BankNifty moves, chances are Nifty will follow as well.
Top Sectors to Watch:
NSE:CNXIT
NSE:CNXPHARMA
If you remember, I had mentioned earlier — this time when the market starts bouncing back from the bottom, IT sector will be the first to run.
That’s all for today.
Plan your trade and Trade your plan.
Take care. Have a profitable tomorrow.
$nifty50ok so alts all in position and waiting for dominace to nuke some mroe till then lets see whats up with our Nifty
rsi looks to be bottoming just a little volume and we reclaim above line and rsi curls up
little bit more for up up and away may or may not sweet the 200

Nifty is resting on support, likely to retrace from hereNifty is resting on support, likely to retrace from here. This fall is attributed to incresed US Tariff from 25 to 50 % to India

Weekly Market Wrap – Nifty Slides, Global Sentiment WeakensNifty ended the week on a bearish note, closing at 24,565, down 270 points or nearly 1.1% from last week's close. It touched a high of 24,956 and a low of 24,535, perfectly respecting the range I shared last week: 25,300–24,400.
As I highlighted earlier, the inverted hammer formation gave the bears an upper hand—and the index corrected 1.74% from the recent highs. My view continues to favor caution, with the expected trading range for the upcoming week at 25,000–24,100.
Key Levels to Watch:
Support Zone: 24,400 (key bounce area), followed by 24,100 / 23,900 in case of further breakdown.
Resistance Zone: Upside capped near 25,000.
If the market holds 24,400 around 6th–7th August, expect a short-term bounce. However, if this level is breached, expect dips to 24,100 or 23,900, which could offer short-covering opportunities.
Global Cues:
The S&P 500 also had a rough week, closing at 6,238, down 2.5% week-on-week. This decline sparked a wave of selling across global markets. The 6,200 level is crucial—if it holds, we might see a rebound globally, including in Indian equities. Below that, 6,100 remains the breakout retest zone, which I believe should provide some cushion.
💡 Strategy Going Forward:
Focus on stocks showing relative strength in this falling market—they’ll likely lead the rally once sentiment turns.
Avoid chasing rallies, and watch for signs of bottoming out near key support zones.
Keep an eye on global indices like the S&P 500 and Dow Jones, as their stability will dictate near-term direction for Indian markets.
Stay sharp, stay prepared. Let the bears have their moment, but be ready to pounce when the tide turns.
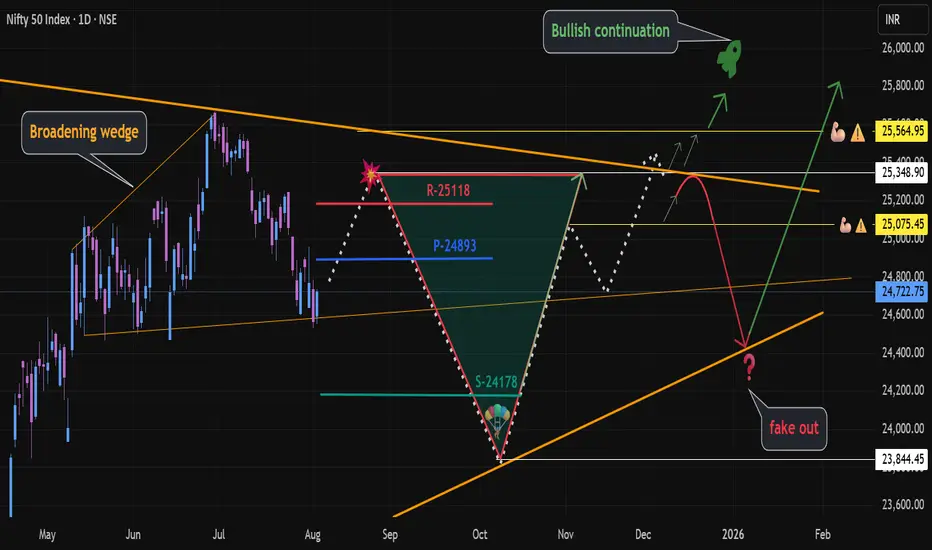
NIFTY 50 – 1D TF: Expanding Triangle DynamicsInside the triangle we saw a triangle again
Pattern: Classic Broadening wedge —higher highs & lower lows = volatility + indecision
Microstructure: Within the Triangle, a smaller broadening wedge formed, signaling coiling price before potential range expansion.
Sideways & expanding = distribution or re-accumulation phase. (For 1D TF Macro Triangle outlook scroll ↧)
Markers:
🥵Resistance
🥶Pivot
🤢Support
💪🏼⚠️Key levels
💥 Order block from Supply Line breakdown
🪂 Our main Man
❓U-🔻Turn Fake Out, lets see how it goes!
🚀 Let me know your views
Technical Insight
Broadening wedge 📐:
Often signals high emotional volatility— smart money accumulates in the chaos while retail gets whipsawed. Market is struggling to agree on fair value — hence breakout/breakdown traps are common.
Progressively a rejection from the supply💥 line zone could result in a lower high, leading to sharp retracement toward 24,000 or lower → our main man 🪂
Liquidity Grab Setup:
If NIFTY dips near 🪂 23,844 and forms a V-reversal, it could be a liquidity spring towards 25,350 🚀
🚫 Critical Checks to Avoid False Breakouts
Watch out 🪂💥❓
Liquidity Trap: Ignore breakouts with volume < 1.5x avg.
Expiry Week: Reduce position size (PCR/OI noise increases).
VIX Filter: No shorts if VIX < 15 (low volatility traps).
📊 Fundamental Alignment
Macro Tailwinds:
Q2 GDP prints strong: India remains among the fastest-growing economies.
FIIs have returned in phases post-June; DII participation remains robust.
Inflation cooling (CPI near 5%) + expectation of status quo on rates by RBI = positive for equities.
💹Risk Catalysts
Global volatility from US yields, Fed guidance, and oil prices could influence near-term moves.
Upcoming domestic events (elections, fiscal data, monsoon trend) may impact sentiment around key supply zones.
🛠️ Strategic Outlook
Validated (Bullish Continuation)
Setup: Bounce off 24,178 → breakout above 25,118 → reclaim 25,565
Bias: Bullish breakout
Trigger: Daily close above 25,565 with volume
Invalidated (Fakeout then Breakdown)
Setup: Pop above 25,118 → rejection from OB → lower high → flush toward 23,844 and Lower
Bias: Bearish
Trigger: Bearish engulfing near 25,350
Always DYOR,
See you on the other side
💡 Reflective Close:
In expanding structures, the real edge isn’t prediction — it’s patience.
Are you managing risk through structure or emotion through bias?
Nifty 50 Outlook and Derivatives Analysis — 04 Aug 2025
1. Market Snapshot — Nifty 50 on 01 Aug 2025
On Friday, 1 August 2025, the Nifty 50 opened at 24,734.90, surged to an intraday high of 24,784.15, hit a low of 24,535.05, and closed at 24,565.35 — a net decline of 203 points or approximately –0.82% from the prior close (~ 24,768.35). The session began cautiously, briefly challenging early resistances before turning lower amid broad profit-taking. Selling intensified in the latter half of the day, as weak global cues dragged indices, causing price to revisit intraday lows near 24,535. Despite bulls’ attempt to reclaim the 24,780–24,800 zone, they were swiftly pushed back. The closing fall erased mid-week gains, reflecting scattered sectoral weakness. Volume levels were steady but breadth remained negative, pointing to limited conviction from buyers. In summary, a mixed start followed by technical weakness allowed the index to close below the opening mark, reinforcing a mildly bearish bias ahead of the new trading week.
2. Top Gainers & Losers — 01 Aug 2025 (Nifty 50 Stocks)
• Top Gainers: Clean Science (SCIEN), G R Infraprojects (GRINFRA), HDFC Bank (HDFCBANK), Vodafone Idea (IDEA), and Tata Motors (TATAMOTORS) were identified among Nifty 50’s top gainers based on high relative strength and trading momentum. Exact open prices or point-by-point moves were not disclosed in publicly available platforms.
• Top Losers: Sun Pharma, Dr. Reddy’s, Adani Enterprises, Tata Steel, and Cipla were the largest decliners in the index, with losses ranging from –3% to –4.5% intraday. Sun Pharma led the downturn, falling approximately 4.5%, while Dr. Reddy’s and Tata Steel saw sharp cuts following weak results and sectoral headwinds.
Overall, sectors like pharma, metals, auto, and IT weakened sharply, whereas only PSU banks, select infra names, and defense-heavyweights displayed relative resilience. No Nifty stock posted gains above +3%; FMCG and life insurance stocks provided only modest support.
3. Support & Resistance for 04 Aug 2025 — OI & Range Analysis
• Max Call OI (Resistance): The ₹25,000 strike shows the highest open interest among call options for the upcoming weekly expiry, suggesting strong resistance and short interest around 24,900–25,000.
• Max Put OI (Support): The ₹24,500 put strike has the largest position buildup, implying a solid floor near 24,500.
• Trading Range: The implied trading band for Monday appears to be 24,500–25,000, within which price is expected to oscillate without fresh catalysts. A sustained break either below 24,500 (toward 24,200–24,300) or above 25,000 (toward 25,200–25,400) may reinforce directional momentum.
4. Technical Indicators & Timeframe Signals
▪ RSI (14 Day)
RSI is hovering around 40–42, indicating mild bearish pressure but not deeply oversold—implying limited momentum left for a sharp bounce.
▪ MACD
MACD remains negative with the MACD line below the signal line and shrinking red histogram bars, suggesting that while the downtrend persists, its momentum may be easing.
▪ Pivot Points (Classic Method)
Calculated from the previous session’s high, low, and close:
• Pivot ≈ 24,628,
• R₁ ≈ 24,721, R₂ ≈ 24,877,
• S₁ ≈ 24,472, S₂ ≈ 24,379.
Notably, R₂ (~24,877) aligns closely with OI resistance; S₁ (~24,472) is just below the key 24,500 support.
• A bullish demand zone exists around 24,500–24,550, where price consistently found buyers intraday—correlating with put OI at 24,500.
• A bearish supply zone forms near 24,900–25,000, where intraday rallies repeatedly failed—reinforced by high call OI at the 25,000 strike.
Traders may look for long entries near 24,550 with tight stops and consider trimming positions toward the high 24,900 levels.
5. Gann Outlook — Extended Support, Forecasted Resistance
Using Gann’s classic rules and midpoint levels:
• Midpoint of the 52 week range (≈ 26,277 high, ≈ 21,744 low) places a significant reference at ≈ 24,000, a level still respected as long as the index trades above it.
• Gann’s square of nine and angle methods highlight 25,000–25,100 as a natural resistance band—coincidentally matching the options-derived resistance zone.
• Downside remains capped near 24,000; below it, negative Gann-based extension targets emerge (e.g., approx. 23,800). Conversely, a hold above 24,500 could lead to a rebound toward 25,200–25,600, consistent with Gann-era time cycles and chart patterns.
Conclusion & Trading Outlook
As Nifty opens on 04 August 2025, it is snugly contained within a 24,500–25,000 trading channel. The index is attempting to stabilize near 24,565, down ~0.82% from Friday, while technical momentum tools (RSI, MACD) remain subdued. Support at ≈ 24,500 is anchored by strong put writing and order block demand; resistance at ≈ 25,000 is buttressed by call OI, pivot calculations, and Gann psychological significance.
With no breakout signals yet, expect range bound trading: dips should find support near 24,500, and rallies are likely to stall near 24,900–25,000 unless global triggers emerge. A breakdown below 24,500 may lead to 24,200–24,300; a clean break above 25,000 on volume could open pathways toward 25,200–25,400.
Suggested strategy:
• Consider shorts near 24,900–25,000 with tight stops just above 25,050.
• Explore longs near 24,500–24,550, with stops sub 24,450 targeting 24,700–24,800.
Traders should remain focussed on cues from U.S. markets, currency moves, FII flows, and commodity cycles—these often influence directional biases in the early part of each week. For now, the bias remains cautiously bearish, though technical oversold signals plus firming near term support may offer a tradable rebound setup if news flows improve.
Conclusion-
Disclosure: The publisher of this idea is not a SEBI registered analyst. The information shared here is solely for educational purposes and should not be interpreted as financial advice. Always consult with a qualified financial advisor before making any investment decisions. The publisher does not endorse social media shares on any platform.

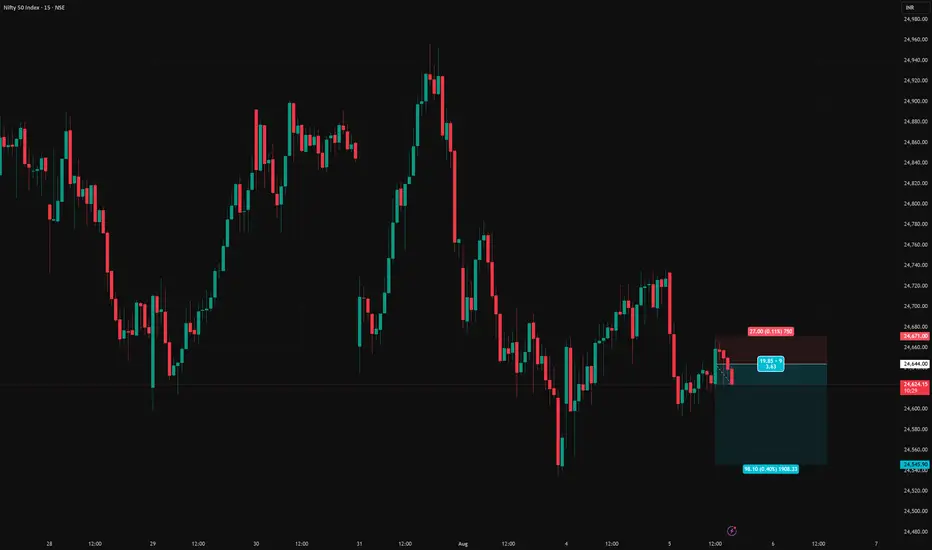
NIFTY short setupNifty short setup
Entry - 24644.00
Stop loss - 24671.00
Target - 24545.90
Risk Reward - 1:3.6