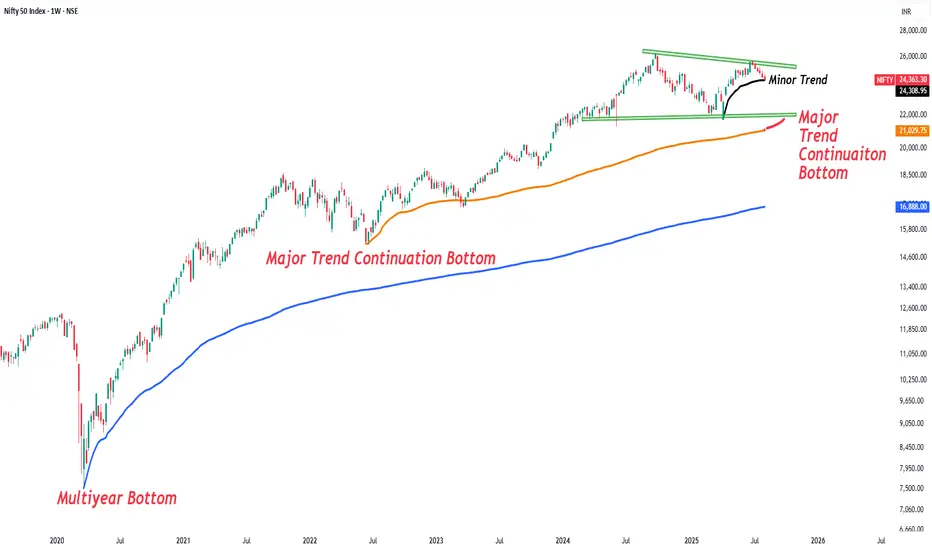
Buying Zone for NIFTY If we check only price price then may be price tests its lower boundary near 21700 (Major Trend continuation Bottom) but if we mix FIIs data and market sentiment then probably Nifty bounce from here (Minor Trend AVWAP Support )
NIFTY trade ideas
Weekly Market Outlook – Nifty & S&P 500 AnalysisNifty closed the week at 24,363, down 200 points from the previous week’s close, after making a high of 24,736 and a low of 24,337. As highlighted last week, Nifty traded exactly within my projected range of 25,000–24,100, but the negative takeaway is that it has now closed below the crucial support of 24,400.
If Nifty sustains below 24,300 next week, there is a strong probability of it testing 24,000/23,900 support levels. My outlook for the coming week: expect movement within 24,800–23,900, with a potential bounce from 24,000/23,900.
Interestingly, this marks the 6th consecutive week of Nifty closing lower — something that last happened 12 years ago in August 2013. Historically, after five straight weeks of selling, we usually see at least one green candle. If that bounce comes next week, my focus will be on whether selling resumes afterward or finally takes a breather.
Remember the timeless stock market wisdom:
“When everyone is fearful, be greedy. When everyone is greedy, be fearful.”
For long-term investors waiting for a dip, the opportunity is here — consider accumulating fundamentally strong companies for the long haul. Traders, brace for volatility.
S&P 500 Outlook:
The S&P 500 closed 150 points higher than last week, validating my prediction of holding 6,200. On the weekly chart, the index is showing signs of forming an M-pattern — a bearish setup. To negate this, the S&P 500 must sustain above 6,400, which could extend its rally towards 6,454/6,500 and the key Fibonacci level of 6,568.
However, if it fails to hold 6,400, we could see a retest of 6,225. Investors in U.S. markets should trail their stop-losses to protect gains.
Key Levels to Watch Next Week:
Nifty: Support – 24,000/23,900 | Resistance – 24,800
S&P 500: Support – 6,225 | Resistance – 6,454/6,500/6,568

Learning#05 : Decoding Highs and Lows📚 Learning#05 : Decoding Highs and Lows
- A Trader’s Guide to Reading the Market - Simple Yet Important
If the market were a book, the trend would be its storyline — and as traders, our job is to read that story without skipping pages. Trading with the trend puts the odds in your favor because you’re flowing with the market’s natural momentum, not fighting it.
Whether it’s an uptrend, downtrend, or a sideways grind, spotting it early gives you a big edge in deciding when to enter, when to exit, and when to simply step aside.
One of the simplest yet most reliable ways to read that story?
👉 Story of Highs and Lows
Let’s break it down.
📚 Understanding Highs and Lows in Trading
In technical analysis, highs and lows are the market’s way of leaving breadcrumbs.
A high is a peak before the market pulls back.
A low is a trough before the market bounces.
Track these points over time and you start to see patterns that reveal the market’s mood — bullish, bearish, or indecisive.
This isn’t about guessing; it’s about observing price action as it is.
📌 The Four Key Building Blocks of Market Structure
1️⃣ Higher Highs (HH)
Each new high is higher than the one before.Paired with higher lows, this signals an uptrend. Buyers are in control, and demand is pushing price upward.
Example: Nifty rallies from 22,000 to 22,200, pulls back to 22,100, and then rallies to 22,350. That second high (22,350) is higher than the first, confirming bullish momentum.
2️⃣ Higher Lows (HL)
Each pullback low is higher than the last.This tells you that sellers tried to push the market down — but buyers stepped in sooner this time, showing strength.
HLs often precede trend continuation and give great spots for entering long positions with tight risk.
3️⃣ Lower Lows (LL)
Each new low is lower than the previous one.Paired with lower highs, this marks a downtrend. Selling pressure is in charge, and rallies are being sold into.
4️⃣ Lower Highs (LH)
Each bounce high is lower than the last.This shows weakening buying pressure and often leads to another push lower.
Think of it like climbing stairs vs. walking down a hill:
📌 HH + HL = Stairs up → Bull trend.
📌 LL + LH = Hill down → Bear trend.
📈 HH+HL : Bullish Setup :
📉 LL+LH : Bearish Setup :
📌 Why It Matters for Traders
Price action is the most honest information in the market — no lag, no magic, no guesswork.
HH/HL → Bulls in control → Look for long setups.
LL/LH → Bears in control → Look for short setups.
Spotting these patterns on the fly means you can align with the dominant side instead of fighting it.
🧩 Combining HH & LL With Other Tools
📏 Fibonacci Retracements
Once you’ve identified the trend:
In an uptrend, draw Fibonacci from the latest HL to HH for pullback buying zones.
In a downtrend, draw from the latest LH to LL to find shorting opportunities.
⛰️ Fractals for Clarity
Fractals help pinpoint swing highs and lows without guesswork. I personally track HH/HL/LL/LH on a 1-minute chart for intraday trading — this keeps me in sync with the micro-trend while avoiding sideways traps.
🔀 Trendlines & VWAP
Trendlines show the bigger path, VWAP confirms intraday balance. When HH or LL aligns with these, you’ve got high-confluence setups.
🥷 Kiran’s Approach
For intraday, I start by mapping the structure: HH, HL, LL, LH. This gives me the immediate trend bias and alerts me to potential reversals early. I track them on a 1-min chart, combine with Fibonacci and trendlines, and trail stops as the structure unfolds.
It’s simple, visual, and keeps me out of bad trades and warns me to stay out of a sideways market situation, too.
🔑 Key Takeaway
Market structure is like a language — HH, HL, LL, and LH are its alphabet. Once you learn to read it, you’ll never trade blind again.
💡 “Trade what you see, not what you think. The chart always whispers first — you just have to listen.”
Start marking highs and lows on your chart tomorrow. Watch the story unfold. Trade in sync, and you’ll notice your entries become sharper, your exits cleaner, and your confidence higher.
See you in the next one — and until then:
Keep it simple. Trade with structure. Trust the levels.
— Kiran Zatakia
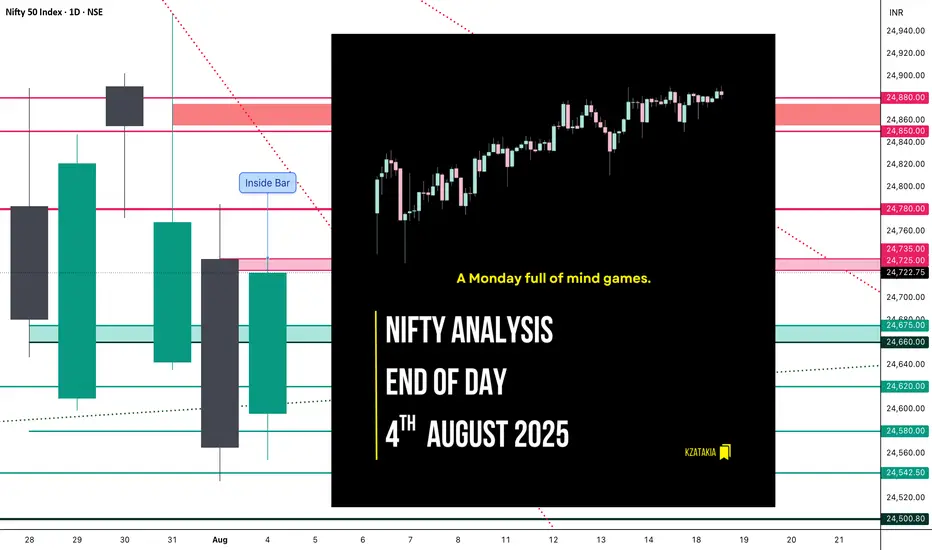
Nifty Analysis EOD – August 4, 2025 – Monday🟢 Nifty Analysis EOD – August 4, 2025 – Monday 🔴
A Monday full of mind games.
Nifty opened with a slight positive gap and immediately tested the TC of CPR, but that optimism didn’t last long — sharp rejection took it to day’s low (24,554). What followed was a rollercoaster: a 100-point recovery, a 50-point pullback — all within 10 minutes. This wild price action defined the rest of the day.
Throughout the session, Nifty remained trapped within the CPR zone. Both sides experienced multiple fakeouts, especially around initial balance (IB) zones. Even when prices nudged toward R1, repeated failed attempts to break above reflected the market’s indecisiveness. The day finally closed near the high, but conviction was still lacking.
Many option buyers likely struggled due to deceptive shadows and unexpected fractal breakouts. The entire price action stayed within Friday’s range — forming an Inside Bar structure on the daily chart. This suggests a potential range breakout trade tomorrow.
The market faced resistance near the Fibonacci 0.618–0.786 retracement of the prior fall — aligning with 24,740–24,780 zones. A close above 24,780 tomorrow could shift momentum back in the bulls’ favour. If not, bears still hold the upper ground.
📈 5 Min Time Frame Chart with Intraday Levels
📉 Daily Time Frame Chart with Intraday Levels
📊 Daily Candle Breakdown
Open: 24,596.05
High: 24,736.25
Low: 24,554.00
Close: 24,722.75
Change: +157.40 (+0.64%)
Candle Type:
🟢 Bullish Marubozu-like — reflects a strong control by buyers after early weakness.
Structure Breakdown:
Real Body: 126.70 pts (Bullish)
Upper Wick: 13.50 pts (Minor resistance near close)
Lower Wick: 42.05 pts (Early dip got bought aggressively)
Key Insight:
Closed near the high of the day — positive bias for tomorrow
Inside Bar formed – Expect a breakout trade
24,780+ closing will turn sentiment bullish
🛡 5 Min Intraday Chart
⚔️ Gladiator Strategy Update
ATR: 209.36
IB Range: 115.95 → Medium
Market Structure: Balanced
Trade Summary:
🕚 11:30 AM – Long Entry → SL Hit
🕛 12:30 PM – Long Entry → SL Hit
🕐 13:10 PM – Short Entry → SL Hit
Tough day — strategy got chopped in noise-heavy moves.
🔍 Support & Resistance Levels
Resistance Zones:
24,725 ~ 24,735
24,780 ~ 24,795
24,860 ~ 24,880
Support Zones:
24,675 ~ 24,660
24,620
24,542 ~ 24,535
24,500
24,470 ~ 24,460
💭 Final Thoughts
"Markets love to test your patience before they reward your conviction."
Today was a lesson in restraint — avoid overtrading when structure lacks clarity. Inside bar gives us a clean slate for tomorrow. Let price lead.
✏️ Disclaimer
This is just my personal viewpoint. Always consult your financial advisor before taking any action.
Learning#04 : PDH & PDL🎯 Learning#04 : PDH & PDL
- The 2 Levels Every Intraday Trader Must Watch
Turn Yesterday’s Levels into Today’s Profits – PDH/PDL Playbook
In intraday trading, simplicity often beats complexity.
You don’t always need fancy indicators, dozens of lines, or complicated systems. Sometimes, two levels are all it takes to stay in sync with the market:
👉 Previous Day’s High (PDH)
👉 Previous Day’s Low (PDL)
These levels may look basic, but they carry psychological weight and often mark where real action — and opportunity — unfolds.
Let’s break it down into a practical strategy you can start using as early as tomorrow morning 👇
🧠 What Are PDH and PDL?
PDH = The highest price the market reached yesterday
PDL = The lowest price the market reached yesterday
That’s it. No calculations. No indicators. Just two simple levels from the previous session.
But here’s why they matter:
They’re visible to everyone — retail traders, institutional desks, even algo systems. These are “memory zones” where the market often reacts — bouncing, breaking, or trapping traders in fakeouts.
Think of them as psychological boundaries.
When price approaches these levels, traders ask:
“Will it break or bounce?”
That hesitation — that moment of decision — is your opportunity.
⚡ Why These Levels Work So Well
✅ They’re objective — no subjectivity involved. Anyone can mark them.
✅ They’re reaction zones — price often stalls, breaks, or rejects here.
✅ They reflect sentiment — how price behaves around them reveals market strength or weakness.
PDH and PDL often act like turning points — or springboards for continuation. The key is in reading how price behaves when it gets there.
📊 3 Smart Ways to Trade Around PDH/PDL
Let’s look at three powerful setups based on how price behaves near these levels:
1️⃣ Rejection at PDH or PDL (Classic Reversal)
This is the simplest setup — and one of the most effective.
When price tests PDH or PDL but fails to break, it often leaves signs:
Long upper/lower wicks
Rejection candles (like pin bars or inside bars)
Sudden volume drop
💡 Example:
Nifty rallies to PDH at 22,180, prints a long upper wick, then forms a red candle closing below. That’s a reversal clue.
You could enter short below the rejection candle, with a stop just above the high and a target near VWAP or mid-range.
🎯 Why this setup works: Tight risk. Logical context. High clarity.
2️⃣ Breakout and Retest (Trend Continuation)
If price breaks through PDH/PDL with strength, don’t chase it.
Wait for price to pull back and retest the level.
If PDH was broken, wait for a bullish retest — former resistance becomes support.
If PDL was broken, wait for a bearish retest — former support becomes resistance.
💡 Example:
BankNifty breaks PDH, pulls back, then prints a bullish engulfing candle right at the level — confirmation to go long.
📌 This setup works best on trending days and offers cleaner entries than chasing breakouts.
3️⃣ The Failed Breakout (Trap Setup)
One of the most high-probability setups — and one that traps many.
Here’s how it plays out:
Price breaks PDH/PDL
But immediately snaps back inside the range
Traders who chased the breakout are now trapped
💡 Signal to watch:
A candle closes above PDH, followed by a candle that closes back below — that’s your short signal. Reverse for long setups around PDL.
🚨 Even more effective when the breakout happens on low volume — no real conviction behind the move.
🔧 Tools That Amplify These Setups
These setups work great with a clean chart — but a few tools can boost your edge:
VWAP: Check if price is extended or supported near PDH/PDL. When VWAP aligns with these levels — confluence zone!
Candlestick patterns: Look for pin bars, inside bars, or engulfing patterns at the level.
Opening range: If price breaks PDH/PDL early in the day,
especially within the first 30 minutes, it signals directional intent.
Volume: Strong breakouts need volume. Weak volume = likely fakeout.
🔑 Remember: You don’t trade the level — you trade the reaction at the level.
✅ Why This Simple Strategy Works
Don’t underestimate the power of PDH and PDL. These levels:
Show where emotions exist — greed and fear often play out here.
Create natural reaction zones — ideal spots for clean entries and exits.
Let you trade with structure, not guesswork.
Instead of chasing price all day, do this:
Mark PDH and PDL
Wait for price to approach the zone
Watch how it behaves
React with a plan — not emotion
✨ Simple, repeatable, and highly effective — if you stay patient and disciplined.
✍️ Final Thoughts
In a world full of overcomplicated strategies, PDH/PDL trading is a refreshing reminder that clarity often comes from simplicity.
These levels won’t give you 10 trades a day — but they will give you high-quality, context-driven opportunities that align with how real price and volume work.
See you in the next one — and until then:
Keep it simple. Trade with structure. Trust the levels.
— Kiran Zatakia

Nifty levels - Jul 04, 2025Nifty support and resistance levels are valuable tools for making informed trading decisions, specifically when combined with the analysis of 5-minute timeframe candlesticks and VWAP. By closely monitoring these levels and observing the price movements within this timeframe, traders can enhance the accuracy of their entry and exit points. It is important to bear in mind that support and resistance levels are not fixed, and they can change over time as market conditions evolve.
The dashed lines on the chart indicate the reaction levels, serving as additional points of significance to consider. Furthermore, take note of the response at the levels of the High, Low, and Close values from the day prior.
We hope you find this information beneficial in your trading endeavors.
* If you found the idea appealing, kindly tap the Boost icon located below the chart. We encourage you to share your thoughts and comments regarding it.
Wishing you success in your trading activities!

#Nifty - Pivot Point: 25031.63Date: 18-07-2025
#Nifty Current Price: 25025
Pivot Point: 25031.63 Support: 24794.06 Resistance: 25270.32
#NiftyUpside Targets:
Target 1: 25376.92
Target 2: 25483.53
Target 3: 25652.99
Target 4: 25822.45
#NiftyDownside Targets:
Target 1: 24686.89
Target 2: 24579.73
Target 3: 24410.26
Target 4: 24240.80
#TradingView #Stocks #Equities #StockMarket #Investing #Trading #Nifty
#TechnicalAnalysis #StockCharts #Finance

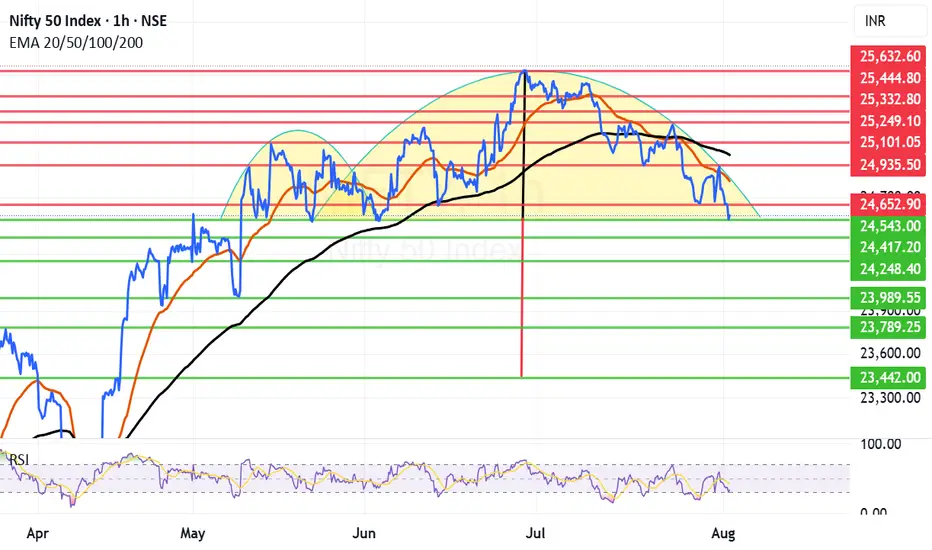
Reverse cup and Handle kind of structure formed in NiftyIn the short term time frame Nifty is seen to be forming reverse cup and handle kind of structure this is considered very bearish structure. However for this bear fest to manifest Nifty needs to close below 24543 or 24417. These 2 levels can save Nifty if not we will see it going into the bear grip.
Thus the most important supports for Nifty remain at 24543 and 24417. Below this level the supports for Nifty will be at 24248, 23989, 23789 and finally major support are is near 23442.
Important resistance areas for Nifty remain at 24652, 24821 (Mother Line Resistance), 24935, 25011 (Father Line Resistance), 25101 and finally 25249. Above 25249 Bulls can become very active.
Till the trade deal chess board and Tariffs do not relent or there is some other very important positive news Nifty will remain under pressure. Let us hope that 24253 or 24417 save us. Long term outlook on Nifty still remains positive. Long term investors should look at the tariff related event as a news that will slowly subside and give way to the Bullish outlook which has been prevailing in the market for decades all together.
Disclaimer: The above information is provided for educational purpose, analysis and paper trading only. Please don't treat this as a buy or sell recommendation for the stock or index. The Techno-Funda analysis is based on data that is more than 3 months old. Supports and Resistances are determined by historic past peaks and Valley in the chart. Many other indicators and patterns like EMA, RSI, MACD, Volumes, Fibonacci, parallel channel etc. use historic data which is 3 months or older cyclical points. There is no guarantee they will work in future as markets are highly volatile and swings in prices are also due to macro and micro factors based on actions taken by the company as well as region and global events. Equity investment is subject to risks. I or my clients or family members might have positions in the stocks that we mention in our educational posts. We will not be responsible for any Profit or loss that may occur due to any financial decision taken based on any data provided in this message. Do consult your investment advisor before taking any financial decisions. Stop losses should be an important part of any investment in equity.
Nifty near strong support level 📊 Nifty Chart Update!
Nifty is now trading near a strong support level 🛑
Watch closely for a possible reversal or bounce from this zone! 🔄📈

#Nifty directions and levels for July 30th:Good morning, friends! 🌞
Here are the market directions and levels for July 30th:
There have been no major changes in the global market. The global sentiment remains moderately bullish,
while the local market continues to show a bearish tone.
Today, Gift Nifty indicates a gap-down opening of around 40 points.
What can we expect today?
In the previous session, both Nifty and Bank Nifty took a solid pullback after the gap-down start.
However, neither of them broke the 38% Fibonacci level in the current swing.
So, unless the 38% level is broken, we should continue to approach the market with a bearish view.
At the same time, key parameters have been lagging recently, which has made it difficult for the market to take a clear direction.
My primary expectation is consolidation within the previous day's range.
However, if the market breaks the bottom with a solid structure, then we can expect the correction to continue.

From Demand to Glory: Nifty’s Bullish March to 25,220 Nifty Bullish Outlook
-Current Price: 24,905 (approx)
- Key Demand Zone: 24,620 – 24,660
- Key Supply Zone: 25,200 – 25,240
Technical View
- Strong Demand Bounce: Nifty reversed sharply from the demand zone (24,620–24,660),
indicating strong buying interest.
- Trend Breakout Potential: Price is approaching resistance near 24,920; a breakout could push
towards the supply zone at 25,220 (target).
- Momentum Structure: Higher lows formed after the demand zone test, showing bullish
strength.
News & Data Supporting Bullish Bias
- India’s Q1 GDP Growth: The latest estimates show strong economic growth, supporting equity
market sentiment.
- FIIs Turning Buyers: Foreign Institutional Investors (FIIs) have been net buyers over the past
few sessions, supporting index upside.
- Global Market Tone: US and Asian equities are stable, and crude oil prices are moderating,
supporting risk appetite.
- RBI Policy Outlook: Market expects no immediate rate hikes, keeping liquidity positive for
equities.
Expectation
If Nifty sustains above 24,900, we expect a bullish move towards 25,220 in the short term.
Stop-loss: Below 24,780 (to manage risk).

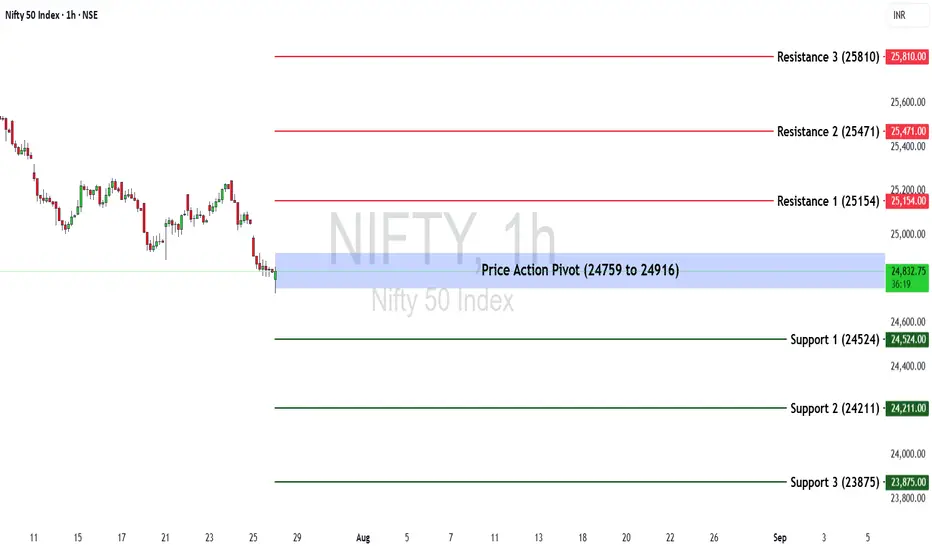
Nifty 50 at a Turning Point? Key Levels & Market Outlook AheadThe Nifty 50 ended the week at 24,837.00, registering a decline of -0.53%.
🔹 Key Levels for the Upcoming Week
📌 Price Action Pivot Zone:
24,759 to 24,916 – This range is crucial for identifying potential trend continuation or reversal. A move outside this zone could set the directional tone for the coming sessions.
🔻 Support Levels:
Support 1 (S1): 24,524
Support 2 (S2): 24,211
Support 3 (S3): 23,875
🔺 Resistance Levels:
Resistance 1 (R1): 25,154
Resistance 2 (R2): 25,471
Resistance 3 (R3): 25,810
📈 Market Outlook
✅ Bullish Scenario:
A sustained move above 24,916 (top of the pivot zone) may attract buying interest. If this momentum builds, the index could test R1 (25,154), and potentially advance towards R2 (25,471) and R3 (25,810).
❌ Bearish Scenario:
Failure to hold above 24,759 (bottom of the pivot zone) may lead to further downside pressure. In such a case, Nifty may move towards S1 (24,524), and deeper support levels like S2 (24,211) and S3 (23,875)
Disclaimer: lnkd.in
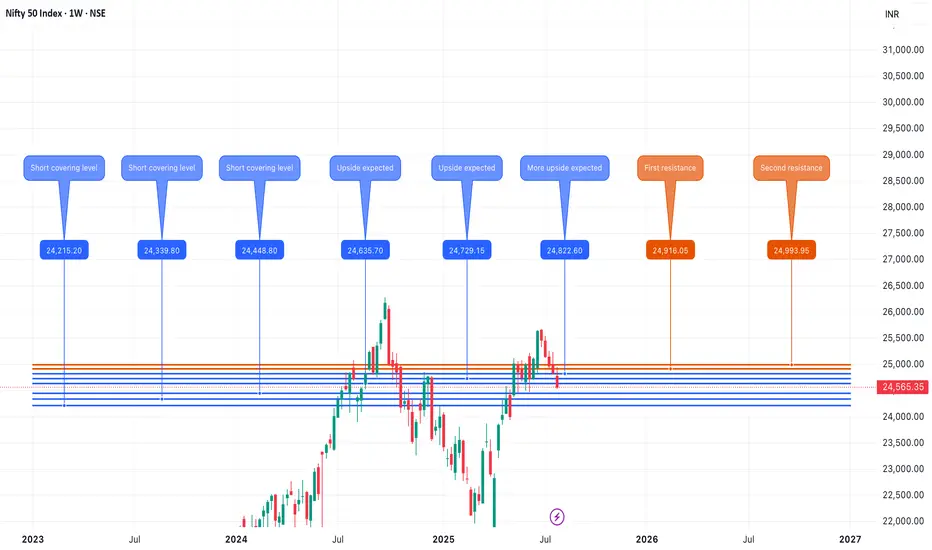
Nifty August 1st week analysisThe Nifty index looks positive for the upcoming week, despite global uncertainties and tariffs. This is a bold take, but my chart analysis supports it. The charts do not indicate a fall below 24,200 in the coming week. Three short-covering levels are marked: 24,448, 24,339, and 24,215. On the upside, a key level to watch is 24,635. If Nifty crosses and sustains above 24,635, we can expect upward momentum to continue toward 24,900–25,000. All levels are marked in the chart posted.

Nifty Analysis EOD – August 1, 2025 – Thursday🟢 Nifty Analysis EOD – August 1, 2025 – Thursday 🔴
🎢 Illusion Rally: What You See, Isn’t What It Was!
🧾 Nifty Summary
As we all expected, a negative gap-down opening occurred due to external news. Nifty opened 183 points lower, tested the 24,660–24,675 support zone, then rebounded sharply after a symmetrical triangle + VWAP breakout. The rally pierced through all key levels like a hot knife through butter, topping at 24,950, only to reverse with equal intensity. Closed at 24,765.
📌 Despite the technical structure, today’s move had no clear technical reasoning — more likely triggered by a mix of tariff news, confidence in Modi, weekly + monthly expiry, and manipulation.
📌 in spite of a bullish candle, strong upper rejection from 24,950 hints weakness. Candle appears bullish on colour, but bears dominated intraday close — forming a bearish Moboroshi Candle (illusion of strength).
📌 Bearish Moboroshi Candle Structure : close > open and close < Previous Close
🔍 Intraday Walk
📉 Gap down of 183 pts
🟢 Support held at 24,660–24,675
🔺 Symmetrical triangle + VWAP breakout
🚀 Sharp upmove to 24,950 zone
🔁 Reversal with same intensity
📉 Closed at 24,765 — below prior close
🖼 5 Min Time Frame Chart with Intraday Levels
📉 Daily Time Frame Chart with Intraday Levels
🕯 Daily Candle Breakdown
Open: 24,642.25
High: 24,956.50
Low: 24,635.00
Close: 24,768.35
Change: −86.70 (−0.35%)
Candle Structure:
✅ Green Candle (Close > Open) → +126.10 pts real body
⬆️ Upper Wick → 188.15 pts (Very Long)
⬇️ Lower Wick → 7.25 pts (Tiny)
Interpretation:
Opened near yesterday's low
Intraday sharp rally towards 24,950+
Faced strong selling at highs
Closed above open, but way below high — signals clear rejection
Candle Type:
📌 Bearish Moboroshi Candle — Appears bullish but hides weakness
🧠 Buyers strong initially, but sellers took control at the top
Key Insight:
Bulls need decisive close above 24,880–24,910
Else, expect drift back toward 24,660–24,675
🛡 5 Min Intraday Chart
⚔️ Gladiator Strategy Update
ATR: 208.29
IB Range: 93.95 → Medium
Market Structure: Unbalanced
Trades Triggered:
✅ 10:40 AM – Long Entry → Trailing Target Hit (R:R – 1:6.25)
📌 Trade Summary: Big R:R win today on breakout with trailing logic execution!
🧱 Support & Resistance Levels
🔺 Resistance Zones:
24,820 ~ 24,830
24,850
24,880 ~ 24,890
24,910
🔻 Support Zones:
24,780
24,725 ~ 24,715
24,660 ~ 24,650
24,620 ~ 24,600
💭 Final Thoughts
"When the move can’t be explained, the best position is caution."
Today's market behavior reinforces the idea that not all moves are technical. Keep your tools sharp, but don’t ignore contextual chaos.
✏️ Disclaimer
This is just my personal viewpoint. Always consult your financial advisor before taking any action.

Nifty is resting on support, likely to retrace from hereNifty is resting on support, likely to retrace from here. Us Tariff on india already decided. So Nifty should close higher than opening price on monday.

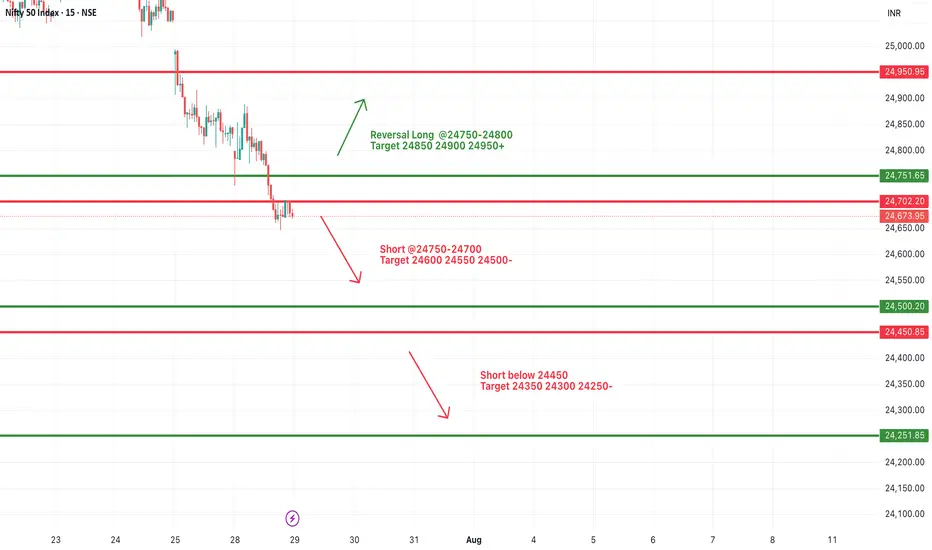
#NIFTY Intraday Support and Resistance Levels - 29/07/2025Nifty is expected to open with a gap-down today, continuing its bearish momentum seen in recent sessions. The index is now trading well below the key resistance zone of 24,750–24,800, with a visible weakness on the chart.
A short opportunity may arise if Nifty stays below the 24,750–24,700 zone. Any pullback toward this level may face selling pressure, and fresh shorts can be considered with downside targets of 24,600, 24,550, and 24,500-.
If the index breaks below the 24,450 level, the selling momentum may intensify, targeting 24,350, 24,300, and 24,250- levels intraday. This level marks a critical support, and traders should closely monitor price action here.
On the other hand, a reversal can only be expected if Nifty reclaims the 24,750–24,800 zone with strength. In that case, a bounce toward 24,850, 24,900, and 24,950+ is possible, but the reversal is only valid if strong bullish price action sustains above 24,800.
#Nifty directions and levels for August 1st:Good morning, friends! 🌞
Here are the market directions and levels for August 1st:
The global market (based on the Dow Jones) has shown a moderately bearish sentiment,
while the local market continues to display a bearish tone.
Today, Gift Nifty indicates a neutral opening.
What can we expect today?
In the previous session, both Nifty and Bank Nifty experienced high volatility.
However, the closing happened around the middle of the current swing, indicating a possible range-bound market. Until this range is broken, we cannot expect a strong directional move.
If the range breaks, we can follow the breakout direction.
In my side, the structures of Nifty and Bank Nifty appear slightly different. Nifty continues to show bearish sentiment, whereas Bank Nifty is showing signs of a mild bounce back. So, they may counterbalance each other, and if that happens, we may see a neutral closing by the end of the day.
On the other hand, if the market breaks immediate support or resistance with a solid candle or after consolidation, we can expect a directional move in that breakout direction.

Nifty 50 analysis I have done my nifty analysis as we enter august month expiry. July has been a volatile month with 5 week and corporate results.

Basics of Options: Calls and PutsWhat are Options?
An option is a financial contract that gives the buyer the right, but not the obligation, to buy or sell an underlying asset (like a stock or index) at a specific price, on or before a specific date.
Think of it like booking a movie ticket. You reserve the right to watch a movie at a particular time and seat. But if you don’t go, it’s your choice. You lose the ticket price (premium), but you're not forced to go. Options work similarly.
Options are of two basic types:
Call Option
Put Option
Let’s break both down in detail.
1. What is a Call Option?
A Call Option gives the buyer the right (but not the obligation) to buy the underlying asset at a pre-decided price (called the strike price) on or before a certain date (called the expiry date).
When do traders buy a Call Option?
When they believe the price of the underlying stock or index will go up in the future.
Example of Call Option (Simple Case)
Let’s say you are bullish on Reliance Industries stock, which is currently trading at ₹2,500.
You buy a Call Option with:
Strike Price: ₹2,550
Premium Paid: ₹30 per share
Lot Size: 250 shares
Expiry: Monthly expiry (say end of the month)
You believe Reliance will go up beyond ₹2,550 soon. If it goes to ₹2,600 before expiry:
Your profit per share = ₹2,600 (market price) - ₹2,550 (strike price) = ₹50
Net Profit = ₹50 - ₹30 (premium) = ₹20 per share
Total Profit = ₹20 x 250 = ₹5,000
But if Reliance stays below ₹2,550, say at ₹2,500 on expiry, you won’t exercise the option. You lose only the premium (₹30 x 250 = ₹7,500).
Key Terminologies in Call Options
In the Money (ITM): When the stock price is above the strike price.
At the Money (ATM): When the stock price is equal to the strike price.
Out of the Money (OTM): When the stock price is below the strike price.
2. What is a Put Option?
A Put Option gives the buyer the right (but not the obligation) to sell the underlying asset at a pre-decided price (strike price) on or before the expiry.
When do traders buy a Put Option?
When they believe the price of the underlying stock or index will fall in the future.
Example of Put Option (Simple Case)
Assume HDFC Bank is trading at ₹1,600. You are bearish and expect it to fall.
You buy a Put Option with:
Strike Price: ₹1,580
Premium: ₹20 per share
Lot Size: 500 shares
Expiry: Monthly
If HDFC Bank falls to ₹1,520:
You can sell at ₹1,580 even though market price is ₹1,520
Gross profit per share = ₹60
Net profit = ₹60 - ₹20 = ₹40 per share
Total profit = ₹40 x 500 = ₹20,000
If HDFC stays above ₹1,580, your put expires worthless. You lose only the premium (₹10,000).
Key Terminologies in Put Options
In the Money (ITM): Stock price below strike price.
At the Money (ATM): Stock price = strike price.
Out of the Money (OTM): Stock price above strike price.
Who are the Two Parties in an Option Contract?
1. Option Buyer (Holder)
Pays the premium
Has rights, but not obligations
Can exercise the option if profitable
Loss is limited to the premium paid
2. Option Seller (Writer)
Receives the premium
Has obligation to fulfill the contract if the buyer exercises
Risk is unlimited for call writers and limited for put writers (if stock price becomes zero)
Profit is limited to the premium received
Difference between Call and Put Options (Summary Table)
Feature Call Option Put Option
Buyer’s Expectation Bullish (price will go up) Bearish (price will go down)
Right Buy at strike price Sell at strike price
Profit Potential Unlimited Limited (until price reaches zero)
Risk (for buyer) Limited to premium Limited to premium
Seller’s Role Sells call & hopes price won’t rise Sells put & hopes price won’t fall
Premium and What Influences It?
The premium is the price you pay to buy an option. This is influenced by:
Intrinsic Value: Difference between market price and strike price
Time Value: More days to expiry = higher premium
Volatility: Higher the volatility = higher the premium
Interest Rates and Dividends
What is Strike Price and Expiry?
Strike Price: The price at which you can buy (call) or sell (put) the underlying stock
Expiry: The last date till which the option is valid. In India:
Weekly expiry for Nifty, Bank Nifty, and FINNIFTY
Monthly expiry for stocks

NIFTY – Bearish Setup: Head & Shoulders🟢 Entry (Short): Around 24,800 – 24,900
🔴 Stop Loss: Above 25,000
🎯 Target : 24,000

Nifty : Technical levels metAs shared last week the nifty support 24510 , 24850 levels were worked as support exactly.
Now we may see sideways market and range bounded moves.
Sharing fresh levels:
Support : 24460
Resistance: 24660, 24850
