Long Term Nifty Analysis.(With Economic Commentary). We saw phenomenal resistance by Indian markets today after the Tariff announcements. Nifty bounced back and at one point was 330 points above low of the day. However there was Profit booking and selling on bounce due to prevailing Tariff uncertainties and Nifty came of the peak to close at 24768. Even after losing a lot of ground which it gained it ended up 133 points from the low of the day. Nifty ended the day in the negative losing 87.6 points from yesterday's close. This was much better than estimation of many experts. We might not be out of the woods yet but nevertheless fight back was phenomenal.
Now coming to Tariffs. I am not an expert in economy but let us assume the worst case scenario that trade negotiations fail and this is the tariff stays at 25% + Penalty. Again assuming that we loose 50% of our exports to US due to this decision. Say tariff would apply to 50b worth goods exported by us to USA and we 25b worth business. The impact on GDP will be as under.
GDP Impact = 25b/3.7T= 0.0067 = 0.67% of our GDP will be shaved off..(Rough Estimate). So say our is say 6.5. Then we continue to grow at 5.9 or 5.8. (Again I am not an expert and this estimate is based on a lot of assumption). This loss of GDP can be covered by increasing local consumption or exploring other market. Enhancing ties with markets outside USA. Thus it is not something which is going to kill Indian markets. We survived 1991, We survived Covid, We survived, Ukraine - Russia war, Israel-Iran conflict, Operation Sindoor Lows so we will survive this too and continue thriving. India is destined to become 3rd Largest Economy and unless there are local / internal political mishaps or mess-ups our growth will continue.
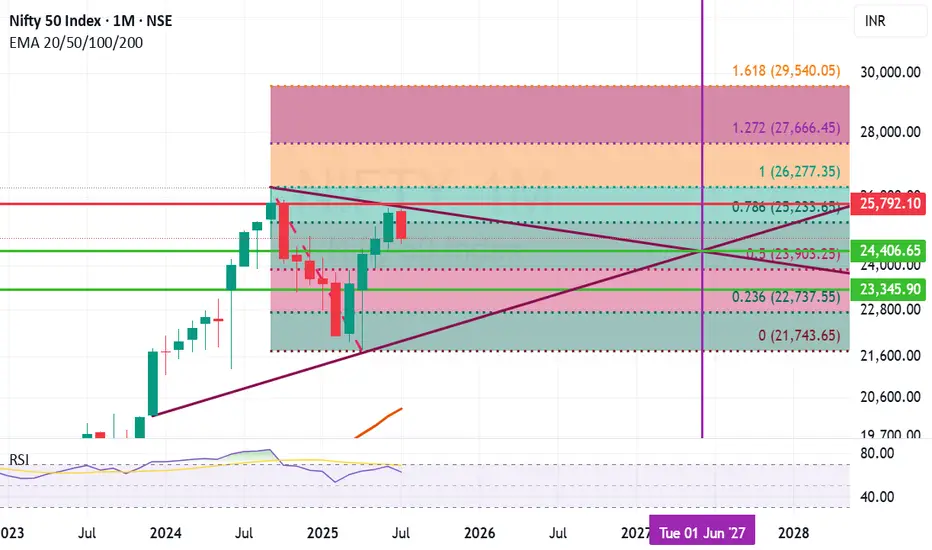
Fibonacci retracement of Nifty ant trend line analysis suggests few important support and resistance levels. The Horizontal line in the chart here suggests the cut off date. The chart suggests that:
Important Supports for Nifty remain at: 24406 (Mid Trend Support), 23903 (Important Fibonacci Support), 23345 (Important Candle support), (Below 23345 Nifty becomes very week and we will be in Bear grip where bears can drag Nifty down to 22737 or even 21742 in unlikely circumstances).
Important Resistance Levels: 25233 (Important Fibonacci resistance), 25792 (Important Candle resistance), 26277 (Previous All Time high), In the long term we might reach 27666 or even 29540 in close to 24 months time.
Conclusion:
Scenario 1) Indian Growth story continues and business thrive the optimistic range for Nifty by June 2027 seems to be the range between 26277 to 29540 or above.
Scenario 2) Indian economy faces changes and internal / external issues hamper progress the pessimistic range for Nifty by June 2027 seems to be anywhere between 23090 to 26277.
Scenario 3) Local or Global catastrophic events unfurl. Global and Indian economy takes a hit (Long drawn wars or local political leadership changes, Covid like events etc.) during this time frame 23090 to 21743 or below..(This does not seem likely but you never say never).
Disclaimer: The above information is provided for educational purpose, analysis and paper trading only. Please don't treat this as a buy or sell recommendation for the stock or index. The Techno-Funda analysis is based on data that is more than 3 months old. Supports and Resistances are determined by historic past peaks and Valley in the chart. Many other indicators and patterns like EMA, RSI, MACD, Volumes, Fibonacci, parallel channel etc. use historic data which is 3 months or older cyclical points. There is no guarantee they will work in future as markets are highly volatile and swings in prices are also due to macro and micro factors based on actions taken by the company as well as region and global events. Equity investment is subject to risks. I or my clients or family members might have positions in the stocks that we mention in our educational posts. We will not be responsible for any Profit or loss that may occur due to any financial decision taken based on any data provided in this message. Do consult your investment advisor before taking any financial decisions. Stop losses should be an important part of any investment in equity.
NIFTY trade ideas
Nifty levels - Aug 01, 2025Nifty support and resistance levels are valuable tools for making informed trading decisions, specifically when combined with the analysis of 5-minute timeframe candlesticks and VWAP. By closely monitoring these levels and observing the price movements within this timeframe, traders can enhance the accuracy of their entry and exit points. It is important to bear in mind that support and resistance levels are not fixed, and they can change over time as market conditions evolve.
The dashed lines on the chart indicate the reaction levels, serving as additional points of significance to consider. Furthermore, take note of the response at the levels of the High, Low, and Close values from the day prior.
We hope you find this information beneficial in your trading endeavors.
* If you found the idea appealing, kindly tap the Boost icon located below the chart. We encourage you to share your thoughts and comments regarding it.
Wishing you success in your trading activities!

#Nifty directions and levels for July 31st:Good morning, friends! 🌞
Here are the market directions and levels for July 31st:
In the past two sessions, the global market (based on Dow Jones) has shown a moderately bearish sentiment,
while the local market continues to reflect a bearish tone.
Today, Gift Nifty indicates a gap-down opening of around 160 points (as per the chart).
What can we expect today?
In the previous session, both Nifty and Bank Nifty went through consolidation.
Structurally, we are still in a bearish tone, and with Gift Nifty indicating a gap-down start,
if the market breaks the immediate support levels with a solid candle, we can expect further correction.
On the other hand, if it finds support there, then the range-bound movement is likely to continue.
Which means, if the initial market takes a pullback, we can expect consolidation within the previous day’s range.

nifty 50 longrecently nifty had completed corrective wave pattern extended flat in near term price may move in impulsive move or complex correction
as on near term price could move in upwards

Nifty Analysis EOD – July 28, 2025 – Monday 🟢 Nifty Analysis EOD – July 28, 2025 – Monday 🔴
⚡️ Bears Bite Back After a Hopeful Morning Surge
📊 Nifty Summary
Nifty opened with a minor gap-down of 32 points and slipped an additional 67 points in the first 3 minutes, testing the critical support zone of 24,755 ~ 24,729. After marking a day low at 24,732.70, it witnessed a sharp recovery breaching key levels — CDO, Gap, PDC — and touched the CPR BC level. Rejection from there caused a retracement to the mean, followed by another successful attempt breaching CPR BC and IB High. However, it couldn’t sustain above, as profit booking and pressure from a higher time frame bearish trendline dragged the index below the CPR zone and even past the PDL.
Support at 24,780 offered brief relief, but a bearish triangle formed between the HTF trendline and that support and The breakdown at 12:40 led to a clean move, with the pattern target achieved.
🕯 5 Min Time Frame Chart with Intraday Levels
🔁 Trend & Zone Update
📍 Resistance Zone Shifted To: 25,100 ~ 25,120
📍 Support Zone Shifted To: 24,520 ~ 24,480
🧭 What If Plans – 29th July Outlook
🅰️ Plan A (Contra Long Setup)
If market opens inside the previous day range and finds support at 24,700 ~ 24,729,
→ Potential targets: 24,780, 24,815, 24,840
🅱️ Plan B (Trend is Friend – Short Continuation)
If market opens inside range and faces resistance around 24,830 ~ 24,815,
→ Aim for: 24,780, 24,720, 24,640, 24,580
🔄 On-the-Go Plan
If market Gaps Up/Down outside previous day’s range,
→ Wait for IB formation and act based on structure & S/R levels.
🕯 Daily Time Frame Chart with Intraday Levels
🕯 Daily Candle Breakdown
Open: 24,782.45
High: 24,889.20
Low: 24,646.60
Close: 24,680.90
Change: −156.10 (−0.63%)
🕯 Candle Structure Breakdown:
Real Body: 101.55 pts (Red candle, bearish)
Upper Wick: 106.75 pts (Long — rejection from highs)
Lower Wick: 34.30 pts (Defended slightly)
🕯 Interpretation:
Tried to rally above 24,880 but faced aggressive selling. Closed well below open, forming a bearish rejection candle resembling a shooting star. Bears clearly took control after the intraday bounce attempt.
🕯 Key Insight:
Selling pressure visible from 24,880–24,900 zone.
Close below 24,700 keeps bearish tone intact.
Next Support: 24,650–24,620.
Bulls' challenge: Reclaim and close above 24,850.
🛡 5 Min Intraday Chart
⚔️ Gladiator Strategy Update
ATR: 197.91
IB Range: 122 → Medium
Market Structure: Imbalanced
Trades Triggered:
09:27 – Long Entry → 🎯 Target Hit (1:1.5 R:R)
12:40 – Short Entry → 🎯 Target Hit (1:2.5 R:R)
🧱 Support & Resistance Levels
Resistance Zones:
📍 24,729
📍 24,780
📍 24,815 ~ 24,830
📍 24,850
📍 24,920
Support Zones:
📍 24,640
📍 24,580
📍 24,520 ~ 24,480
💭 Final Thoughts
🧠 “Every breakout starts with hesitation — but not every hesitation leads to a breakout.”
Today’s structure showed strong indecision, but sellers used it to dominate.
Monday’s triangle breakdown proved that structure plus patience = power. Keep your bias flexible and trust your levels.
✏️ Disclaimer
This is just my personal viewpoint. Always consult your financial advisor before taking any action.

Nifty levels - Jul 29, 2025Nifty support and resistance levels are valuable tools for making informed trading decisions, specifically when combined with the analysis of 5-minute timeframe candlesticks and VWAP. By closely monitoring these levels and observing the price movements within this timeframe, traders can enhance the accuracy of their entry and exit points. It is important to bear in mind that support and resistance levels are not fixed, and they can change over time as market conditions evolve.
The dashed lines on the chart indicate the reaction levels, serving as additional points of significance to consider. Furthermore, take note of the response at the levels of the High, Low, and Close values from the day prior.
We hope you find this information beneficial in your trading endeavors.
* If you found the idea appealing, kindly tap the Boost icon located below the chart. We encourage you to share your thoughts and comments regarding it.
Wishing you success in your trading activities!
Nifty50 Index Monthly expiry week Grid projection.(July 2025)Hello everyone !!
Welcome to Nifty50 Index Grid projection for last week of July (Monthly expiry week)
this Grid is based on the Expected move reverse engineered from option pricing for the week
our market has been breaking the lows
today its been the lowest in the whole month
so expecting this to be not only the day's low but also the Month's low
Thank you
Grid-_-Work's.
safety first

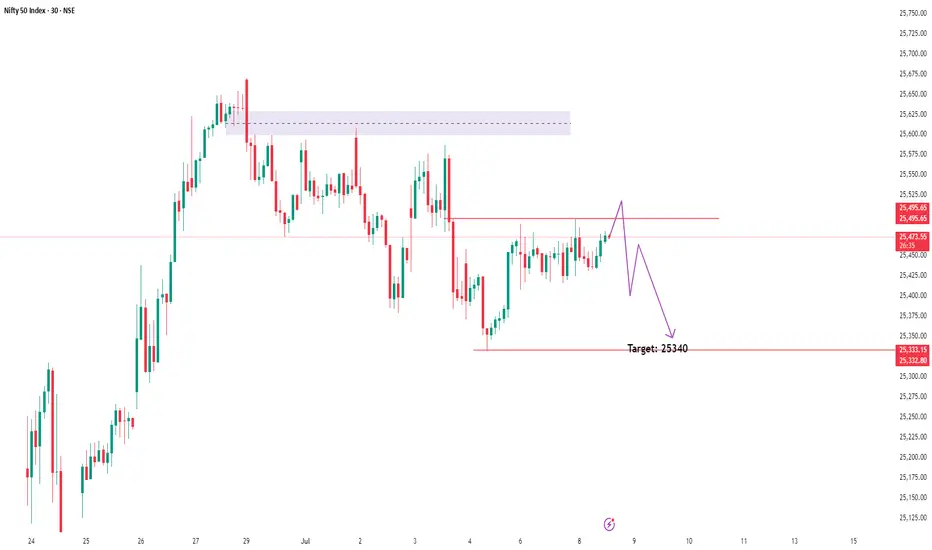
Bearish Outlook on Nifty – Based on Smart Money ConceptI'm seeing a clear downside setup on Nifty, with Smart Money indicating distribution and the market transitioning into a bearish trend.
📉 Target: 25,340
📍 Current Price: 25,474
🔍 Reasoning: Clear signs of institutional distribution and lower highs/lows forming. Smart Money is exiting, suggesting the beginning of a deeper correction.
Will monitor closely for any change in structure, but as of now, bias remains strongly bearish.
NIFTY 24740: Smart Money Signals Bearish Move IncomingThe directional bias is clear – bearish – and I'm currently waiting for a precise setup to present itself. Based on the Smart Money Concept, we could be looking at a potential short opportunity around the 24740 zone.
📍 Once the setup is confirmed, I’ll be sharing the exact entry and stop-loss levels with you.
Stay tuned – patience here is key. Let the market come to us.

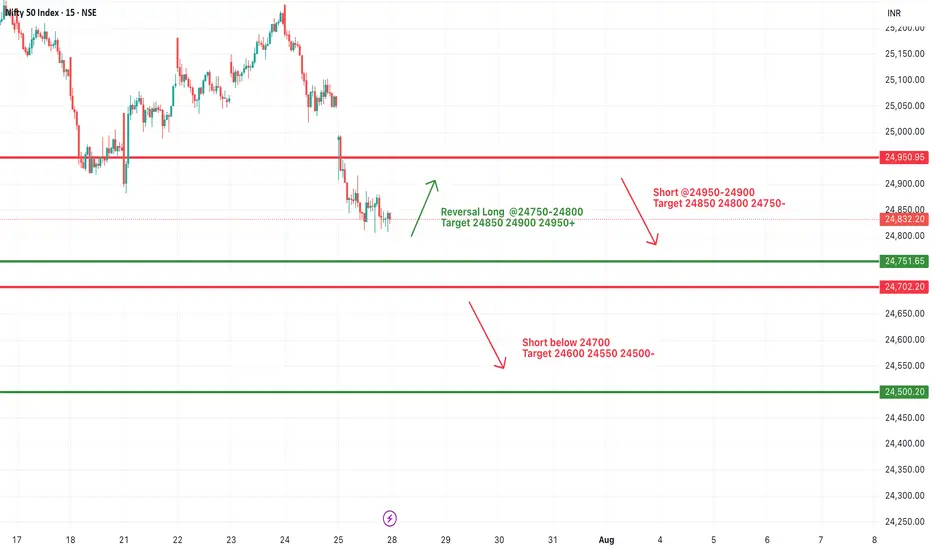
#NIFTY Intraday Support and Resistance Levels - 28/07/2025Nifty is expected to open slightly lower and remains under selling pressure from higher levels. The key intraday zone to watch is 24,750–24,900, which may act as a trigger range for today's direction.
If Nifty sustains above the 24,750–24,800 zone, a short-covering rally may push the index toward 24,850, 24,900, and 24,950+. This zone may offer a reversal opportunity if supported by strong price action.
On the downside, if the index fails to hold above 24,900–24,950, further weakness may be seen below 24,700, opening downside targets at 24,600, 24,550, and 24,500-.
The broader price action suggests a narrow consolidation between 24,700–24,900, with either side breakout likely to lead to intraday momentum. Maintain strict risk management and avoid aggressive trades within this zone.
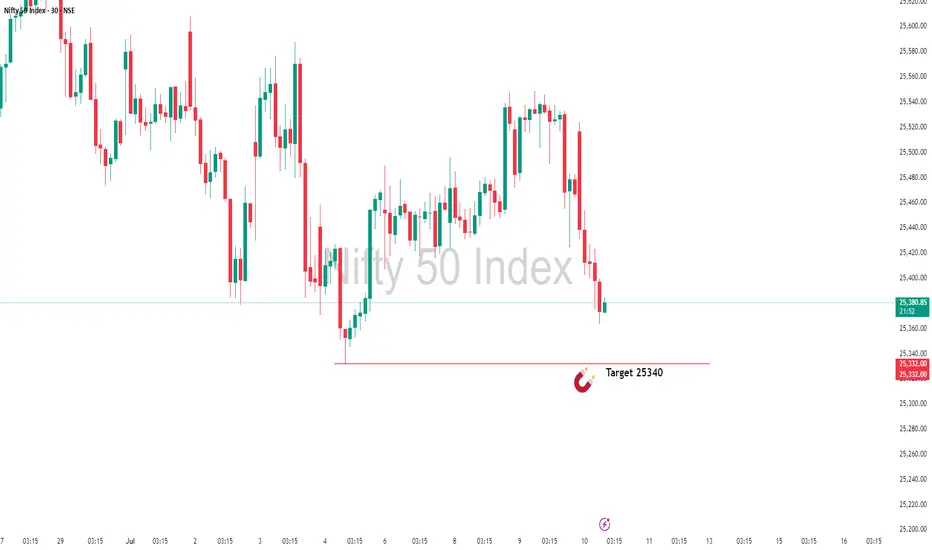
Almost There: Nifty Closing in on My Target Zone 25340In this update, I’m revisiting the setup I shared earlier that points towards NIFTY’s next potential target at 25,340. The analysis covers the key levels, price action structure, and the factors supporting this move. This setup is based on clear technical confirmations and disciplined risk management — not just speculation.
Please remember to follow your own plan and manage your trades responsibly. This is for educational purposes and not financial advice. Let’s see how the price action unfolds!
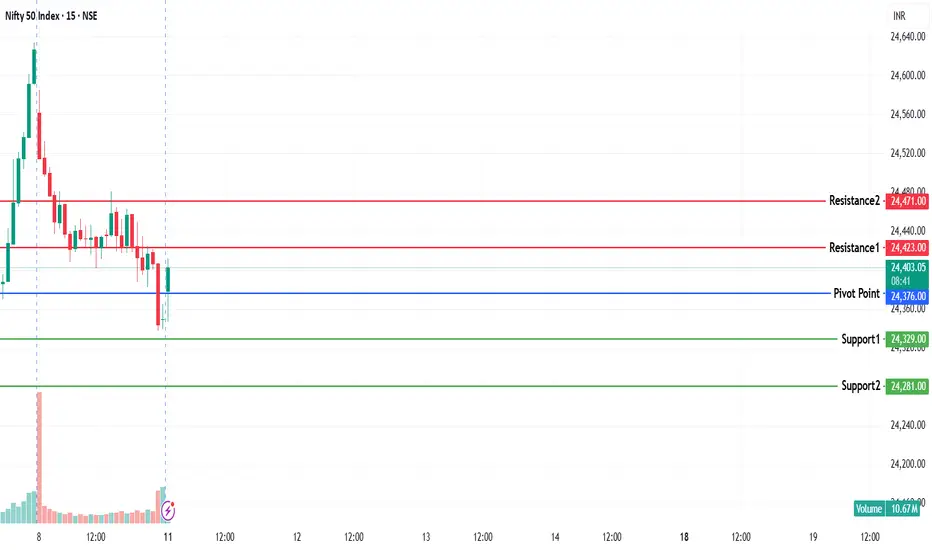
NIFTY KEY LEVELS FOR 11.08.2025NIFTY KEY LEVELS FOR 11.08.2025
If the candle stays above the pivot point, it is considered a bullish bias; if it remains below, it indicates a bearish bias. Price may reverse near Resistance 1 or Support 1. If it moves further, the next potential reversal zone is near Resistance 2 or Support 2. If these levels are also broken, we can expect the trend.
If the range(R2-S2) is narrow, the market may become volatile or trend strongly. If the range is wide, the market is more likely to remain sideways
📢 Disclaimer
I am not a SEBI-registered financial adviser.
The information, views, and ideas shared here are purely for educational and informational purposes only. They are not intended as investment advice or a recommendation to buy, sell, or hold any financial instruments.
Please consult with your SEBI-registered financial advisor before making any trading or investment decisions.
Trading and investing in the stock market involves risk, and you should do your own research and analysis. You are solely responsible for any decisions made based on this research.
Nifty August TDX Levels -Observation:
The month has erupted with a bearish undertone, casting shadows over the market’s horizon. It’s a turbulent start, fraught with uncertainty .
Bulls:
Despite the indicators flashing oversold, there’s a flicker of hope—a glimmer that a resilient bullish pattern might awaken on a smaller time frame. Yet, patience is vital; we must wait for that decisive moment when the market reveals a clear bullish formation before boldly stepping in.
Bears:
Since the dawn of last month, relentless downward momentum has engulfed the markets .
Now, only a tentative pullback, should tempt us to initiate fresh short positions, for the risk-reward landscape remains perilous and unkind.
Conclusion:
The true opportunities lie at the crucial junctures—those key Support and Resistance levels, pausing points within the intricate dance of Time Cycles. It is only when these points are reached that we should reassess with clarity and resolve. The probability of an Impulsive wave surging forth is high; the current Corrective wave has hit its targets, yet its story remains unfinished—setting the stage for a potential dramatic turn in the market’s saga.
For sharper insight and a more profound understanding, I urge you to view the chart through the hourly lens. Only then can the full emotional weight and strategic clarity of these movements come into focus.

Nifty Analysis EOD – August 8, 2025 – Friday🟢 Nifty Analysis EOD – August 8, 2025 – Friday 🔴
From Yesterday’s Glory to Today’s Gloom — Bulls Knocked Off the Board
Today’s market was a textbook case of how quickly momentum can flip. Yesterday’s 289-point bullish surge was completely erased, with Nifty ending deep in the red and closing at the day’s low. Sellers clearly had the upper hand, leaving little room for bulls to breathe.
🗞 Nifty Summary
Friday opened with a 65-point gap-down — right below the crucial 24,580 support zone — and that level instantly showed rejection.
In the first 45 minutes, Nifty slipped 150 points from the day high and 200 points from the previous day high. The key Fibonacci retracement level from yesterday’s range — 24,406 ~ 24,412 — played the role of intraday savior multiple times, offering support and holding the market within a narrow zone for most of the day.
However, the bulls’ defense cracked after 3:00 PM. The support broke, triggering a sharp slide below 24,380 and even the Previous Day Low (PDL).
The upside was capped by 24,470 ~ 24,460, while 24,406 ~ 24,412 remained the battleground for most of the day until the breakdown.
In a single session, yesterday’s dramatic 289-point recovery rally was completely erased — with Nifty closing at the bottom of the PDL and CDL.
Today’s close is now below the low of 12th May, marking a 64-session (88-day) low.
Now the question for Monday: will bearish momentum extend, or will some positive news bring bulls back into play?
🛡 5 Min Intraday Chart with Levels
Intraday Walk
🔻 Gap-down open below major support at 24580.
⏳ First 45 minutes: Steep drop of 150 points from the day high.
🛡️ Fib support at 24406–24412 holds multiple times… until the late break.
🔻 Post 3 PM: Support collapse leads to fresh lows below PDL.
📉 Close near day’s low — erasing yesterday’s bullish rally.
📉 Daily Time Frame Chart with Intraday Levels
🕯 Daily Candle Breakdown
Open: 24,544.25
High: 24,585.50
Low: 24,337.50
Close: 24,363.30
Change: −232.85 (−0.95%)
Structure:
Real Body: 180.95 pts (Red Candle — Close < Open)
Upper Wick: 41.25 pts
Lower Wick: 25.80 pts
Interpretation:
Strong bearish sentiment — sellers maintained control from open to close.
Very small lower wick — indicates conviction from sellers in closing near the low.
Wiped out prior day’s gains — buyers have lost the short-term edge.
Candle Type:
Bearish Marubozu (near-full body) — signals decisive selling pressure, often a continuation pattern after weakness.
🛡 5 Min Intraday Chart
🥷 Gladiator Strategy Update
ATR: 210.45
IB Range: 134.05 → Medium
Market Structure: Balanced
Trade Summary:
10:35 AM – Short Entry → SL Hit
📌 What’s Next? / Bias Direction
Below 24,400: Bearish momentum likely to extend toward 24,250–24,200.
Above 24,470: Only a strong reclaim can shift bias back to neutral.
Gap-down/weak open on Monday may accelerate selling; bounce attempts will face resistance at 24,400–24,470.
🔍 Support & Resistance Levels
Resistance Zones:
24,406 ~ 24,412
24,460 ~ 24,470
24,500
24,580
Support Zones:
24,315
24,280
24,240 ~ 24,225
24,185
💬 Final Thoughts
"Markets don’t turn on hope — they turn on price. Respect the levels, and let price lead the story."
Bulls had the glory on Thursday, but Friday flipped the script completely. The market now sits at a multi-month low — momentum favors bears, but Monday’s open will decide if we see follow-through selling or a sharp dead-cat bounce.
✏️ Disclaimer
This is just my personal viewpoint. Always consult your financial advisor before taking any action.
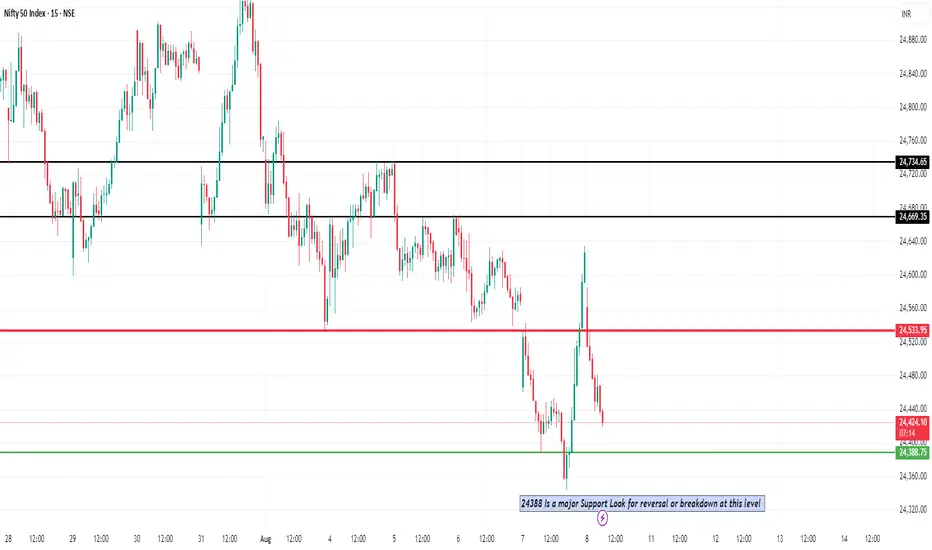
Nifty 50 Reversal / Breakdown ViewNifty 50 – Sharp Reversal from 24,388: What Really Happened Yesterday
Yesterday was a rollercoaster for the Nifty 50.
The day started on a sour note after news broke that the U.S. had slapped another 25% tariff on Indian exports, effectively doubling the total to 50%. The sentiment hit the floor right at the open, and we saw the index tumble to 24,388, marking a fresh three-month low.
But just when it looked like the selling would spiral, the market staged a dramatic turnaround. Strong buying — especially in the derivatives segment — kicked in during the second half. By the closing bell, Nifty had clawed its way back into the green, ending around 24,596. It wasn’t just a bounce; it felt like the bulls wanted to send a message: we’re still here.
Key Levels in Play
That 24,388 mark isn’t random. It lined up perfectly with a key support zone on the charts — one that also overlapped with short-term fair value gaps and EMA zones on the 15-minute chart. In other words, it was a prime area for a potential reaction.
Once the index got back above 24,450, buyers clearly had the upper hand. Now, 24,800 is the next hurdle. A strong break and hold above that could open the door for a test of 25,000. On the flip side, if we slip back under 24,450, we could be right back under pressure, staring at the 24,300–24,400 range again.
The Bigger Picture
Foreign flows: Global sentiment took a hit — foreign investors sold over ₹49,000 crore worth of equities yesterday, adding to the nervousness.
Sector moves: IT and pharma were the big drags early on, erasing some of their recent gains.
Domestic support: Local investors kept the faith, pumping in over ₹1 lakh crore — the strongest domestic inflows in four months — which likely helped cushion the fall.
Takeaway
Yesterday’s reversal wasn’t luck. It was a combination of technical support holding, aggressive short-covering, and steady domestic buying stepping in when the global mood was sour.
Nifty 50's Elliott Wave Analysis & Price ProjectionHey, so let's take a look at this chart of the Nifty 50. where the market might be heading. Just a heads-up, this is all for learning, not for making actual financial decisions. Think of it more like a potential roadmap than a guaranteed outcome.
From what I can see, the chart is laying out a classic five-wave pattern.
* Wave 1: The first big push up was in the latter half of 2022 into early 2023. It was the start of the uptrend.
* Wave 2: After that, the market pulled back a bit—a healthy correction, really—in the middle of 2023. It didn't drop below the starting point of the first wave, which is exactly what you'd expect.
* Wave 3: This was the huge run-up that we saw from mid-2023 all the way into early 2024. That's typically the strongest and longest part of the move. The chart marks it with a "(b)" which suggests it's part of a bigger picture, but for now, we can see it as the big third wave.
* Wave 4: Now, we're in the middle of a correction, a kind of zigzag, that started after that massive run-up. The chart shows it finding a bottom around mid-2025. It's like the market is taking a breather before the final push.
* Wave 5: And this is where it gets interesting. The chart is forecasting the final leg up, starting from this mid-2025 low. It's suggesting we could see a big rally, with the Nifty potentially hitting targets around 28,000 and even above 30,000 by late 2026 or 2027.
Basically, the chart is saying we've gone up, corrected, gone up big, and now we're in a smaller correction, getting ready for one last big move to the upside.
Again, this is just one way of looking at the market. No one has a crystal ball, and a ton of other things—like news, company earnings, and what's happening around the world—could change this forecast completely. So, always do your own homework and talk to a pro before you invest your hard-earned money.
This forecast report is for educational purposes only and should not be considered financial advice. Market analysis, especially projections based on technical indicators like Elliott Wave theory, is speculative and does not guarantee future results. Always conduct your own research and consult with a financial professional before making any investment decisions.

Nifty Analysis EOD – August 7, 2025 – Thursday🟢 Nifty Analysis EOD – August 7, 2025 – Thursday 🔴
A Trap, a Reversal, and a Breathless Rally — Did You Catch It?
🗞 Nifty Summary
Today was expected to be volatile, but few were prepared for how wildly Nifty behaved.
After a gap-down of 110 points on the back of negative global cues, Nifty immediately started filling the gap and reached the Previous Day Low (PDL). However, strong rejection at PDL sent prices tumbling — slicing below the Open, IB Low, and even the Current Day Low, marking a sharp low at 24,387.
Then came the bear trap.
A brief breakdown to 24,344.15 looked like a breakdown, but instead triggered a sharp liquidity grab, launching a vertical move upward. From that bottom, Nifty surged in a breathtaking rally — not a single 5-min candle broke its previous candle’s low, signaling relentless buying. Almost every resistance zone — Swing High, VWAP, PDL/S1, CPR, Weekly Low — got taken out in one single breath.
Did you ride it?
Honestly — I didn’t. I was frozen watching this dramatic reversal unfold.
Still, today’s super recovery puts the index back within its known range. Now, bulls need a close above 24,660–24,675 to confirm momentum.
📉 Intraday 5 Min Chart Overview
🧭 Intraday Price Action Flow
9:15 AM: Opens 110 points down at 24,467.10
9:15–10:30 AM: Recovers swiftly to PDL, but fails there.
10:25 AM – 11:05 PM: Sharp fall — breaches CDL & IB Low → makes new day low at 24,387
1:20 PM Onwards: Attempts consolidation; false breakdown at 24,344.15
2:00 PM – 3:30 PM: Monster rally → No candle breaks prior low; bulls dominate to close at 24,626.65
📉 Daily Time Frame Chart with Intraday Levels
🕯 Daily Candle Breakdown
Open: 24,464.20
High: 24,634.20
Low: 24,344.15
Close: 24,596.15
Change: +21.95 (+0.09%)
🔍 Candle Structure:
Real Body: Green → +131.95 pts
Upper Wick: 38.05 pts
Lower Wick: 120.05 pts
🧠 Interpretation:
Strong rejection from intraday lows near 24,344
Long lower wick shows dip buying strength
Closed near the highs = bulls dominated the end
Still within larger range → needs breakout above 24,675 for follow-through
🔥 Candle Type:
A bullish recovery candle, hammer-like, but within a sideways structure — shows aggressive buying near important demand zone (24,340–24,380).
📈 Updated Short-Term View – 7th August 2025
Support Zone: 24,340 – 24,380
Resistance Zone: 24,620 – 24,675
Bias: Neutral with a bullish tilt, unless 24,340 breaks decisively.
🎯 Trading Insight
A close above 24,660–24,675 may lead to further upside — possibly testing 24,735–24,780
Failure to hold above 24,460 will shift bias back to bearish
🛡 5 Min Intraday Chart
🥷 Gladiator Strategy Update
ATR: 205.09
IB Range: 82.85 → Medium
Market Structure: ImBalanced
⚔️ Trade Summary:
🕙 10:25 AM – Short Entry → Trail SL Hit (R:R = 1:1.8)
🧱 Support & Resistance Levels
🔼 Resistance Zones:
24,620
24,660 ~ 24,675
24,725 ~ 24,735
24,780 ~ 24,795
24,860 ~ 24,880
🔽 Support Zones:
24,542 ~ 24,535
24,500
24,470 ~ 24,460
24,380 ~ 24,344
💬 Final Thoughts
"Markets reward patience and punish rigidity."
Today was a masterclass in trap-reversal-breakout structure. While many were either trapped or missed the move, this type of price action reminds us — be ready, but never rigid.
Now all eyes on 24,675 — can bulls push above it and sustain?
✏️ Disclaimer:
This analysis reflects personal views and is not trading advice. Please consult your financial advisor before making decisions.

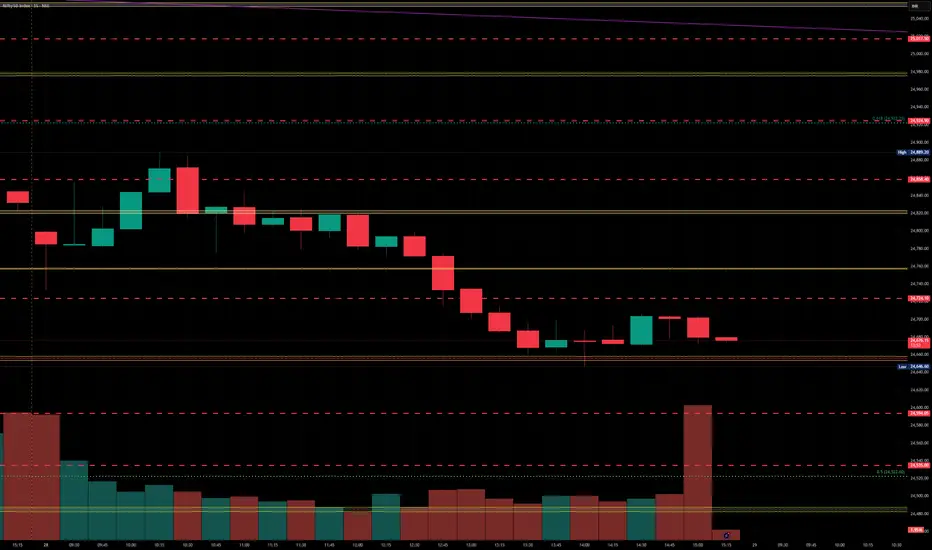
Nifty bounce from Anchored VWAPAfter sharp correction nifty finally bounce from Anchored Vwap support if hold this level probability high to outperform .

"Nifty Is Developing a New Trend""The index needs to test the 24450-24500 range again to regain positivity, as these levels are expected to act as key support. Once these levels are tested and hold as support, it could be a good opportunity to play swing long positions in the market."

The Nifty is currently developing a new trend"The index needs to test the 24450-24500 range again to regain positivity, with these levels expected to act as key support. A successful test of this support zone could present an opportunity for swing long positions."

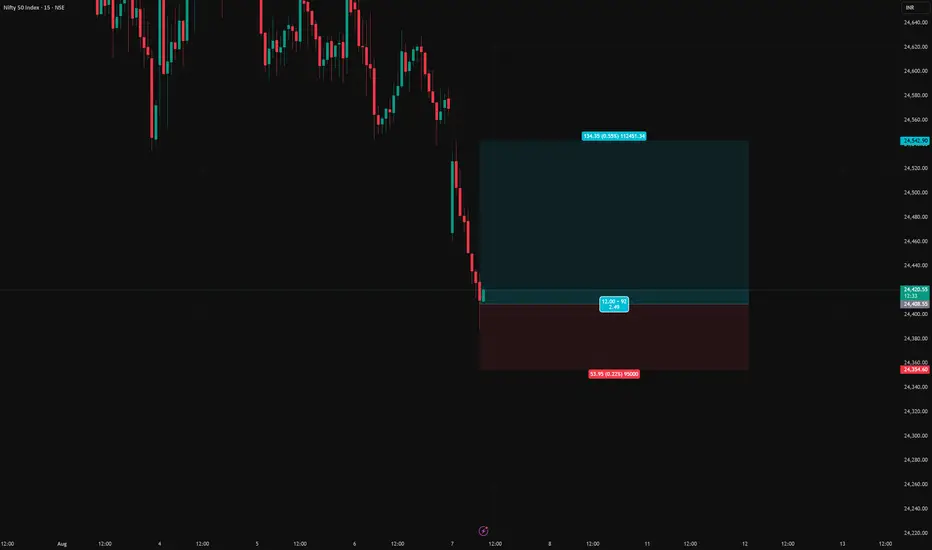
NIFTY long setupNifty long setup
Entry price - 24408.55
Stop loss - 24354.60
Target - 24542.90
Risk Reward - 1:2.5