Aug7th #NIFTY50 View NSE:NIFTY As updated in the previous video #NIFTY50 seems to be correcting the April 4th cycle. And as per the latest update the correction seems to be in the form of ABC, and should typically find support at 38.2-----50% level for one more push higher correcting the fall or to a new high.
NIFTY trade ideas

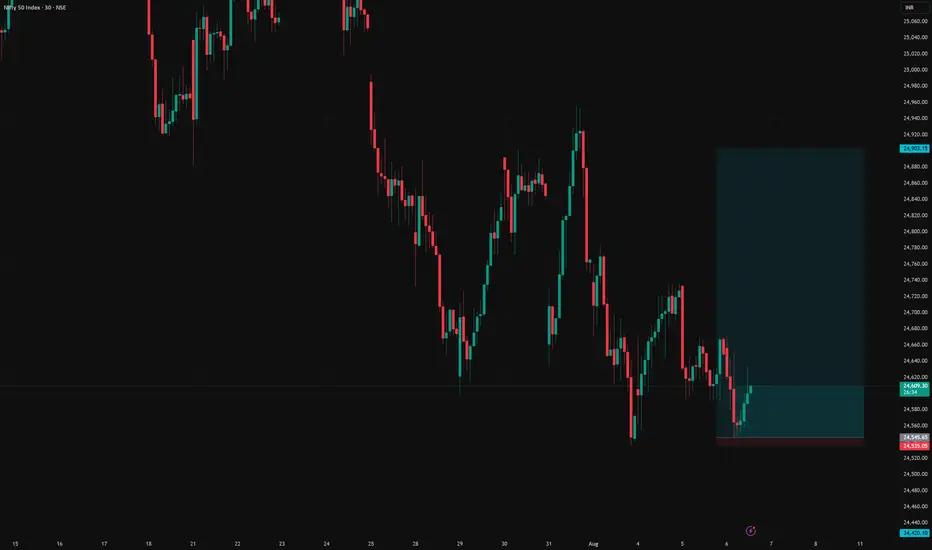
NIFTY spot long setupNifty spot long setup
Entry - 24546
Stop loss - 24535
Target - 24903
Risk Reward - 1:33
NIFTY WAVE COUNTLast wave in Nifty 50 is on. We are right now in corrective phase. Fourth wave corrections are going on in the fifth primary wave, wait for the corrections to get over. Happy Trading.

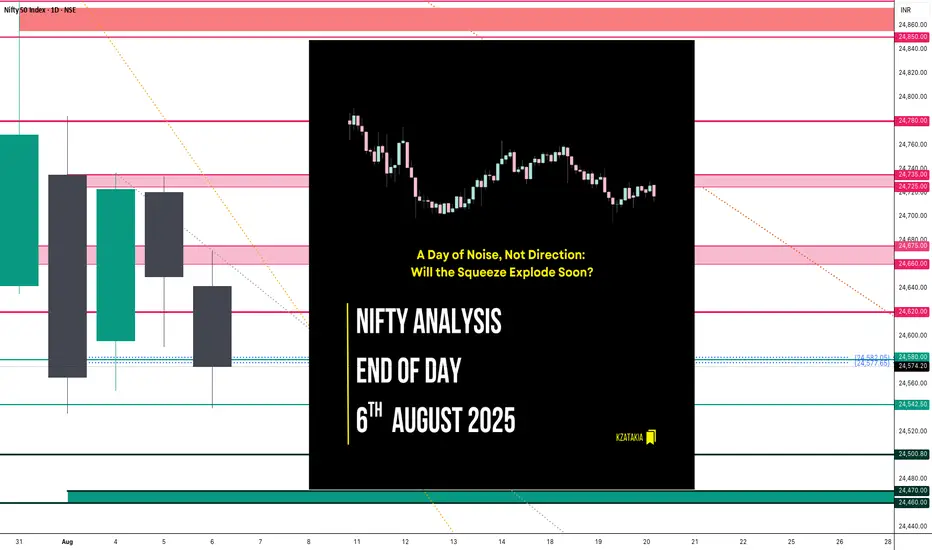
Nifty Analysis EOD – August 6, 2025 – Wednesday 🟢 Nifty Analysis EOD – August 6, 2025 – Wednesday 🔴
A Day of Noise, Not Direction: Will the Squeeze Explode Soon?
Nifty started flat with indecisive vibes, struggling initially around the 24,660 ~ 24,675 zone. After multiple failed attempts to hold, it slipped toward 24,580 — a cluster of PDL + S1 + Key Support — and broke below, forming the IB Low.
A quick bounce followed, but the index was firmly rejected near the VWAP + CPR + Fib zone, pushing it to a new day low at 24,544. Repeated intraday bounces faced selling pressure around 24,620, while 24,540 provided solid support — creating a tight intraday range.
Despite a perfect CPR setup for breakout, the market moved within just 132 points, the narrowest range in the last 4 sessions. A compression phase is building; breakout traders may soon get their moment.
📉 5 Min Time Frame Chart with Intraday Levels
🗣 Voice of the Intraday Option Buyer
Trend direction flipped multiple times — bearish to bullish and vice versa.
PDL + S1 zone experienced repeated fakeouts.
Low conviction moves on both sides frustrated momentum setups.
RBI event also not enough strong or trigger to guide directional bias.
Bank Nifty broke IB Low → IB High, closed strong; Nifty stayed muted.
Weekly expiry ahead — theta decay took control.
Many traders, including myself, anticipated a double inside bar breakout — but the trap continued.
Last 4 sessions (since Aug 1) have been painful for intraday option buyers — but it's all part of the game.
📉 Daily Time Frame Chart with Intraday Levels
🕯️ Daily Candle Breakdown
Open: 24,641.35
High: 24,671.40
Low: 24,539.20
Close: 24,574.20
Change: −75.35 (−0.31%)
Candle Structure:
Real Body: Red candle (67.15 pts)
Upper Wick: 30.05 pts
Lower Wick: 35.00 pts
Interpretation:
Attempted upside early on but couldn’t hold.
Both wicks show intraday tug-of-war; red close confirms sellers still in control.
Repeated rejection from 24,660–24,675 highlights weak bullish attempts.
Candle Type:
Bearish indecision candle — resembles an Inverted Hammer, indicating weakness despite dip buying attempts.
🔍 Nifty Short-Term View – As of August 6, 2025
Last 5 sessions show directional fatigue and failed bullish attempts above 24,700.
Two consecutive inside bars signal tight range and pending breakout.
Lower closes and long lower wicks = sellers dominate, but buyers defend dips.
Break below 24,535 = fresh selling.
Close above 24,660 = potential short-covering rally.
📌 Conclusion:
Nifty is coiling — a strong breakout may soon end this sideways-to-weak grind.
🛡 5 Min Intraday Chart
⚔️ Gladiator Strategy Update
ATR: 195.66
IB Range: 91.70 → Medium
Market Structure: Balanced
Trade Summary:
⏱ 10:35 AM – Short Entry → SL Hit
⏱ 12:15 PM – Long Entry → SL Hit
📏 Today's CPR Setup presenting...
Value Relationship: Inside Value → Breakout-Ready
Avg CPR Width: 37.54
Today’s CPR Width: 8.10 (🟠 21.58%)
CPR Type: Narrow → Perfect setup for big expansion
⚠️ Today’s setup didn’t deliver, but backtests show such narrow CPRs often explode in the following session.
📌 Support & Resistance Levels
🔼 Resistance Zones:
24,620
24,660 ~ 24,675
24,725 ~ 24,735
24,780 ~ 24,795
24,860 ~ 24,880
🔽 Support Zones:
24,542 ~ 24,535
24,500
24,470 ~ 24,460
🧠 Final Thoughts
The market is in consolidation mode with narrowing range. The double inside bar setup points to an imminent move — be prepared for a breakout trade soon. Don’t lose patience; big days often follow tough ones.
🛡 Disclaimer
This analysis is shared for educational purposes only. It is not trading advice. Please consult your financial advisor before making any trading decisions. Always trade with proper risk management.
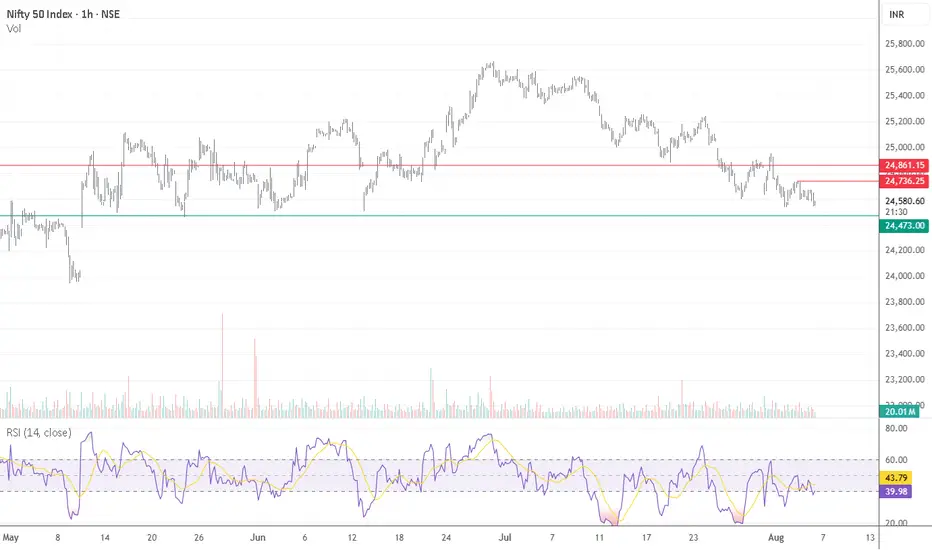
Nifty 50 – Immediate Trend Analysis (Hourly Chart)Nifty 50 – Immediate Trend Analysis (Hourly Chart)
On the hourly chart, Nifty 50 is exhibiting a clear downtrend, forming a pattern of lower highs and lower lows—signaling weakness in the immediate term.
The index has now approached a crucial support zone, which held strong multiple times during May and June, leading to a notable upside reversal in the past. This makes the current level a key inflection point.
If this support level holds, a short-term bounce is likely.
However, a break below this zone could accelerate the decline, potentially taking the index quickly towards the 24,000 level.
Key Takeaway:
Monitor this support zone closely for confirmation of a bounce or a breakdown to position accordingly.
#Nifty50 #NiftyAnalysis #TechnicalAnalysis #StockMarketIndia #NiftySupport #HourlyChart #Downtrend #MarketUpdate #NSE #IndexWatch #TradingStrategy #BreakdownOrBounce #PriceAction #ChartAnalysis #NiftyLevels
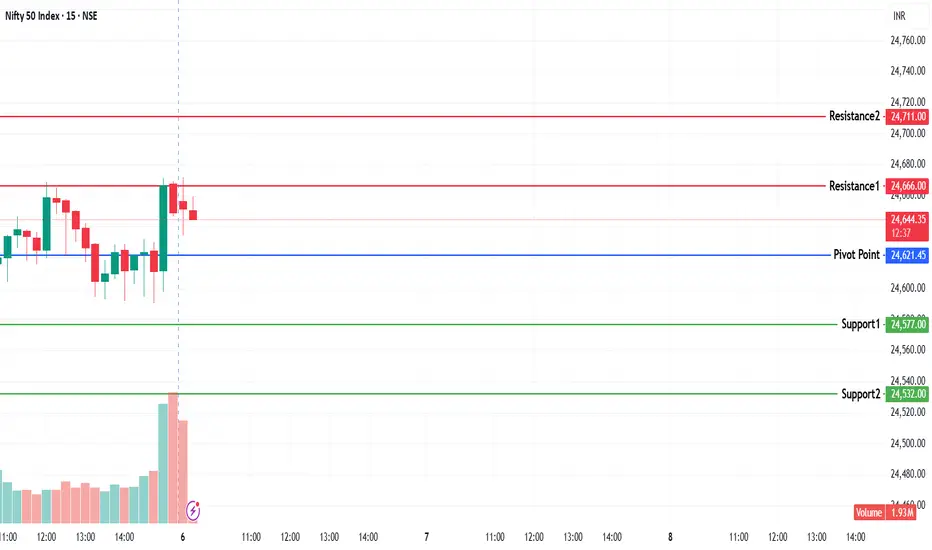
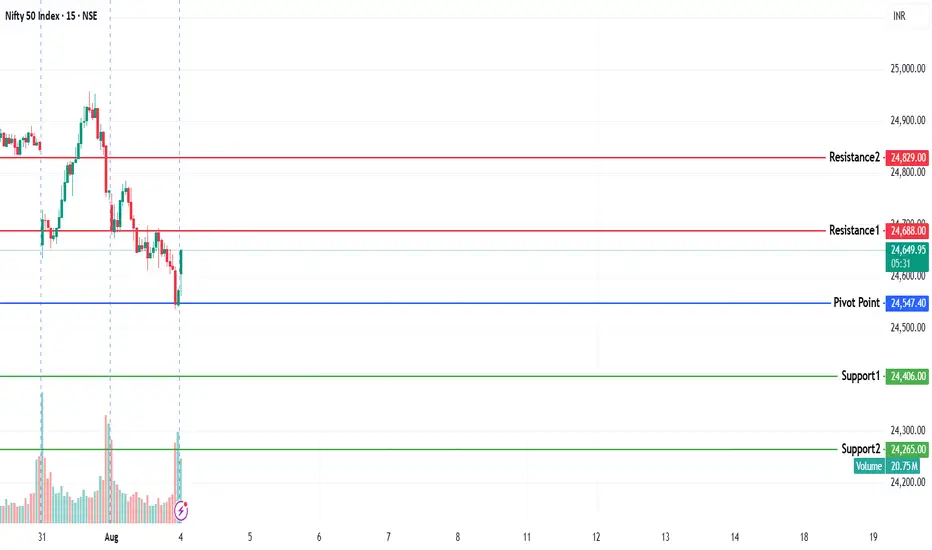
NIFTY KEY LEVELS FOR 06.08.2025NIFTY KEY LEVELS FOR 06.08.2025
If the candle stays above the pivot point, it is considered a bullish bias; if it remains below, it indicates a bearish bias. Price may reverse near Resistance 1 or Support 1. If it moves further, the next potential reversal zone is near Resistance 2 or Support 2. If these levels are also broken, we can expect the trend.
If the range(R2-S2) is narrow, the market may become volatile or trend strongly. If the range is wide, the market is more likely to remain sideways
📢 Disclaimer
I am not a SEBI-registered financial adviser.
The information, views, and ideas shared here are purely for educational and informational purposes only. They are not intended as investment advice or a recommendation to buy, sell, or hold any financial instruments.
Please consult with your SEBI-registered financial advisor before making any trading or investment decisions.
Trading and investing in the stock market involves risk, and you should do your own research and analysis. You are solely responsible for any decisions made based on this research.
Targets achieved ni NIFTY 50 THE RESULT
Follow for more Simple And accurate swing analysis on Indices, Currency, Commodities.
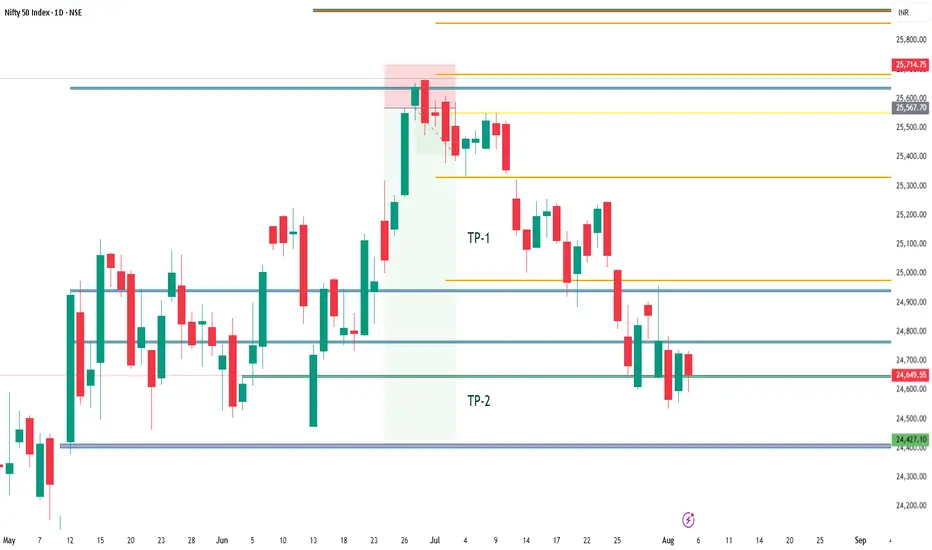
Targets Achieved in NIFTY 50 THE RESULT
Follow for more Simple And accurate swing analysis on Indices, Currency, Commodities.

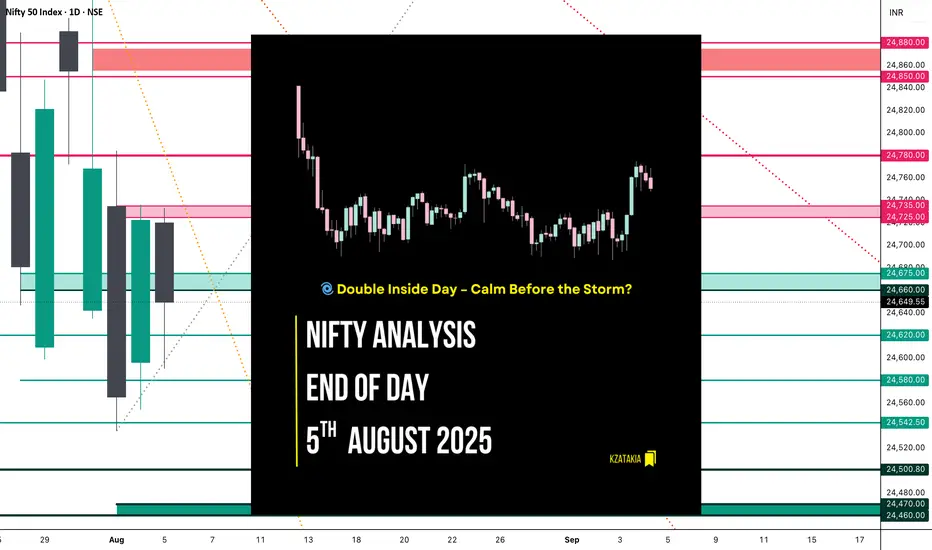
Nifty Analysis EOD – August 5, 2025 – Tuesday 🟢 Nifty Analysis EOD – August 5, 2025 – Tuesday 🔴
🌀 Double Inside Day – Calm Before the Storm?
📊 Nifty Summary
In the wind of negative news, yet Nifty starts neutral at the resistance zone of 24,725 ~ 24,735 but was unable to hold there and fell 140 points within the first 45 minutes.
After this initial sell-off, Nifty found support around 24,590, which coincided with yesterday's Fib 0.786 level, R1, and Previous Week Low (PWL).
These levels were well-defended throughout the session. Near the end, the index recovered ~80 points and closed at 24,649.55, close to yesterday’s Fib 0.5.
Can we consider today's move a retracement or a pullback of yesterday's move?
Same as Monday, today’s action stayed inside the previous session’s range, forming an Inside Bar. Now it appears as a Double Inside Bar on the daily chart.
📉 5 Min Time Frame Chart with Intraday Levels
📉 Daily Time Frame Chart with Intraday Levels
🕯 Daily Candle Breakdown
Open: 24,720.25
High: 24,733.10
Low: 24,590.30
Close: 24,649.55
Change: −73.20 (−0.30%)
Candle Structure Breakdown:
🔴 Red Candle (Close < Open):
24,720.25 − 24,649.55 = 70.70 points
🔼 Upper Wick:
24,733.10 − 24,720.25 = 12.85 points
🔽 Lower Wick:
24,649.55 − 24,590.30 = 59.25 points
Interpretation:
After a flat open, the index tried to move higher but faced resistance near 24,730, then reversed.
Buying interest was seen near the 24,590 zone, but sellers remained in control.
It closed below the open with a decent lower wick, indicating some buying support but overall weakness.
Candle Type:
🕯 A pullback candle with a moderate real body and long lower wick – suggests buyers attempted to support the fall, but sellers dominated.
🛡 5 Min Intraday Chart
⚔️ Gladiator Strategy Update
ATR: 202.71
IB Range: 139.95 → 🟠 Medium
Market Structure: Balanced
Trade Summary:
❌ No entry triggered by system
📌 Support & Resistance Levels
🔼 Resistance Zones:
24,725 ~ 24,735
24,780 ~ 24,795
24,860 ~ 24,880
🔽 Support Zones:
24,675 ~ 24,660
24,620
24,542 ~ 24,535
24,500
24,470 ~ 24,460
🧠 Final Thoughts
Today's double inside bar structure signals contraction and indecision — markets are waiting for a decisive breakout.
“The tighter the coil, the bigger the breakout.”
Keep an eye on these tight ranges. Patience before power!
✏️ Disclaimer
This is just my personal viewpoint. Always consult your financial advisor before taking any action.
Nifty 50 support and resistance for 6th August We have plotted Nifty 50 resistance and support for 6th Aug.

NIFTY KEY LEVELS FOR 04.08.2025NIFTY KEY LEVELS FOR 04.08.2025
If the candle stays above the pivot point, it is considered a bullish bias; if it remains below, it indicates a bearish bias. Price may reverse near Resistance 1 or Support 1. If it moves further, the next potential reversal zone is near Resistance 2 or Support 2. If these levels are also broken, we can expect the trend.
If the range(R2-S2) is narrow, the market may become volatile or trend strongly. If the range is wide, the market is more likely to remain sideways
📢 Disclaimer
I am not a SEBI-registered financial adviser.
The information, views, and ideas shared here are purely for educational and informational purposes only. They are not intended as investment advice or a recommendation to buy, sell, or hold any financial instruments.
Please consult with your SEBI-registered financial advisor before making any trading or investment decisions.
Trading and investing in the stock market involves risk, and you should do your own research and analysis. You are solely responsible for any decisions made based on this research.
renderwithme | Nifty 50 Under Preasure#Current Market Snapshot
Index Value: As of July 31, 2025, the Nifty 50 closed at approximately 24,565.35 INR, down 0.82% in the past 24 hours.
Recent Performance: Weekly: Down 1.78%.
Monthly: Down 4.00%.
Yearly: Down 1.86%.
Historical Context: The index hit its all-time high of 26,277.35 INR on September 27, 2024, but has since faced downward pressure.
#Technical Analysis
Trend: The Nifty 50 is currently in a bearish phase, with a five-week losing streak, the longest in two years, as over 35 of its constituent stocks posted losses.
The index is trading within a descending channel, with support around 24,475 and resistance at 25,925. A break above 25,925 could signal upside momentum toward, while a drop below 24,400 may indicate further weakness.
Key Indicators:Moving Averages: Mixed signals—30-minute charts show a "Strong Buy," while daily charts indicate a "Strong Sell." Weekly and monthly charts lean toward "Buy."
RSI (Relative Strength Index): Likely in the neutral-to-bearish zone (exact value unavailable), suggesting no extreme overbought or oversold conditions.
Support/Resistance:
Support at 24,475; resistance at 24,925–25,900. A sustained move above 25,000 is critical for bullish sentiment.
#Fundamental Factors
Market Sentiment: Heavy foreign institutional investor (FII) outflows (₹25,000 crore over eight sessions) have pressured the index, though domestic institutional investors (DIIs) have countered with net buying (e.g., ₹6,372.71 crore on a recent session).
Sectors like pharma, textiles, auto components, and electronics faced selling pressure due to trade concerns, particularly U.S. tariff fears under President Trump.
Earnings Impact: Strong Q1 earnings from companies like Mahindra & Mahindra and Tata Steel provided some support, but weak global cues and sector-specific challenges (e.g., pharma with Sun Pharmaceutical’s 5% drop) weighed on the index.
Global Context: The U.S. Federal Reserve’s decision to hold interest rates steady, with no rate cut expected in September, adds uncertainty. Asian markets are also cautious due to trade tensions.
Sectoral PerformanceWeak Sectors: Metals, Oil & Gas, Technology, Pharma, and Textiles saw significant losses.
Resilient Stocks: Stocks like Mahindra & Mahindra and Tata Steel showed strength amid the downturn.
Nifty Constituents: The index includes blue-chip companies like HDFC Bank, ICICI Bank, Reliance Industries, and Tata Motors, which are critical to its movement.
Trading Strategy
Sell on Weakness: Sell below 24,600 with targets at 24,510, 24,380, and 24,150 (stop-loss: 24,860).
Long-Term: The current dip offers attractive valuations for quality investments. A buy-on-dips strategy is recommended if the index holds above 24,475, with potential for a rally toward 26,000 if it sustains above 25,250.
Risk Management: High volatility (India VIX noted in broader market context) and FII outflows warrant caution. Use stop-losses to mitigate risks.
Key RisksGlobal Trade Tensions: U.S. tariffs and geopolitical concerns could continue to drive FII outflows.
Volatility: Persistent sectoral pressure and global economic uncertainty may lead to further downside.
Rupee Movement: The Indian rupee’s recent gain (10 paise to 87.53) provides some stability, but currency fluctuations could impact foreign investment.
Derivatives: Nifty 50 futures and options (e.g., HDFC Bank Options, ICICI Bank Futures) are active, but high risk.
Mutual Funds: Consider funds like ICICI Prudential India Opportunities Fund or Parag Parikh Flexi Cap Fund for diversified exposure.
ConclusionThe Nifty 50 is under pressure due to FII outflows, sectoral challenges, and global uncertainties, with a bearish short-term outlook. However, domestic demand and strong earnings from select companies provide some resilience. Traders should monitor key levels (24,475 support, 25,925 resistance) and adopt a cautious approach with strict risk management. Long-term investors may find current valuations appealing for selective buying, particularly if the index stabilizes above 25,000.For real-time updates, track the Nifty 50on renderwithme page
~~ Disclaimer ~~
This analysis is based on recent technical data and market sentiment from web sources. It is for informational \ educational purposes only and not financial advice. Trading involves high risks, and past performance does not guarantee future results. Always conduct your own research or consult a SEBI-registered advisor before trading.
# Boost and comment will be highly appreciated.

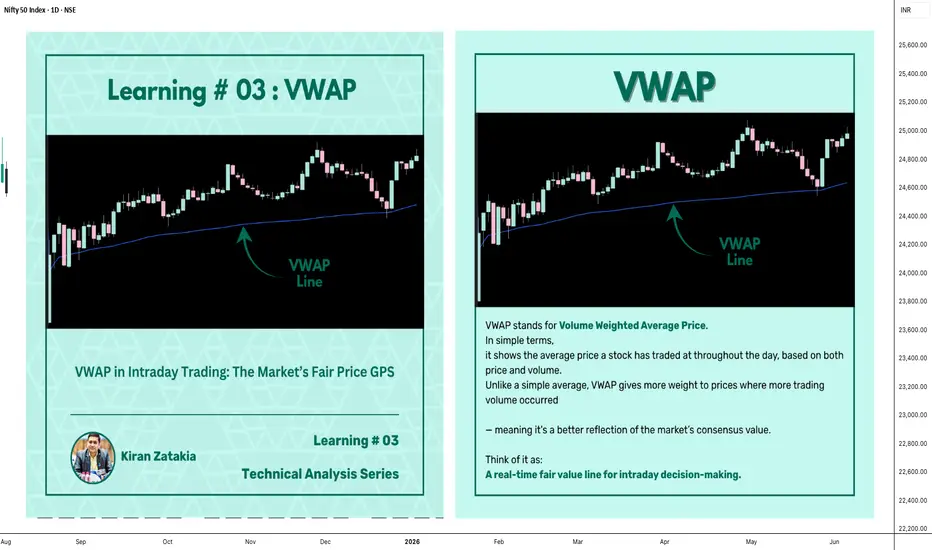
Learning#03 : VWAP in Intraday TradingLearning#03 : VWAP in Intraday Trading
📊 VWAP in Intraday Trading: The Market’s Fair Price GPS
Ever wondered if there’s a level that shows where the real trading action is happening? That’s exactly what VWAP does — it’s like a volume-weighted compass that intraday traders use to orient themselves in the market.
It’s not just another line on your chart. VWAP reflects where institutions and volume-heavy participants are active. That’s why understanding how price interacts with it can give you a serious edge.
Let’s break it down 👇
🧠 What is VWAP?
VWAP stands for Volume Weighted Average Price.
In simple terms, it shows the average price a stock has traded at throughout the day, based on both price and volume.
Unlike a simple average, VWAP gives more weight to prices where more trading volume occurred — meaning it's a better reflection of the market’s consensus value.
Think of it as:
A real-time fair value line for intraday decision-making.
📈 Why VWAP Matters for Intraday Traders
VWAP acts as an intraday anchor. It tells you whether the price is currently trading above or below the day’s volume-weighted average — giving you quick insight into who's in control.
Here’s how to interpret it:
When price is above VWAP, buyers are in control and the bias is bullish.
When price is below VWAP, sellers are dominating and the bias is bearish.
When price is hovering near VWAP, the market is undecided, consolidating, or lacking direction.
In short, VWAP tells you who’s winning the intraday tug of war — and whether it’s even worth stepping in.
⚙️ How to Use VWAP in Your Intraday Strategy
1️⃣ VWAP as a Trend Filter
Before entering a trade, check where price is relative to VWAP:
Price above VWAP with higher lows → Focus on long setups
Price below VWAP with lower highs → Focus on short setups
🔁 Skip counter-trend trades. Stay with the flow.
This helps in trending markets by keeping you aligned with momentum.
2️⃣ VWAP as Dynamic Support or Resistance
VWAP behaves like a magnet. Price often pulls back to it and either:
Rejects (respects the level as support/resistance), or
Breaks and reclaims (signaling a potential reversal)
Use it alongside:
Flag patterns
Inside bars
Break-and-retest structures
3️⃣ VWAP Reversion Play (Snapback Trade)
This is a mean-reversion setup:
Price moves quickly away from VWAP at open
No strong follow-through, signs of exhaustion
Take a counter-trend trade back to VWAP
⚠️ Avoid this in strong trending markets — best used in choppy or fading environments.
4️⃣ VWAP with Price Action for Structure
Pair VWAP with clean price action:
Mark support and resistance zones
Observe price behavior near VWAP
Look for confirmation: inside bars, rejection wicks, engulfing candles
🎯 This adds logic and clarity to your entries — no random trades.
🔍 Bonus VWAP Tips
Combine VWAP with:
CPR (Central Pivot Range) for confluence zones
Opening range for breakout bias
Volume profile to spot high interest areas
These combos create strong, repeatable trade setups.
✅ VWAP Recap: Why It Matters
Here’s a quick breakdown of how VWAP can sharpen your intraday trading game:
Bias Building: VWAP helps confirm whether the market structure is bullish or bearish, giving you a reliable directional bias.
Trend Filtering: It keeps you aligned with the current momentum by filtering out counter-trend trades.
Pullback Entries: VWAP acts as a dynamic support or resistance level, offering clean zones to enter trades during pullbacks.
Mean Reversion: In sideways or fading markets, VWAP becomes a natural magnet — allowing you to target price reversions.
Risk Management: It provides logical reference points for placing stop-losses and defining entry zones, adding clarity to your risk-reward planning.
✍️ Final Thoughts
VWAP may sound simple, but it brings real structure to intraday trading.
It tells you where volume met price, and that’s powerful. When used with price action, it creates a solid framework for:
Building directional bias
Finding clean entries
Managing risk like a pro
VWAP doesn’t predict — it reflects. And in trading, reflection is more useful than prediction.
🛎️ Respect VWAP. Trade with structure.
— Kiran Zatakia
Nifty Analysis EOD – August 2, 2025 – Friday🟢 Nifty Analysis EOD – August 2, 2025 – Friday 🔴
Trapped at the Top, Slammed at the Close – Bulls Burnt Out!
🗓️ Nifty Summary
With the continuation of yesterday's hidden weakness, today's session gave early hope but ended with a bearish surprise. Nifty opened near the key support zone of 24,735 ~ 24,725, hovered indecisively, then suddenly rallied to 24,780, trapping bulls just under resistance.
But the trap was set.
A sharp reversal followed as Nifty broke not just the day’s low, but also the previous day’s support zone of 24,660 ~ 24,675, pulling the index lower into the 24,565.35 close — the second lowest close since May 12.
A fierce 2–3 hour tug-of-war between bulls and bears took place in a tight 40–50 point range until 2:50 PM, when bulls gave up—leading to a 100+ point fall in the last half-hour. shocked many traders, especially those fatigued from the earlier choppy action.
Much like yesterday, both sides of the trade were available today.
Did you catch them?
Zoom Out View :
Today’s close is just 23 points above the June 3 close, wiping out nearly 59 sessions (81 days) of gain.
Will the zone of 24460 ~ 24542 provide support again, or are we headed for a retest of the 24000 ~ 23800 and 23200 ~ 22800 (Pattern Target and Virgin) range?
Yes, you read correctly 23200 ~ 22800…!
Not so soon…but eventually…!
wish you tell me crazy and hope I am wrong…!
📈 5 Min Time Frame Chart with Intraday Levels
📉 Daily Time Frame Chart with Intraday Levels
🕯️ Daily Candle Breakdown
Open: 24,734.90
High: 24,784.15
Low: 24,535.05
Close: 24,565.35
Change: −203.00 (−0.82%)
Candle Structure
🔴 Large bearish body (169.55 pts)
☁️ Moderate upper wick (49.25 pts)
⬇️ Short lower wick (30.30 pts)
Interpretation
Opened lower, climbed early but failed at 24,780+.
Selling dominated the rest of the session, closing near lows.
Moderate upper wick shows early bullish attempt was rejected.
Candle Type
Bearish Marubozu-like – clear seller dominance.
Key Insight
Sellers defended 24,780–24,800 zone.
Closing near 24,560 keeps the short-term bias bearish.
Next support: 24,500, 24,470 ~ 24460
⚠️ Bulls must reclaim 24,735+ on closing basis to neutralize sentiment.
🛡 5 Min Intraday Chart
⚔️ Gladiator Strategy Update
ATR: 212.37
IB Range: 87.55 → Medium
Market Structure: Balanced
Trades Triggered
🕙 10:05 AM – Long Entry → 🎯 Target Hit (R:R – 1:1)
🕚 11:09 AM – Short Entry → 🎯 Target Hit (R:R – 1:2)
🔍 Trade Summary
Both sides were offered—clean hit on long and solid breakdown on short. A Gladiator’s delight.
📊 Support & Resistance Levels
🔼 Resistance Zones
24620
24660 ~ 24675
24725 ~ 24735
24780 ~ 24795
24860 ~ 24880
🔽 Support Zones
24,542 ~ 24,535
24,500
24,470 ~ 24,460
24,380
💬 Final Thoughts
"Traps are laid where confidence is highest. Stay alert, stay flexible."
A textbook day where patience paid off — those who didn’t force trades were rewarded with clean moves in both directions.
✏️ Disclaimer
This is just my personal viewpoint. Always consult your financial advisor before taking any action.

Time to be cautious Nifty is at make or break levels, Be careful about general market trends before jump into any new trades.
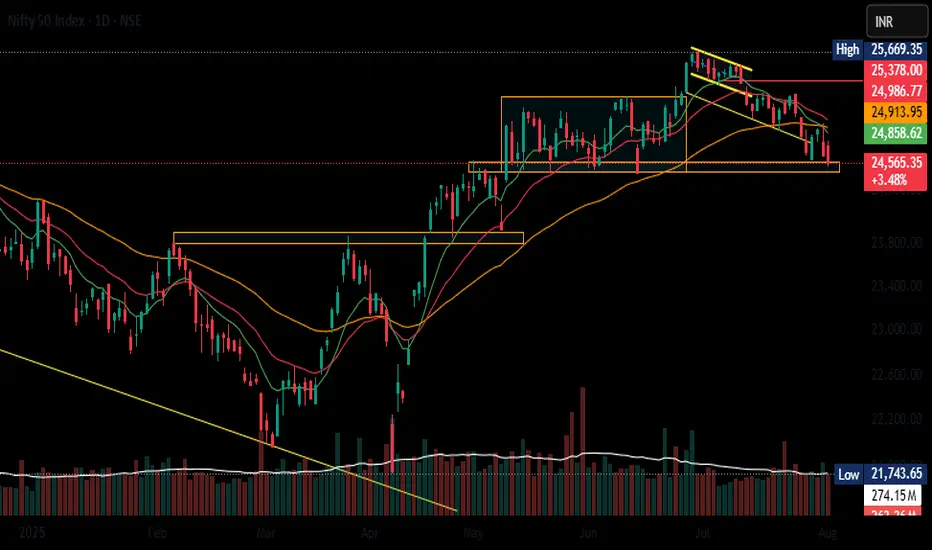
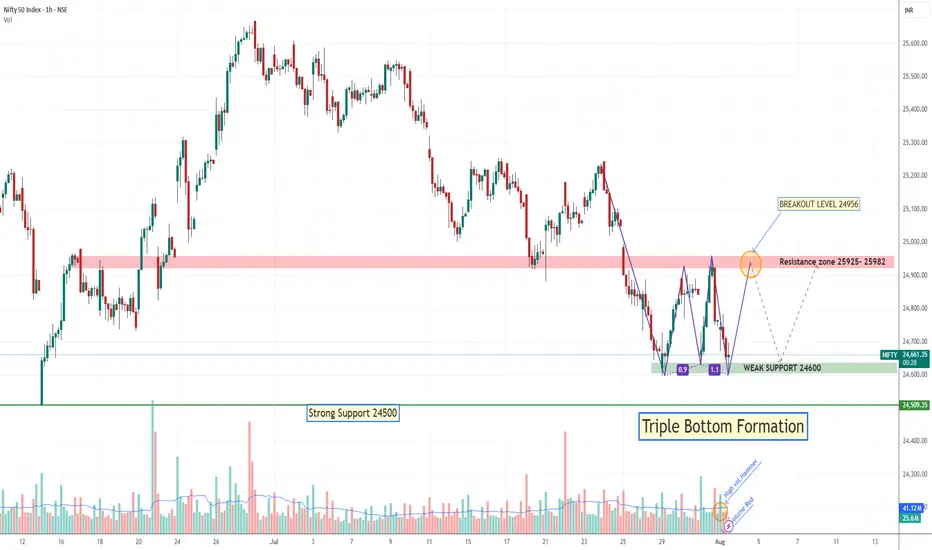
Tripple Bottom Formation if Hold 24600Nifty 3rd Time Tested 24600 level if it Break next Strong support 24500, if hold then may rallied again till 24956. May be Falling red candle is just testing candle of High-volume Hammer.
nifty 01/08/2025I am not SEBI Registered analyst. this is for education purpose only. this is only my view. please do own research before innate a trade or making investment plan. technical analysis are probability only.

In addition to previous positional trade with targetThis are no buy sell recommendation but sharing for learning purpose only.
#NIFTY August 1st view#NIFTY August 1 st View : NSE:NIFTY Currently doing wave 3, and around buying zone, lets add up Nifty future and Nse Stocks for fresh high from Aprils low

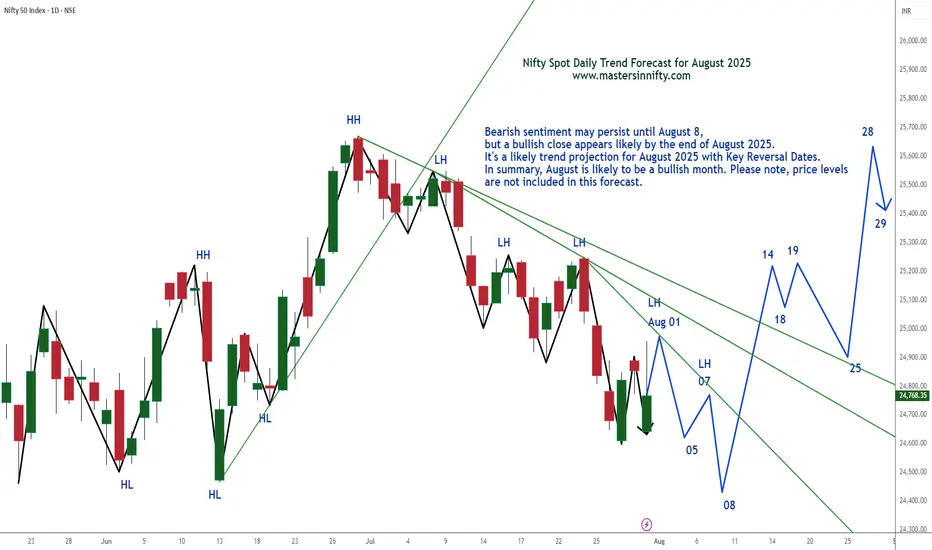
Nifty Spot Index Projection Line for August 2025Bearish sentiment may persist until August 8, but a bullish close appears likely by the end of August 2025.
It's a likely trend projection for August 2025 with Key Reversal Dates. In summary, August is likely to be a bullish month. Please note, price levels are not included in this forecast.
Traders are suggested to conduct own technical studies before entering into the trades and proper risk management is a must.
This is just my personal view.
Best of Luck & Happy Trading.
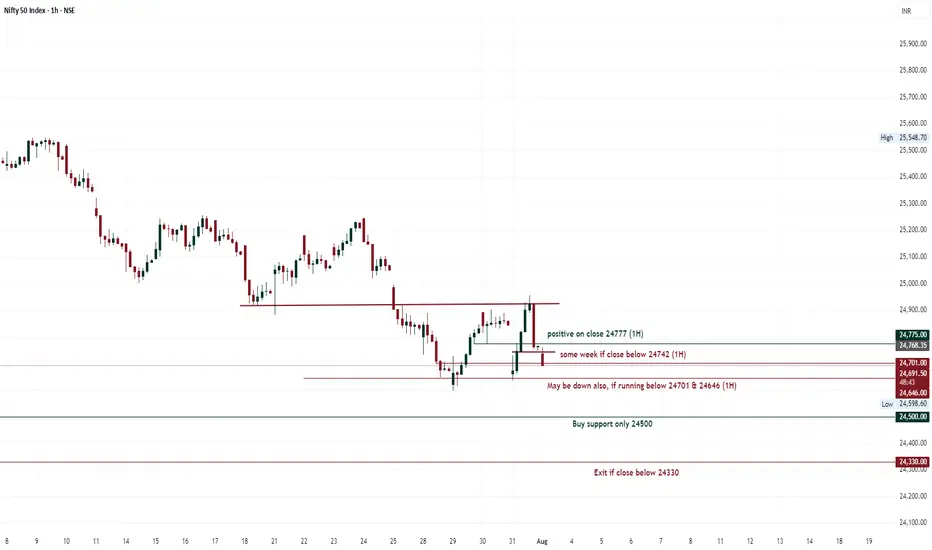
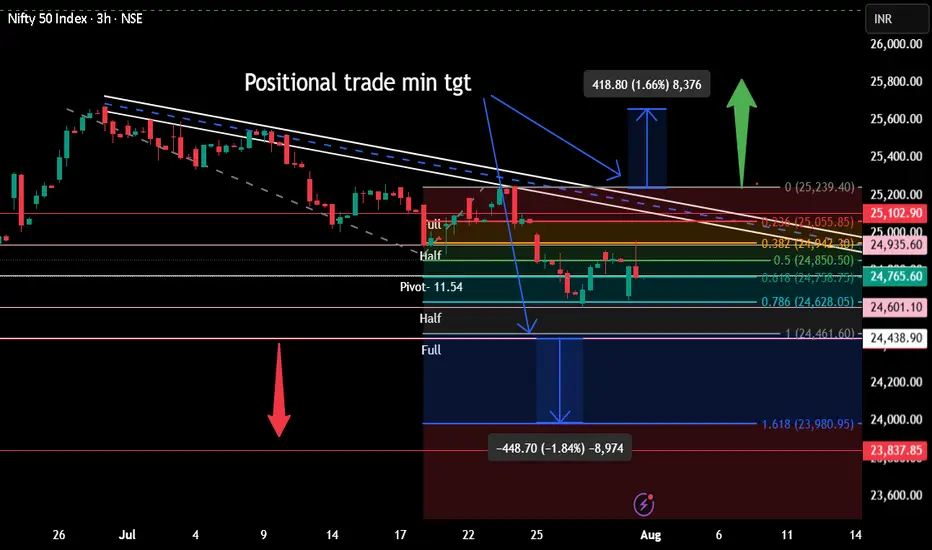
Positional tradeAt present market is for scalper/intraday trader. Positional trade to be done only once,
1. 24438 is crossed on day closing basis. Bearish view
2. 25102 is crossed on day closing basis. Bullish view
Pivot- Half-Full are weekly range and applicable only till 7th August.
Vertical lines are important times for intraday as buyer
