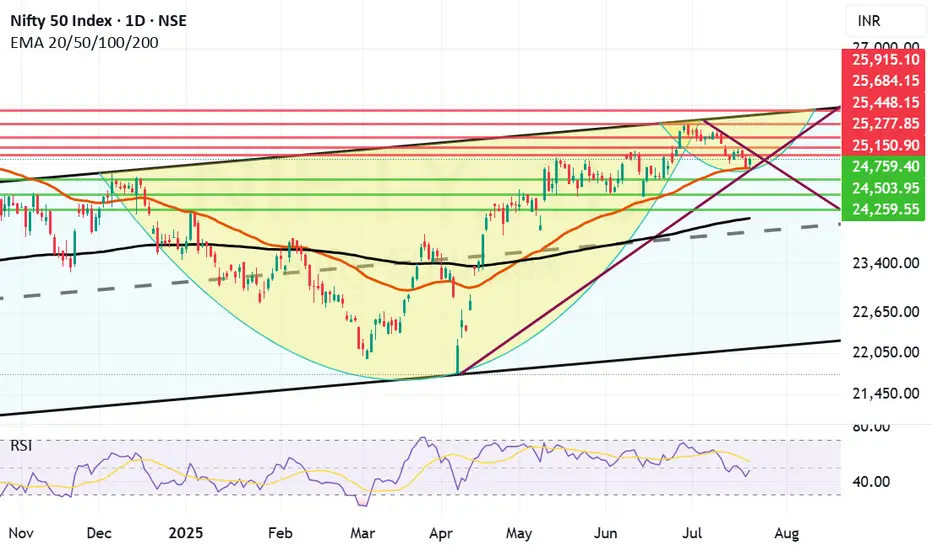
Long term Goal on Nifty 50Nifty should break 25,300 to reach the next level.
The Fib Retracement shows 26,200 as the next resistend, if India has more positive news and supported by Corporate results. It should break it. But as of now today(24/7/2025), the corporate results are mixed, today is infosys result after market, which may be crucial to watch. There should be some reforms backed by Government support may change the market direction. The FII are selling for a while. Tech is at its peak with AI and Robotics. NASDAQ is its all time high, Bitcoin is sky-rocketing, when is the Nifty touches its next peek.
what do you think of it.?
share your comments.
NIFTY trade ideas

NIFTY S/R for 24/7/25Support and Resistance Levels:
Support Levels: These are price points (green line/shade) where a downward trend may be halted due to a concentration of buying interest. Imagine them as a safety net where buyers step in, preventing further decline.
Resistance Levels: Conversely, resistance levels (red line/shade) are where upward trends might stall due to increased selling interest. They act like a ceiling where sellers come in to push prices down.
Breakouts:
Bullish Breakout: When the price moves above resistance, it often indicates strong buying interest and the potential for a continued uptrend. Traders may view this as a signal to buy or hold.
Bearish Breakout: When the price falls below support, it can signal strong selling interest and the potential for a continued downtrend. Traders might see this as a cue to sell or avoid buying.
MA Ribbon (EMA 20, EMA 50, EMA 100, EMA 200) :
Above EMA: If the stock price is above the EMA, it suggests a potential uptrend or bullish momentum.
Below EMA: If the stock price is below the EMA, it indicates a potential downtrend or bearish momentum.
Trendline: A trendline is a straight line drawn on a chart to represent the general direction of a data point set.
Uptrend Line: Drawn by connecting the lows in an upward trend. Indicates that the price is moving higher over time. Acts as a support level, where prices tend to bounce upward.
Downtrend Line: Drawn by connecting the highs in a downward trend. Indicates that the price is moving lower over time. It acts as a resistance level, where prices tend to drop.
Disclaimer:
I am not a SEBI registered. The information provided here is for learning purposes only and should not be interpreted as financial advice. Consider the broader market context and consult with a qualified financial advisor before making investment decisions.
#nifty directions and levels for July 24Good morning, friends! 🌞
Here are the market directions and levels for July 24th:
The global market is showing a moderately bullish sentiment.
Meanwhile, the local market is also exhibiting a moderately bullish tone.
Today, Gift Nifty indicates a gap-up opening of around 60 points.
What can we expect today?
In the previous session, both Nifty and Bank Nifty took a solid pullback.
At the same time, the open interest also shifted to the bullish side.
So, if the gap-up sustains, we can expect the pullback continuation.
Also, as it’s a new moon day(for south), some volatility can be expected.
Let’s look at the charts:
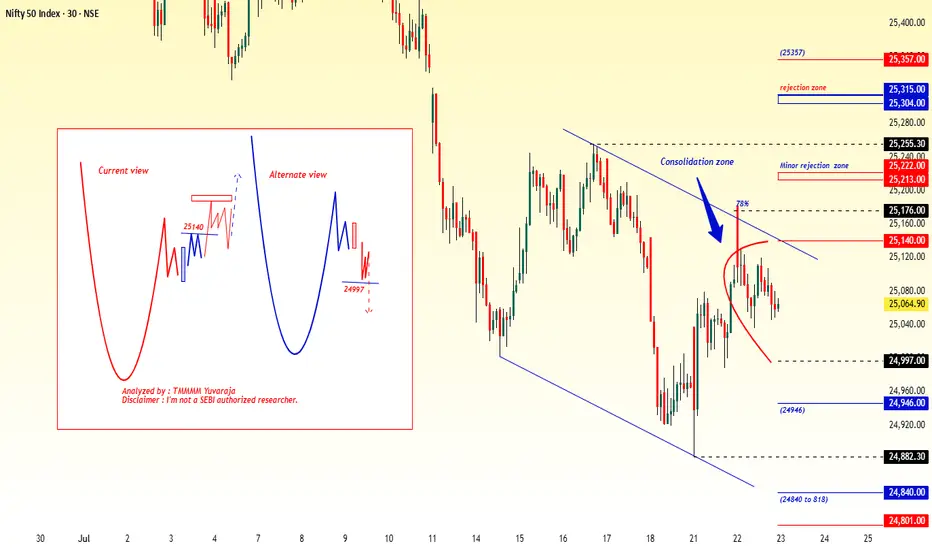
Current View:
The current view suggests that, as mentioned above,
if the gap-up sustains, we can expect a rally continuation with some consolidation.
In this case, the parameters are showing slight strength,
so the rejection zone may act just around the minor resistance.
Alternate View:
The alternate view suggests that
if the gap-up does not sustain or if the market rejects near immediate resistance with a solid reversal,
then we can expect a minor correction of around 23% to 38%.
However, unless the market breaks below the 38% level,
we cannot confirm a reversal into a bearish trend.

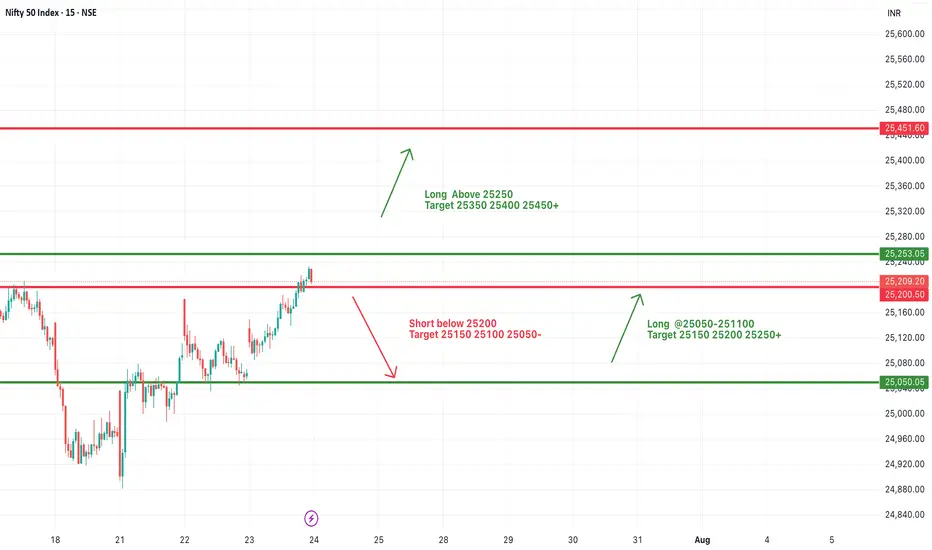
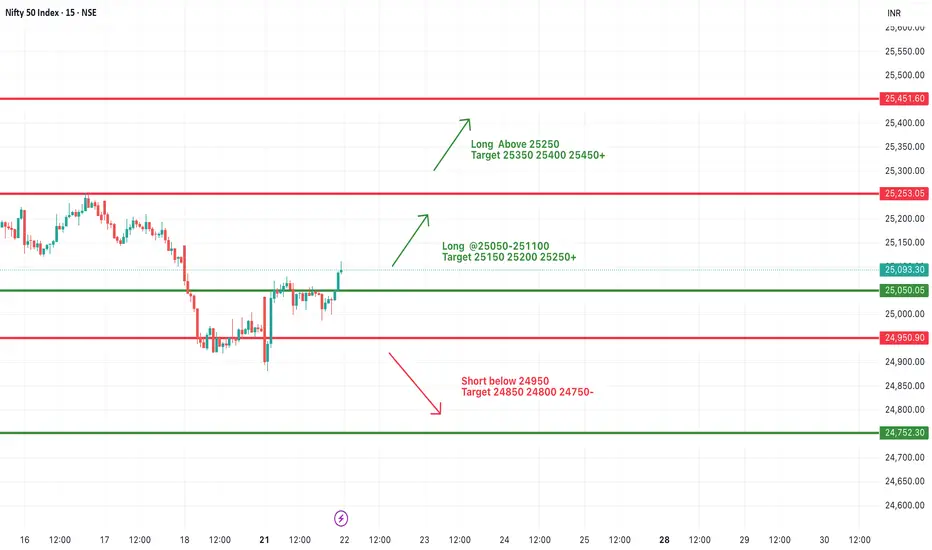
#NIFTY Intraday Support and Resistance Levels - 24/07/2025Nifty is expected to open with a bullish gap-up today, breaching the 25,250 resistance zone. This level has been acting as a consolidation ceiling in recent sessions, and today’s opening above it indicates strong buying momentum in the market.
If Nifty sustains above 25,250, we may witness a fresh upside rally towards the immediate targets of 25,350, 25,400, and 25,450+. A decisive breakout above this zone would mark the continuation of the upward trend and may attract aggressive long-side participation.
On the downside, if Nifty slips and sustains below 25,200–25,250, weakness could resume. A break below 25,200 may lead to a correction toward 25,150, 25,100, and possibly even 25,050-, which will now act as a crucial support zone.
Overall, today's session may remain bullish above 25,250 with momentum trades favored on the long side.
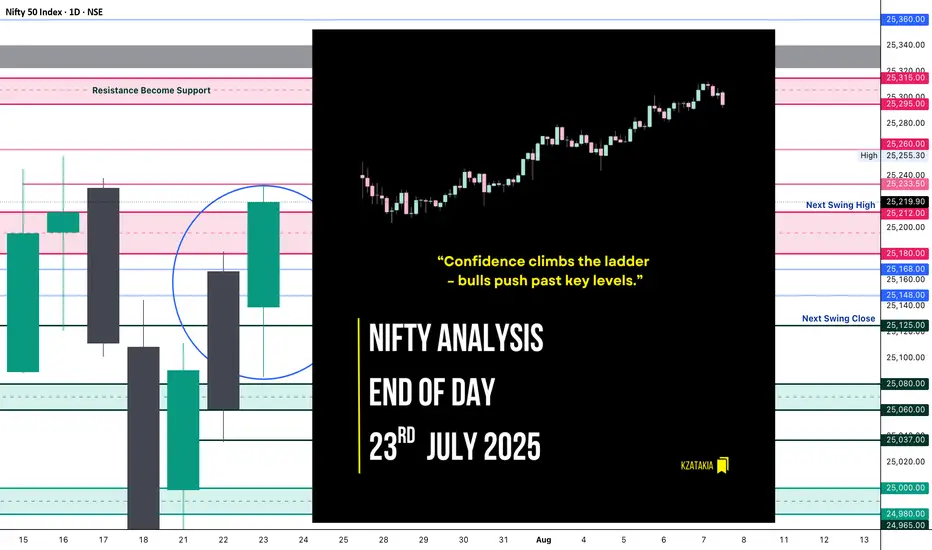
Nifty Analysis EOD – July 23, 2025 – Wednesday 🟢 Nifty Analysis EOD – July 23, 2025 – Wednesday 🔴
“Confidence climbs the ladder – bulls push past key levels.”
Nifty opened with a Gap Up of 78 points and initially retraced 54 points, finding solid footing around the CPR Zone. Once reclaimed VWAP, the index climbed in a methodical, low-volatility uptrend, breaking one resistance after another: CDH, R1, 25150, PDH, and the key zone 25200~25212 — finally touching the anticipated resistance at 25333, and closing just below that at 25219.90, close to the day’s high.
📌 Flashback from Yesterday's Note:
“If this is truly a retracement, 25K must hold in upcoming sessions, and bulls will need to reclaim 25,200 to regain their grip.”
👉 This expectation played out to perfection today — gradual yet confident bullish strength led Nifty to reclaim 25200 and close above it.
🔍 Today’s close of 25220 is higher than the last 7 sessions, suggesting a bullish shift in structure. However, bulls now face the real test — breaching the 25300 ~ 25350 resistance zone.
🕯 5 Min Time Frame Chart with Intraday Levels
🕯 Daily Time Frame Chart with Intraday Levels
🕯️ Daily Candle Breakdown
Open: 25,139.35
High: 25,233.50
Low: 25,085.50
Close: 25,219.90
Change: +159.00 (+0.63%)
Candle structure analysis:
Real body: Green body = 80.55 pts → strong bullish body
Upper wick: 13.60 pts → very small
Lower wick: 53.85 pts → moderate
Candle Interpretation:
The session opened stable, dipped to 25,085, but strong buyers showed up, helping price climb throughout the day and close near high. A firm green candle, signaling buyers in control.
Candle Type:
A Bullish Marubozu–like candle, not perfectly clean but represents strong continuation momentum.
Key Insight:
Close above 25200 confirms a bullish grip
If price holds above 25220–25250, next push could be towards 25280–25330
Immediate support now moves to 25,120–25,140
🛡 5 Min Intraday Chart
⚔️ Gladiator Strategy Update
ATR: 181.35
IB Range: 64.35 → Medium
Market Structure: Balanced
Trades Triggered:
⏱️ 10:45 AM – Long Entry → Trailing SL Hit (1:2.65 RR)
🔁 Support & Resistance Levels
Resistance Zones:
25,180 ~ 25,212
25,233
25,260
25,295 ~ 25,315
25,340 ~ 25,322 (Gap Zone)
Support Zones:
25,168
25,125
25,080 ~ 25,060
25,037
🧠 Final Thoughts
“Momentum is not magic—it’s built one level at a time.”
Bulls showed strength with control and consistency today. With 25200 reclaimed, they now hold the ball — next challenge lies at the gates of 25300–25350. Will they break through or pause for breath? Tomorrow holds the answer.
✏️ Disclaimer:
This is just my personal viewpoint. Always consult your financial advisor before taking any action.
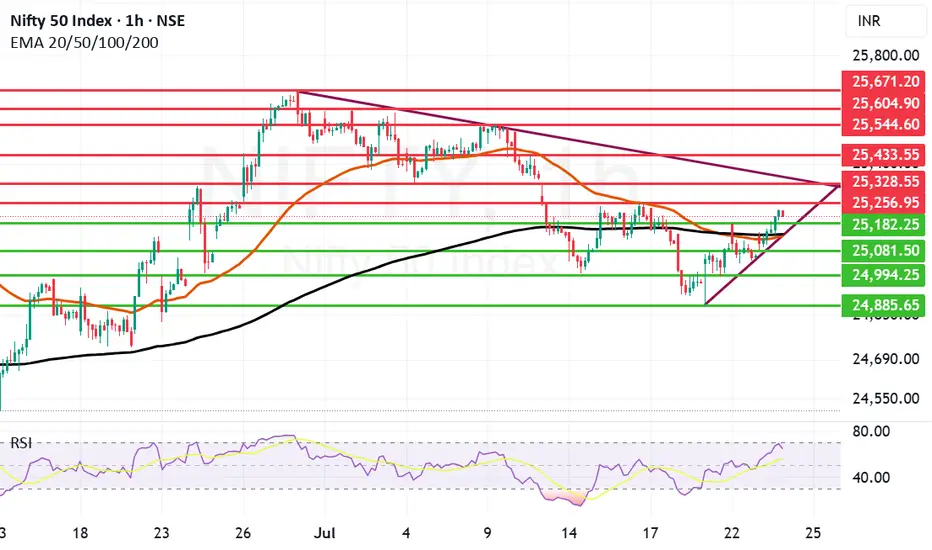
Strong Comeback by Nifty few Resistances ahead.Nifty made a remarkable comeback today ending 159 points up closing at 25219. Infosys has posted better than expected result and as of now the Infosys ADR is up by 1.26%. So if there is a turnaround in the IT sector we can see Nifty fly upwards.
The next resistance ahead of Nifty is at 25256 if we get a closing above this the next will be at 25328. These 2 will be critical resistances to cross. Once we get a closing above 25328 Nifty can target 25433 and 25544. Above 25544 Nifty becomes very strong. In case Nifty is not able to cross 25256 or 25328 levels the supports for Nifty are at 25182. After this zone there is a dual support of Mother and Father line of Hourly chart at 25136 and 25142.
These are very strong supports. (Thus the zone between 25182 to 25136 is full of supports). We hope that these supports are held. In case we get a closing below 25136 Nifty will again fall into bearish territory and can plunge towards 25081, 24994 or even 24885.
The shadow of the candles right now is positive but 2 very important resistances mentioned earlier are yet to crossed so game is in balance but only slightly in favour of Bulls.
Disclaimer: The above information is provided for educational purpose, analysis and paper trading only. Please don't treat this as a buy or sell recommendation for the stock or index. The Techno-Funda analysis is based on data that is more than 3 months old. Supports and Resistances are determined by historic past peaks and Valley in the chart. Many other indicators and patterns like EMA, RSI, MACD, Volumes, Fibonacci, parallel channel etc. use historic data which is 3 months or older cyclical points. There is no guarantee they will work in future as markets are highly volatile and swings in prices are also due to macro and micro factors based on actions taken by the company as well as region and global events. Equity investment is subject to risks. I or my clients or family members might have positions in the stocks that we mention in our educational posts. We will not be responsible for any Profit or loss that may occur due to any financial decision taken based on any data provided in this message. Do consult your investment advisor before taking any financial decisions. Stop losses should be an important part of any investment in equity.
Nifty trading in a rangeNifty Outlook:
Current Zone: Nifty has bounced from the 25,000 support and is now testing resistance at the 25,200–25,250 zone.
Immediate Resistance: 25,200–25,250 is a strong supply zone. A decisive breakout above this range is needed for further upside.
Upside Targets: If 25,250 is cleared, expect momentum toward 25,350 and 25,500.
Support Levels: 25,000 remains a strong support; below this, trend weakens with downside risk to 24,900.
Outlook: As long as Nifty holds 25,000, bias remains positive. Watch for a breakout above 25,250 to confirm fresh upside. Until then, expect range-bound action.

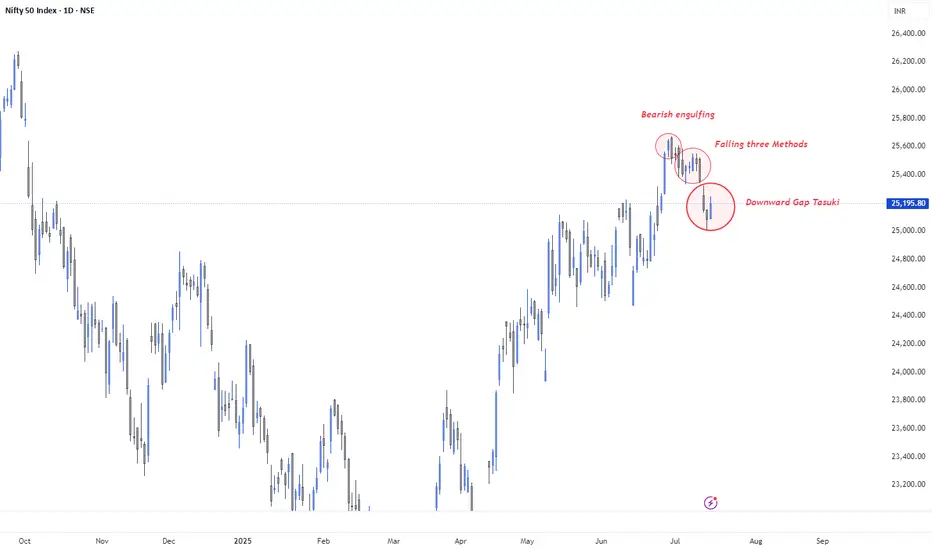
Candlestick Confluence: Bearish Signals in a Bullish Trend🔹 30 June – Bearish Engulfing
A large bearish candle fully engulfed the prior bullish day, forming at new highs (~25,790). Classic sign of distribution after an extended uptrend. This marked the beginning of the current corrective leg.
🔹 3 to 10 July – Falling Three Methods
After the initial drop, price consolidated in a tight range. Three small-bodied candles (4–9 July) signaled indecision. On 10 July, a strong bearish continuation candle confirmed the Falling Three Methods pattern — strengthening the downside move.
🔹 15 July – Downward Gap Tasuki
A bearish gap formed between 12–14 July. On 15 July, a small bullish candle emerged but failed to fill the gap — forming a Downward Gap Tasuki, a bearish continuation pattern. While this is typically a trend-continuation signal, it's forming within a primary uptrend, making follow-through uncertain.
🧠 Trend Context: Bullish Dominance Meets Short-Term Exhaustion
Despite these bearish candlestick formations, the broader trend from April remains structurally bullish. This confluence of reversal + continuation signals indicates:
Controlled profit-booking at highs
Low conviction from bulls near resistance
Possible mid-trend correction, not a trend reversal (yet)
🔎 Key Technical Levels to Watch
📉 Support Zones:
25,050: Immediate swing low (14 July)
24,850: Prior breakout zone
24,600: Horizontal support from mid-June
📈 Resistance Zones:
25,300 – 25,350: Gap resistance from 12–15 July
25,500: Key rejection zone from recent highs
25,650 – 25,700: All-time highs
⚠️ Market Psychology
Bulls are still in control on the higher timeframe, but the emergence of strong bearish patterns suggests hesitation at the top.
With Indian CPI easing and RBI’s neutral stance, macro still supports the bullish narrative — but the technical structure is flashing red flags in the short term.
🧾 Conclusion
"Nifty Spot has printed a sequence of reliable bearish candlestick formations — Bearish Engulfing (30 June), Falling Three Methods (3–10 July), and Downward Gap Tasuki (15 July). While these indicate short-term pressure, the broader uptrend remains intact. A close below 25,050 could trigger a deeper correction to 24,850–24,600. Bulls need to decisively reclaim 25,400+ to nullify the bearish setup and resume the uptrend."
#Nifty50
#NiftyAnalysis
#NiftyTechnicalAnalysis
#NSEIndia
#IndianStockMarket
#BearishEngulfing
#FallingThreeMethods
#TasukiGap
#CandlestickPatterns
#PriceAction
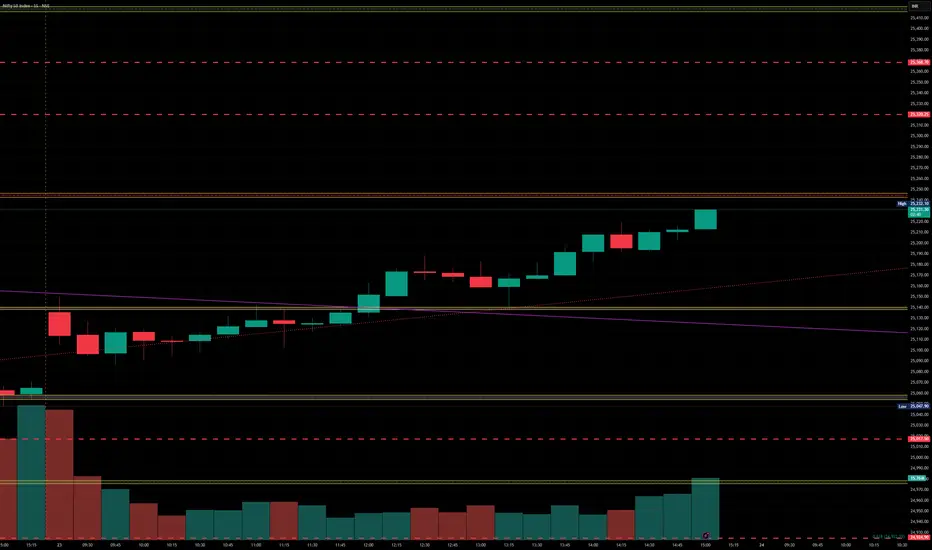
Nifty levels - Jul 24, 2025Nifty support and resistance levels are valuable tools for making informed trading decisions, specifically when combined with the analysis of 5-minute timeframe candlesticks and VWAP. By closely monitoring these levels and observing the price movements within this timeframe, traders can enhance the accuracy of their entry and exit points. It is important to bear in mind that support and resistance levels are not fixed, and they can change over time as market conditions evolve.
The dashed lines on the chart indicate the reaction levels, serving as additional points of significance to consider. Furthermore, take note of the response at the levels of the High, Low, and Close values from the day prior.
We hope you find this information beneficial in your trading endeavors.
* If you found the idea appealing, kindly tap the Boost icon located below the chart. We encourage you to share your thoughts and comments regarding it.
Wishing you success in your trading activities!
Todays nifty market analysis.if nifty sustains above 25150 expecting a target of 25225.
you can expect a bearish momentum below 25118. Target will be 25050.

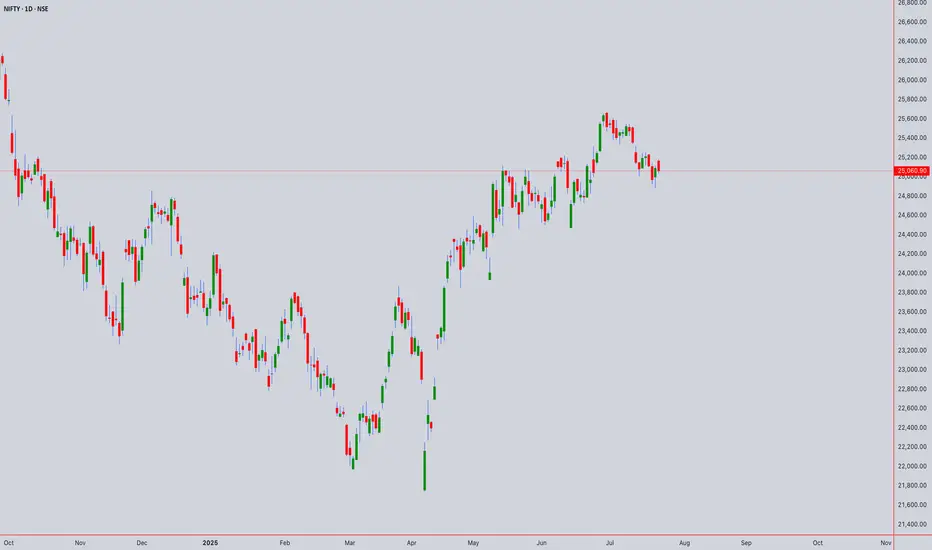
Comprehensive Technical Analysis: NIFTY50 ₹25060.90 as of 22/07Long-Term (Monthly/Weekly) - SWING PERSPECTIVE
Trend & Structure:
Elliott Wave:
Primary Trend: Bullish (Wave 3 or 5 ongoing since 2023).
Current Phase: Likely final sub-wave (Wave 5) targeting ₹25,800–26,200.
Risk: Completion of Wave 5 may trigger a 10–15% correction (ABC pattern) toward ₹22,500–23,000 (38.2% Fib retracement).
Wyckoff & Volume:
Accumulation/Distribution: Monthly volume declining near highs → early distribution signals.
Key Level: Close below ₹24,800 confirms distribution phase (bearish reversal).
Gann Analysis (Price-Time Squaring):
Square of 9:
Key Resistance: ₹25,317 (√25,060 ≈ 158.3; 158.5² = 25,132 → 159² = 25,281).
Major Support: ₹24,649 (157.5²), ₹24,000 (psychological + Gann 45° angle).
Time Cycle:
Aug-Sep 2025 critical for reversal (90-day cycle from April 2025 high).
Ichimoku (Weekly):
Kumo Cloud: Price above cloud → bullish bias.
Lagging Span (Chikou): Above price (26 weeks back) → no congestion.
Warning: Tenkan (9) below Kijun (26) on weekly → momentum loss.
Moving Averages (Weekly):
Bullish Stacking: EMA(20) > EMA(50) > SMA(100) → trend intact.
Support: EMA(20) at ₹24,200
Medium-Term (Daily/4H) - SWING ENTRY
Candlestick Patterns:
Daily: Doji/Spinning Top near ₹25,060 → indecision.
4H: Bearish Shooting Star → resistance at ₹25,150–25,200.
Harmonic Patterns:
Bullish Bat potential (PRZ: ₹24,600–24,750).
Bearish Crab if price rejects ₹25,300 (PRZ: ₹25,280–25,350).
Gann Angles:
1x1 Angle Support (from June 2025 low): ₹24,900 (break → accelerates selling).
Price-Time Squaring:
24th July = 180° from Jan 2025 low → watch for volatility.
RSI + Bollinger Bands (Daily):
RSI(14): 68 (neutral-bearish divergence → weakening momentum).
BB(20,2): Price near upper band (₹25,200) → overbought.
VWAP (4H): Price above VWAP → intraday bullish, but divergence at highs.
Intraday (1H/30M/15M/5M)
Ichimoku (1H):
Tenkan (9) > Kijun (26): Bullish.
Kumo Twist: Support at ₹24,950 (cloud top).
Sell Signal: If price breaks below Kijun (₹25,010).
Moving Averages (30M):
EMA(20): ₹25,040 (intraday support).
Death Cross: EMA(20) < SMA(50) on 15M → short-term bearish.
RSI + BB (15M):
RSI(14): 72 → overbought.
BB Squeeze: Bands narrowing → expect breakout (bearish bias below VWAP).
Gann Intraday Levels (5M):
Resistance: ₹25,100 (1x1 angle), ₹25,180 (2x1).
Support: ₹24,980 (1x1 downside), ₹24,920 (2x1).
Synthesis & Trading Plan
Bullish Scenario (Swing):
Trigger: Hold above ₹24,900 (Gann 1x1) + RSI > 60 on weekly.
Target: ₹25,800–26,200 (Wave 5, Gann Square 159²).
Stop Loss: ₹24,650 (Harmonic Bat PRZ).
Bearish Reversal (Intraday/Swing):
Trigger: Close below ₹24,950 (Ichimoku cloud) + RSI < 50.
Target: ₹24,600 (Harmonic Bat), ₹24,000 (monthly SMA).
Stop Loss: ₹25,200 (Bollinger upper band).
Intraday Levels (23rd July):
Resistance Support
₹25,100 (1H VWAP) ₹25,000 (psych)
₹25,180 (Gann 2x1) ₹24,950 (Ichimoku)
₹25,280 (Sq9) ₹24,800 (daily pivot)
Key Risk Factors
Gann Time Cycle: 24–28 July = high volatility (price-time square).
Elliott Terminal Wave: Wave 5 exhaustion → strict stop losses.
VWAP Divergence: Failure to hold above VWAP on 4H → short.
Instrument: NIFTY50
Strategy:
Swing: Wait for daily close above ₹25,150 (confirms bullish) or below ₹24,800 (bearish).
Intraday: Sell rallies to ₹25,100–25,150 (RSI>70, BB squeeze) for ₹24,950.
Verified Tools:
Gann Square of 9 + Ichimoku for precision entries.
RSI/BB for overbought/oversold filters.
For those interested in further developing their trading skills based on these types of analyses, consider exploring the mentoring program offered by Shunya Trade.(world wide web shunya trade)
I welcome your feedback on this analysis, as it will inform and enhance my future work.
Regards,
Shunya Trade
world wide web shunya trade
⚠️ Disclaimer: This post is educational content and does not constitute investment advice, financial advice, or trading recommendations. The views expressed here are based on technical analysis and are shared solely for informational purposes. The stock market is subject to risks, including capital loss, and readers should exercise due diligence before investing. We do not take responsibility for decisions made based on this content. Consult a certified financial advisor for personalized guidance.
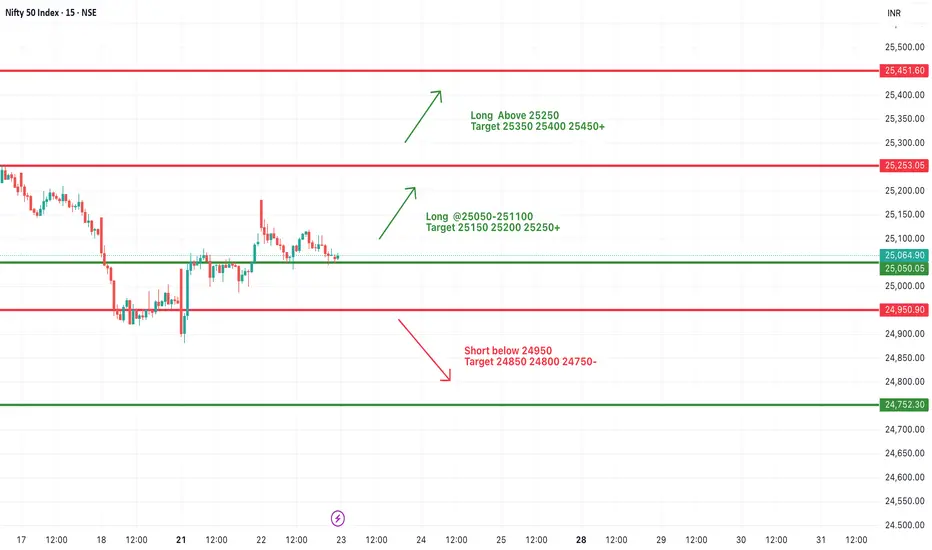
#NIFTY Intraday Support and Resistance Levels - 23/07/2025Nifty is expected to open with a gap-up today, continuing its sideways movement within a tight range. There are no significant changes in key levels from the previous session, indicating a consolidative phase in the market. Price action near these levels will be crucial for intraday direction.
On the upside, a bullish continuation can be expected if Nifty sustains above 25,050–25,100. This zone has been acting as a breakout point, and a sustained move above can lead to an intraday rally toward 25,150, 25,200, and 25,250+. Further strength will be confirmed if Nifty crosses 25,250, opening the possibility to test 25,350, 25,400, and even 25,450+ levels.
On the downside, if Nifty breaks below 24,950, it may trigger a short setup with potential downside targets of 24,850, 24,800, and 24,750-. This breakdown would indicate weakness, especially if it comes with volume.
#Nifty directions and levels for July 23rd:Good morning, friends! 🌞
Here are the market directions and levels for July 23rd:
The global market shows no major changes and continues to maintain a moderately bearish sentiment.
Meanwhile, the local market is exhibiting a moderately bullish tone. Today, Gift Nifty indicates a gap-up opening of around 60 points.
What can we expect today?
In the previous session, both Nifty and Bank Nifty couldn't sustain the gap-up start. Structurally, we are still in an unclear zone.
However, my expectation is that today’s market may take some consolidation after the gap-up start.
Looking at the chart, the current view suggests:
* If the market sustains the gap-up and breaks the immediate resistance, we can expect the pullback to continue with a moderately bullish tone.
Alternate view:
* If the gap-up doesn’t sustain and the market declines initially, it may reach the immediate support level.
* If a pullback happens from there, we can expect a range-bound market.
* Conversely, if the support breaks, the correction is likely to continue.
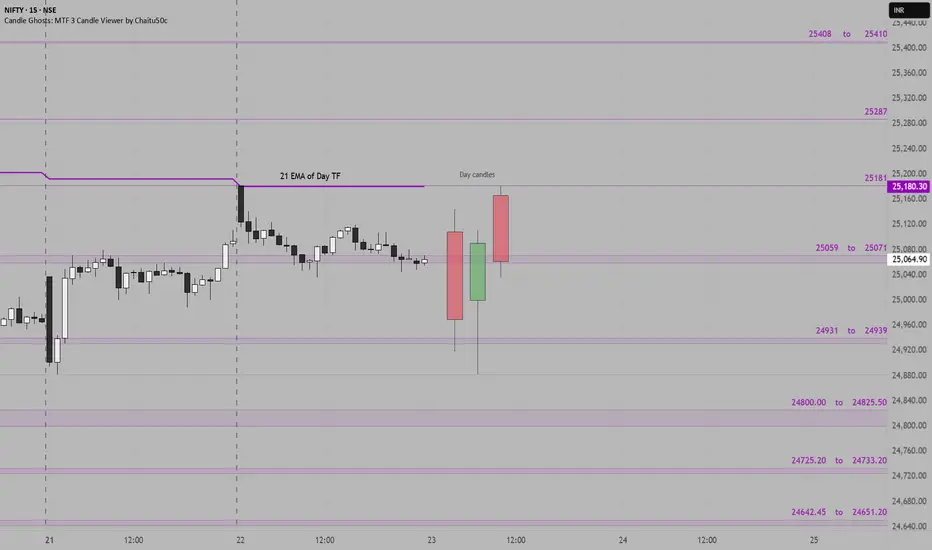
Nifty Support & Resistance Zones for 23rd July 2025The following support and resistance zones have been identified for Nifty based on recent price structure, candle reactions, and high-activity price clusters:
Resistance Zones:
25408 – 25410
25287
25181
25059 – 25071
Support Zones:
24931 – 24939
24800 – 24825.50
24725.20 – 24733.20
24642.45 – 24651.20
Yesterday Nifty formed a strong bullish day candle after testing support near 24800, showing signs of recovery. If the price holds above 25070, we may see a move toward 25181 and possibly 25287.
These levels act as potential zones of reaction and should be used with confirmation via price action or volume triggers during live market.
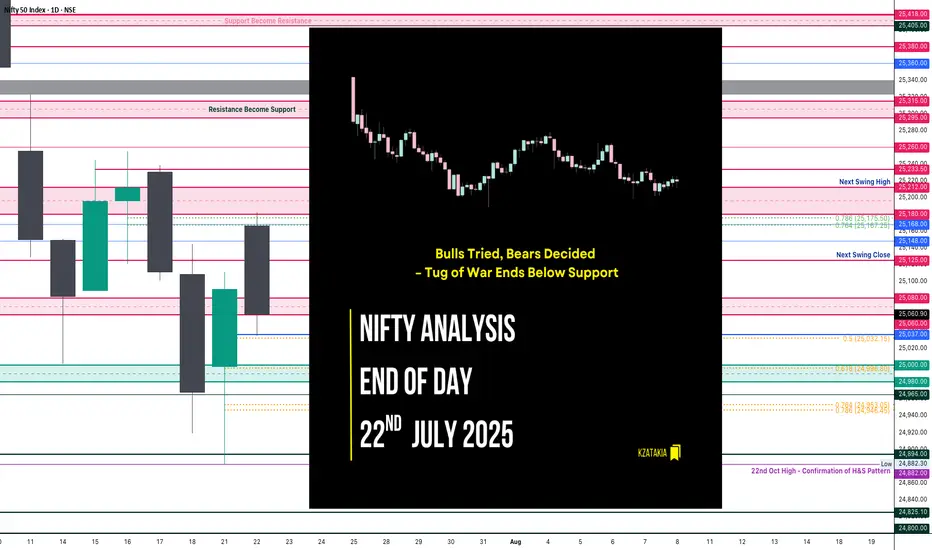
Nifty Analysis EOD – July 22, 2025 – Tuesday🟢 Nifty Analysis EOD – July 22, 2025 – Tuesday 🔴
"Bulls Tried, Bears Decided – Tug of War Ends Below Support"
Nifty opened with an 88-point gap-up, continuing the bullish sentiment, right at the resistance zone of 25,180 ~ 25,212. However, the market opened at the high (OH) and quickly slipped around 100 points to form the Initial Balance (IB). After a brief bounce back to the mean, it faced resistance, leading to a breakdown of IB and further losses of 77 points.
A supportive bounce emerged near 25,060 ~ 25,080, but the price was pushed down again by PDH + VWAP + R1. The day closed below PDC and under the support zone at 25,065, showing bearish dominance despite a volatile tug-of-war between bulls and bears.
Today’s low tested the 0.5 Fibonacci retracement level (from yesterday’s low to today’s high). If this is truly a retracement, 25K must hold in upcoming sessions, and bulls will need to reclaim 25,200 to regain their grip.
🕯 5 Min Time Frame Chart with Intraday Levels
🕯 Daily Time Frame Chart with Intraday Levels
📊 Daily Candle Breakdown
Open: 25,166.65
High: 25,182.00
Low: 25,035.55
Close: 25,060.90
Change: −29.80 (−0.12%)
Candle Structure:
Real Body: Red (−105.75 pts) → Decent bearish body
Upper Wick: 15.35 pts → Small
Lower Wick: 25.35 pts → Moderate
Interpretation:
Price opened strong but faced selling near 25,180, leading to a steady drop throughout the session. The lower wick shows some buying attempt near 25,035, but the close below open signals bears dominated.
Candle Type:
Bearish candle with moderate lower wick – resembles a Bearish Engulfing setup after a green candle, suggesting profit-booking or fresh selling.
Key Insight:
Sellers defending 25,180–25,200 firmly
Holding above 25,030–25,050 is critical; breaking this could retest 24,950–25,000
Bulls must reclaim 25,120–25,150 for momentum revival
🛡 5 Min Intraday Chart
⚔️ Gladiator Strategy Update
ATR: 182.32
IB Range: 92.6 → Medium
Market Structure: Balanced
Trades Triggered:
10:45 AM – Short Trade → Trailing SL Hit (1:0.8)
12:45 PM – Long Trade → SL Hit
📌 Support & Resistance Levels
Resistance:
25,080 ~ 25,060
25,125
25,168
25,180 ~ 25,212
Support:
25,037
25,000 ~ 24,980
24,965
24,894 ~ 24,882
24,825
24,800 ~ 24,768
🧠 Final Thoughts:
"Markets often dance between zones of power — where bulls flex and bears press. It's not chaos, it's the choreography of sentiment."
The 25,000–25,212 zone continues to be the battlefield. Let’s see who seizes the upper hand tomorrow.
✏️ Disclaimer:
This is just my personal viewpoint. Always consult your financial advisor before taking any action.
Nifty levels - Jul 23, 2025Nifty support and resistance levels are valuable tools for making informed trading decisions, specifically when combined with the analysis of 5-minute timeframe candlesticks and VWAP. By closely monitoring these levels and observing the price movements within this timeframe, traders can enhance the accuracy of their entry and exit points. It is important to bear in mind that support and resistance levels are not fixed, and they can change over time as market conditions evolve.
The dashed lines on the chart indicate the reaction levels, serving as additional points of significance to consider. Furthermore, take note of the response at the levels of the High, Low, and Close values from the day prior.
We hope you find this information beneficial in your trading endeavors.
* If you found the idea appealing, kindly tap the Boost icon located below the chart. We encourage you to share your thoughts and comments regarding it.
Wishing you success in your trading activities!

#Nifty directions and levels for July 22nd:Good morning, friends! 🌞
Here are the market directions and levels for July 22nd:
The global market shows no major changes and continues to maintain a moderately bearish sentiment.
Meanwhile, the local market is exhibiting a moderately bullish tone. Today, Gift Nifty indicates a gap-up opening of around 100 points.
What can we expect today?
In the previous session, both Nifty and Bank Nifty experienced a pullback and managed to sustain it. However, structurally, the trend remains bearish in the lower time frame. So, how should we interpret this sentiment?
1, Since there’s no clear direction, if the market faces rejection initially, we can expect minor consolidation within the 38% Fibonacci range.
2, On the other hand, if it sustains the gap-up and breaks the immediate resistance with a solid structure, we can follow the direction for further upside.

#NIFTY Intraday Support and Resistance Levels - 22/07/2025Today, Nifty is expected to open slightly gap-up, indicating positive early sentiment. After breaking out from the previous day’s consolidation zone, the index has shown strength around the 25,050 level, which will now act as an important intraday support. If this level is held during the early session, we can expect further upside continuation.
A move above the 25,050–25,100 zone can trigger upward momentum with potential targets at 25,150, 25,200, and 25,250+. Sustained strength above 25,250 will open the door for further bullish moves toward 25,350, 25,400, and 25,450+, making it a favorable long scenario for trending market conditions.
However, if the index fails to hold above the 25,050 level and starts trading back below 24,950, it may again enter a bearish territory. In such a case, downside targets of 24,850, 24,800, and 24,750- are possible, indicating weakness and reversal from resistance.
Nifty 20500 or 19200?Last time, I was correct when I foresaw and gave an update on the Nifty's latest peak of 25650 the day before it happened, along with the beginning of a potential downward trend. Now, if the Nifty can break below 24500, there's a good chance we'll drop below the previous low of 21700 and reach at least 20500 or even lower, at 19200, by February 2026.

#Nifty - Pivot Point is 25016.05Date:12-06-2025
#Nifty Current Price: 24950
Pivot Point: 25016.05 Support: 24711.72 Resistance: 25322.18
#Nifty Upside Targets:
Target 1: 25529.42
Target 2: 25736.65
Target 3: 26006.88
Target 4: 26277.10
#Nifty Downside Targets:
Target 1: 24503.59
Target 2: 24295.45
Target 3: 24025.225
Target 4: 23755.00

Nifty Analysis EOD – July 21, 2025 – Monday 🟢 Nifty Analysis EOD – July 21, 2025 – Monday 🔴
“Shock, Squeeze, and a Strong Close — Bulls Reclaim 25K”
Today’s move was nothing short of shocking. In the first 45 minutes, Nifty plunged more than 150 points, breaking through key levels and touching 24,882. But what followed was a V-shaped recovery that caught both Friday’s shorts and those who shorted below PDC/PDL completely off guard.
The index powered up to mark a day high of 25,080, and sustained above CPR and VWAP throughout most of the session. A final push came around 2:55 PM, breaking the intraday trendline and CDH, registering a fresh high before closing near the top at 25,090.70.
✅ Bulls not only held 25K — they dominated the battlefield all day, recovering almost everything lost during Friday’s drop.
🕯 5 Min Time Frame Chart with Intraday Levels
🕯 Daily Time Frame Chart with Intraday Levels
🕯 Daily Candle Breakdown
Open: 24,999.00
High: 25,111.40
Low: 24,882.30
Close: 25,090.70
Change: +122.30 (+0.49%)
📊 Candle Structure Breakdown
Real Body: 91.70 points → strong bullish body
Upper Wick: 20.70 points → slight hesitation near highs
Lower Wick: 116.70 points → deep intraday buying from the lows
🔍 Interpretation
Mildly negative open, followed by a sharp 150-point fall
Buyers stepped in strongly near 24,880, triggering a sharp reversal
V-shape recovery sustained above CPR & VWAP, closing near high
Close is not just above open — it’s above Friday’s close and 25K mark
🕯 Candle Type
Hammer-like Bullish Reversal Candle — Long lower wick with green body, signaling strong dip buying and possible short-term trend reversal
📌 Key Insight
Strong defense at 24,880–24,900 created the base for reversal
Close above 25,090 shifts near-term bias in favor of bulls
25,110–25,140 is the next resistance to watch
As long as we stay above 24,900, buyers hold the edge
🛡 5 Min Intraday Chart
⚔️ Gladiator Strategy Update
ATR: 186.31
IB Range: 166.8 → Wide IB
Market Structure: 🟡 Balanced
📉 Trades Triggered:
10:09 AM – Long Trade → ❌ SL Hit
📌 Support & Resistance Levels
Resistance Levels:
25,080 ~ 25,060
25,125
25,168
25,180 ~ 25,212
Support Levels:
25,037
25,000 ~ 24,980
24,965
24,894 ~ 24,882
24,825
24,800 ~ 24,768
💭 Final Thoughts
🧠 “Volatility doesn’t confuse the market — it reveals who’s in control.”Today’s V-shaped reversal erased all doubts from Friday’s fall. Buyers didn’t just defend — they counterattacked and reclaimed 25K with authority.Follow-through above 25,125 on Monday could confirm trend resumption.
✏️ Disclaimer
This is just my personal viewpoint. Always consult your financial advisor before taking any action.

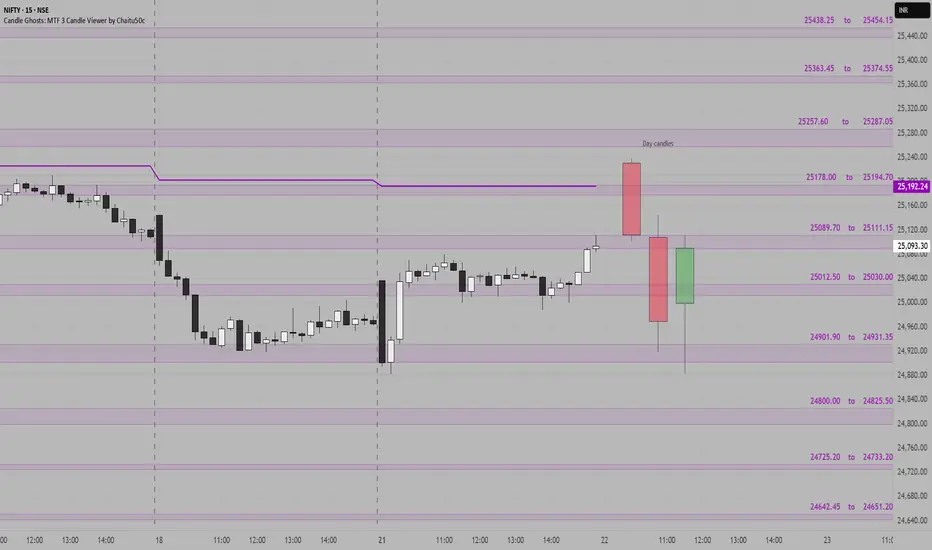
NIFTY SUPPORT & RESISTANCE ZONES FOR 22-07-2025Nifty Support & Resistance Zones for Tomorrow 22-07-2025
Based on price cluster analysis and recent market structure, the following key support and resistance levels have been identified for the upcoming session:
Resistance Zones:
25438.25 – 25454.15
25363.45 – 25374.55
25257.60 – 25287.05
25178.00 – 25194.70
25089.70 – 25111.15
Support Zones:
25012.50 – 25030.00
24901.90 – 24931.35
24800.00 – 24825.50
24725.20 – 24733.20
24642.45 – 24651.20
These levels are derived from high-probability zones where price has shown repeated interaction in the recent past. Watch how Nifty reacts at these zones for potential breakout, reversal, or pullback setups.
Nifty has taken support at Mother line as expected.Despite poor showing by Reliance post result and TCS continuing to fall Nifty staged a remarkable comeback on the back of Pvt Sector banking which did well. Bank Nifty came back strongly posting 1.19% gains today which enabled Nifty to rise 122 points or 0.49%. Capital Goods, Finance and Metals indices also gained more than 1% each.
Resistances for Nifty now remain at: 25150, 25277 (Trend line resistance), 25448, 25684 and finally channel top resistance at 25915.
Supports for Nifty remain at: 24938 (Mother Line Support of Daily Chart), 24759, 24503, 24259 and finally 24116 (Father Line support of Daily chart).
Shadow of the candle right now is neutral to positive and RSI is 47.63 with median RSI resistance at 54.09.
Disclaimer: The above information is provided for educational purpose, analysis and paper trading only. Please don't treat this as a buy or sell recommendation for the stock or index. The Techno-Funda analysis is based on data that is more than 3 months old. Supports and Resistances are determined by historic past peaks and Valley in the chart. Many other indicators and patterns like EMA, RSI, MACD, Volumes, Fibonacci, parallel channel etc. use historic data which is 3 months or older cyclical points. There is no guarantee they will work in future as markets are highly volatile and swings in prices are also due to macro and micro factors based on actions taken by the company as well as region and global events. Equity investment is subject to risks. I or my clients or family members might have positions in the stocks that we mention in our educational posts. We will not be responsible for any Profit or loss that may occur due to any financial decision taken based on any data provided in this message. Do consult your investment advisor before taking any financial decisions. Stop losses should be an important part of any investment in equity.