Related futures
I think it's today.I admit that today's Nifty surpassed below yesterday's 24800 level, and my rash assumption that this level would act as a strong reversal support was wrong. But my overall opinion hasn't changed: there's a good chance the market will correct this whole wave 1 decline if the GIFT Nifty support level
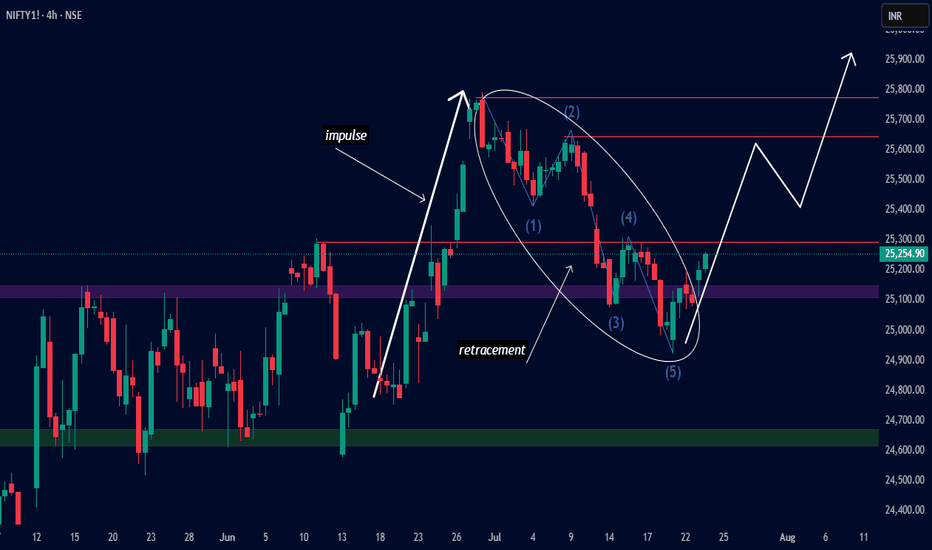
NIFTY 4H – Impulse & Retracement Complete | Bullish Move Ahead?Hello friends this is nifty futures chart
The recent 5-wave corrective structure (Elliott Wave) seems to have completed near the Flip Zone, with Wave (5) marking a potential bullish reversal point.
Key Observations:
Strong impulse move followed by a 5-wave retracement
Price reversed from previous
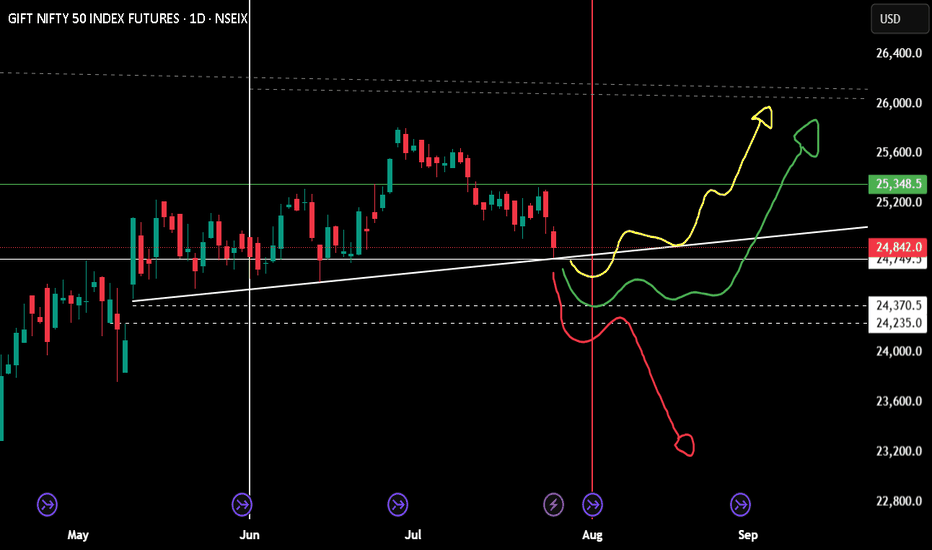
Monthly position for niftyExpecting a reversal, yes geo political and 1st August announcement will play a major role.
just wait for one day candle closing on your area.
If you wish to be on buying side (buy nifty future) a positive candle on top of the trend line.
Selling future for the month is only wise if 24k is crossed
Intraday set up for 7th August 2025 Nifty future and banknifty future analysis and intraday plan.
Quarterly results.
This video is for information/education purpose only. you are 100% responsible for any actions you take by reading/viewing this post.
please consult your financial advisor before taking any action.
----Vinaykumar
GIFT NIFTY @ 24683 ANALYSIS 04-AUG-2025: BIGGER PICTURESupports: 24577/24421/24234
Resistances: 24970/25325/24639/24800
As long as the above support levels hold, we can see big bull run towards 27500 first.
Targets: 25855, 26655, 27577
27934-28770
29234
30000-30500-31350
On the downside, if break 24421/24234, we can see 23800, 23355, 23000.
See all ideas
Summarizing what the indicators are suggesting.
Neutral
SellBuy
Strong sellStrong buy
Strong sellSellNeutralBuyStrong buy
Neutral
SellBuy
Strong sellStrong buy
Strong sellSellNeutralBuyStrong buy
Neutral
SellBuy
Strong sellStrong buy
Strong sellSellNeutralBuyStrong buy
A representation of what an asset is worth today and what the market thinks it will be worth in the future.
Displays a symbol's price movements over previous years to identify recurring trends.
Frequently Asked Questions
The current price of S&P CNX NIFTY INDEX FUTURES is 24,634.90 INR — it has risen 0.11% in the past 24 hours. Watch S&P CNX NIFTY INDEX FUTURES price in more detail on the chart.
The volume of S&P CNX NIFTY INDEX FUTURES is 3.96 M. Track more important stats on the S&P CNX NIFTY INDEX FUTURES chart.
Open interest is the number of contracts held by traders in active positions — they're not closed or expired. For S&P CNX NIFTY INDEX FUTURES this number is 5.28 M. You can use it to track a prevailing market trend and adjust your own strategy: declining open interest for S&P CNX NIFTY INDEX FUTURES shows that traders are closing their positions, which means a weakening trend.
Buying or selling futures contracts depends on many factors: season, underlying commodity, your own trading strategy. So mostly it's up to you, but if you look for some certain calculations to take into account, you can study technical analysis for S&P CNX NIFTY INDEX FUTURES. Today its technical rating is sell, but remember that market conditions change all the time, so it's always crucial to do your own research. See more of S&P CNX NIFTY INDEX FUTURES technicals for a more comprehensive analysis.


