Swing Trade Journey – Trade 15: Pondy Oxides and Chemicals Ltd (Tade 15 Log
Long in #POCL at ₹1319
Reasoning:
Price is trending above short-term moving averages with rising volume and strong relative strength within the sector. Setup continues to show a favourable risk–reward profile.
Tracking this as part of my swing trade journey — recording setups, risks &
Pondy Oxides & Chemicals Ltd.
No trades
30.40 INR
580.55 M INR
20.41 B INR
16.75 M
About Pondy Oxides & Chemicals Ltd.
Sector
Industry
CEO
Ashish Bansal
Website
Headquarters
Chennai
Founded
1995
Identifiers
2
ISININE063E01053
Pondy Oxides & Chemicals Ltd. engages in the conversion of various forms of lead, aluminium and copper into its metals and alloys. Its products include lead, lead calcium, lead tin alloys, clove, cobra, mill berry, polypropylene copolymer plastic, and nylon. The company was founded on March 21, 1995 and is headquartered in Chennai, India.
Related stocks

POCL Daily ChartPOCL
Daily Chart
Insider Bar Strategy
RSI above 60 on Weekly and Monthly Basis
Entry 1184
SL 1145
recent expected level 1242
T1 1270 T2 1330 T3 1360
No Buy and sell recommendation
Hit Like Boost Button

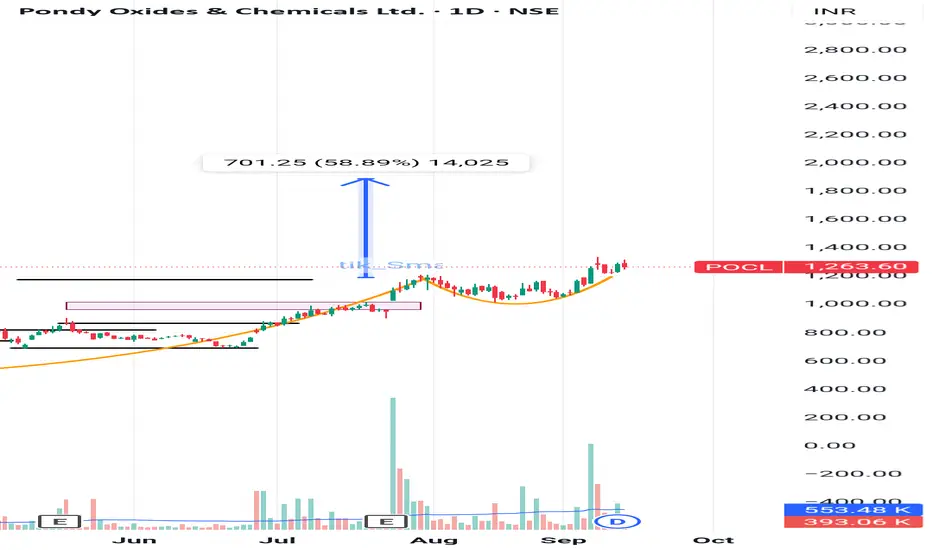
POCL : Cup & Handle PatternPOCL : At Cup & Handle Breakout levels
CMP 1263
Pattern Target 1900
View negated below 1150
Please check the chart for details.
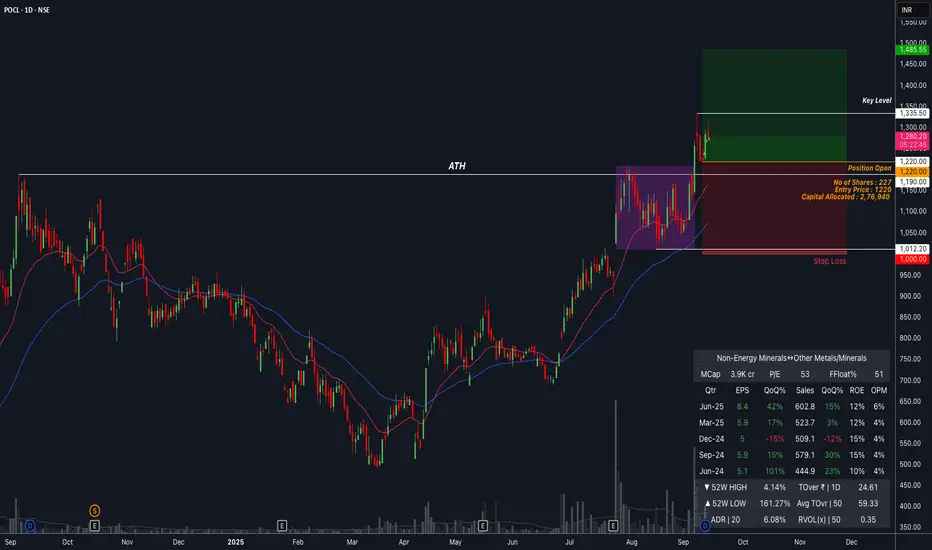
POCL : Took a swing position with 1% riskThere is a confirmed breakout supported by volume, along with a well-defined basing pattern. Additionally, both EPS and sales have been steadily improving over the past three quarters.
Therefore, I’ve decided to enter a trade on the price retracement, while planning to manage the position based on
Pocl upsidePocl looking goods for upside potential for 20-25% surge in volumes healthy candle breakout at all time high

PONDY OXIDES AND CHEMICAL LIMITED - TARGET -Rs 1800/-POCL is in the metallic and non-metallic recycling industry as India’s largest secondary Lead manufacturer in Lead Alloys. Its core product, lead and lead alloys, is mainly used in making lead-acid batteries. Company converts scraps of various forms of Lead, Aluminium, and Copper into Lead Metal, Al

Positional setup and tweet-ready summary for Pondy Oxides & Chem🧪 Technical Analysis (Daily & Weekly Setup)
Trend & Moving Averages: Price is trading above the 5‑, 9‑, and 13‑period EMAs, indicating a clear bullish momentum. EMAs are aligned upward, suggesting trend continuation.
Support & Resistance Zones: Immediate support lies around ₹1,100‑₹1,150 (recent co


Pondy Oxide, Kindly do your own studyThis stock is in momentum in weekly time frame.
Monthly time frame- stock has completed 4 wave structure and looks like its in 5th wave.
Weekly-stock has challenged upper bollinger band
Weekly MACD -PCO stat
Weekly RSI is in momentum
Weekly ADX is strong
Daily price is in momentum and volume ha

POCL: Breakout , wait for a retestPOCL: has given a breakout of 1041 level and now some corrections and profit booking will be seen towards 1100-1041 level.
if we see some consolidation that is a good chance of accumulation and when ever there is a breakout of that we can see a good upside ahead.

See all ideas
Summarizing what the indicators are suggesting.
Oscillators
Neutral
SellBuy
Strong sellStrong buy
Strong sellSellNeutralBuyStrong buy
Oscillators
Neutral
SellBuy
Strong sellStrong buy
Strong sellSellNeutralBuyStrong buy
Summary
Neutral
SellBuy
Strong sellStrong buy
Strong sellSellNeutralBuyStrong buy
Summary
Neutral
SellBuy
Strong sellStrong buy
Strong sellSellNeutralBuyStrong buy
Summary
Neutral
SellBuy
Strong sellStrong buy
Strong sellSellNeutralBuyStrong buy
Moving Averages
Neutral
SellBuy
Strong sellStrong buy
Strong sellSellNeutralBuyStrong buy
Moving Averages
Neutral
SellBuy
Strong sellStrong buy
Strong sellSellNeutralBuyStrong buy
Displays a symbol's price movements over previous years to identify recurring trends.
AVXC
Avantis Emerging Markets ex-China Equity ETFWeight
0.02%
Market value
41.70 K
USD
AVSE
Avantis Responsible Emerging Markets Equity ETFWeight
0.02%
Market value
30.04 K
USD
Explore more ETFs
Frequently Asked Questions
The current price of POCL is 1,454.10 INR — it has decreased by −0.02% in the past 24 hours. Watch Pondy Oxides & Chemicals Ltd. stock price performance more closely on the chart.
Depending on the exchange, the stock ticker may vary. For instance, on NSE exchange Pondy Oxides & Chemicals Ltd. stocks are traded under the ticker POCL.
POCL stock has risen by 4.54% compared to the previous week, the month change is a 12.29% rise, over the last year Pondy Oxides & Chemicals Ltd. has showed a 69.10% increase.
POCL reached its all-time high on Oct 17, 2025 with the price of 1,506.00 INR, and its all-time low was 131.05 INR and was reached on Mar 28, 2023. View more price dynamics on POCL chart.
See other stocks reaching their highest and lowest prices.
See other stocks reaching their highest and lowest prices.
POCL stock is 2.54% volatile and has beta coefficient of 4.01. Track Pondy Oxides & Chemicals Ltd. stock price on the chart and check out the list of the most volatile stocks — is Pondy Oxides & Chemicals Ltd. there?
Today Pondy Oxides & Chemicals Ltd. has the market capitalization of 44.39 B, it has decreased by −1.58% over the last week.
Yes, you can track Pondy Oxides & Chemicals Ltd. financials in yearly and quarterly reports right on TradingView.
POCL net income for the last quarter is 338.72 M INR, while the quarter before that showed 251.65 M INR of net income which accounts for 34.60% change. Track more Pondy Oxides & Chemicals Ltd. financial stats to get the full picture.
Yes, POCL dividends are paid annually. The last dividend per share was 3.50 INR. As of today, Dividend Yield (TTM)% is 0.24%. Tracking Pondy Oxides & Chemicals Ltd. dividends might help you take more informed decisions.
Pondy Oxides & Chemicals Ltd. dividend yield was 0.55% in 2024, and payout ratio reached 15.89%. The year before the numbers were 0.81% and 36.75% correspondingly. See high-dividend stocks and find more opportunities for your portfolio.
As of Dec 31, 2025, the company has 683 employees. See our rating of the largest employees — is Pondy Oxides & Chemicals Ltd. on this list?
EBITDA measures a company's operating performance, its growth signifies an improvement in the efficiency of a company. Pondy Oxides & Chemicals Ltd. EBITDA is 1.48 B INR, and current EBITDA margin is 4.52%. See more stats in Pondy Oxides & Chemicals Ltd. financial statements.
Like other stocks, POCL shares are traded on stock exchanges, e.g. Nasdaq, Nyse, Euronext, and the easiest way to buy them is through an online stock broker. To do this, you need to open an account and follow a broker's procedures, then start trading. You can trade Pondy Oxides & Chemicals Ltd. stock right from TradingView charts — choose your broker and connect to your account.
Investing in stocks requires a comprehensive research: you should carefully study all the available data, e.g. company's financials, related news, and its technical analysis. So Pondy Oxides & Chemicals Ltd. technincal analysis shows the buy rating today, and its 1 week rating is strong buy. Since market conditions are prone to changes, it's worth looking a bit further into the future — according to the 1 month rating Pondy Oxides & Chemicals Ltd. stock shows the strong buy signal. See more of Pondy Oxides & Chemicals Ltd. technicals for a more comprehensive analysis.
If you're still not sure, try looking for inspiration in our curated watchlists.
If you're still not sure, try looking for inspiration in our curated watchlists.