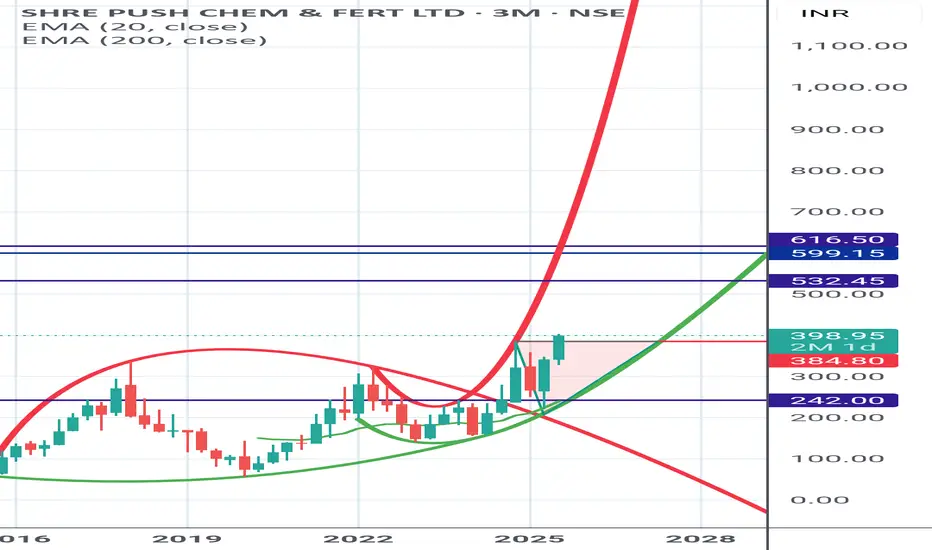
Shree Pushkar Chemicals⚡🚀 Shree Pushkar Chemicals – Breakout Beast! 🔥
💰 Deploy: ₹20K
📌 Buy: ₹448–450
⚡ Breakout: ₹448
🛑 SL: ₹342
🎯 TG: ₹797
⚡ Specialty Chemicals + breakout momentum = 🚀 High-upside swing setup!
RT if you’re catching this rocket early 📈
#StocksInFocus #StocksToBuy #StocksToTrade #BreakoutStocks #SwingT
Shree Pushkar Chemicals & Fertilisers Ltd.
No trades
22.15 INR
586.17 M INR
8.03 B INR
9.54 M
About Shree Pushkar Chemicals & Fertilisers Ltd.
Sector
Industry
Website
Headquarters
Mumbai
Founded
1993
Identifiers
2
ISININE712K01011
Shree Pushkar Chemical & Fertiliser Ltd. is a holding company, which engages in the provision of chemicals and fertilizers. It offers dye, dye intermediates, fertilizers, acids, and cattle feed supplements. The company was founded by Punit Makharia on March 29, 1993 and is headquartered in Mumbai, India.
Related stocks

Shree Pushkar SHREEPUSHKAR
TECHNO FUNDA PICK getting out of the marked Triangular zone.
Needs to close above and sustain it for big rally.
Note : This is Purely based on MY STUDY.
DO YOUR ANALYSIS FROM YOUR SIDE ALSO.
Personal view is BULLISH
SHREEPUSHK CMP 280.Shree Pushkar Chemical is a fundamentally strong company with the PE of 21 and Price to Book valyu less than 2. So stock trading at a fair valuation price. And last quarters are gave positive result. That we can consider this for long term investment investment idea. Chemical and Fertilizer Sector a

A multiyear breakout technical trade monthly TF Almost 7 yrs consolidation breakout ....sl previous swing low....Target 495....Only for educational purpose and not any recommendation.....

Positional Trade Idea for #SHREEPUSHKShree Pushkar Chemicals has broken out of a consolidation range, showing strong bullish momentum. The breakout above ₹280 signals potential upside in the coming sessions.
💥 Entry: Around ₹280-285
💥 Target: ₹320
💥 Stop-Loss: ₹265
#StockMarket #Trading #PositionalTrade #Breakout


#SHREEPUSHK Bottoming out This chemical stock looks good to long , as earlier signs of bottoming out seen!
Darvas box Bo in weekly TF
Good base+ Following TL since covid lows.
Good upside 25-50% possibilities with 150 WCB as your SL

SHREEPUSHKSHREEPUSHK
All targets mentioned
***I am not SEBI Registered. All my charts and analyses are only for educational purposes not for trading purposes

ShreePushkarChem Daily timeframe analysis for long term
NSE:SHREEPUSHK is at breakout level of 228 after so long consolidation.
We can see long term move above 228 with SL of 200 and can average till 210.
Major targets levels are highlighted in blue lines.

SHREE PUSHKAR Manufacturer of dye intermediates, reactive dyes, cattle feed , fertilisers, acid complex .
In 1993 company was engaged in trading of chemicals. It switched to manufacturing of dye intermediates from 2000 .Over the last 15 years company has done backward integration by putting up capacities for manu

See all ideas
Summarizing what the indicators are suggesting.
Oscillators
Neutral
SellBuy
Strong sellStrong buy
Strong sellSellNeutralBuyStrong buy
Oscillators
Neutral
SellBuy
Strong sellStrong buy
Strong sellSellNeutralBuyStrong buy
Summary
Neutral
SellBuy
Strong sellStrong buy
Strong sellSellNeutralBuyStrong buy
Summary
Neutral
SellBuy
Strong sellStrong buy
Strong sellSellNeutralBuyStrong buy
Summary
Neutral
SellBuy
Strong sellStrong buy
Strong sellSellNeutralBuyStrong buy
Moving Averages
Neutral
SellBuy
Strong sellStrong buy
Strong sellSellNeutralBuyStrong buy
Moving Averages
Neutral
SellBuy
Strong sellStrong buy
Strong sellSellNeutralBuyStrong buy
Displays a symbol's price movements over previous years to identify recurring trends.
Frequently Asked Questions
The current price of SHREEPUSHK is 374.20 INR — it has decreased by −1.43% in the past 24 hours. Watch Shree Pushkar Chemicals & Fertilisers Ltd. stock price performance more closely on the chart.
Depending on the exchange, the stock ticker may vary. For instance, on NSE exchange Shree Pushkar Chemicals & Fertilisers Ltd. stocks are traded under the ticker SHREEPUSHK.
SHREEPUSHK stock has fallen by −4.01% compared to the previous week, the month change is a −10.46% fall, over the last year Shree Pushkar Chemicals & Fertilisers Ltd. has showed a 9.64% increase.
SHREEPUSHK reached its all-time high on Sep 23, 2025 with the price of 476.00 INR, and its all-time low was 56.30 INR and was reached on Mar 24, 2020. View more price dynamics on SHREEPUSHK chart.
See other stocks reaching their highest and lowest prices.
See other stocks reaching their highest and lowest prices.
SHREEPUSHK stock is 3.85% volatile and has beta coefficient of 1.63. Track Shree Pushkar Chemicals & Fertilisers Ltd. stock price on the chart and check out the list of the most volatile stocks — is Shree Pushkar Chemicals & Fertilisers Ltd. there?
Today Shree Pushkar Chemicals & Fertilisers Ltd. has the market capitalization of 11.93 B, it has decreased by −1.02% over the last week.
Yes, you can track Shree Pushkar Chemicals & Fertilisers Ltd. financials in yearly and quarterly reports right on TradingView.
SHREEPUSHK net income for the last quarter is 182.03 M INR, while the quarter before that showed 209.57 M INR of net income which accounts for −13.14% change. Track more Shree Pushkar Chemicals & Fertilisers Ltd. financial stats to get the full picture.
Yes, SHREEPUSHK dividends are paid annually. The last dividend per share was 2.00 INR. As of today, Dividend Yield (TTM)% is 0.54%. Tracking Shree Pushkar Chemicals & Fertilisers Ltd. dividends might help you take more informed decisions.
Shree Pushkar Chemicals & Fertilisers Ltd. dividend yield was 0.75% in 2024, and payout ratio reached 10.96%. The year before the numbers were 0.94% and 12.80% correspondingly. See high-dividend stocks and find more opportunities for your portfolio.
As of Dec 19, 2025, the company has 820 employees. See our rating of the largest employees — is Shree Pushkar Chemicals & Fertilisers Ltd. on this list?
EBITDA measures a company's operating performance, its growth signifies an improvement in the efficiency of a company. Shree Pushkar Chemicals & Fertilisers Ltd. EBITDA is 1.02 B INR, and current EBITDA margin is 10.30%. See more stats in Shree Pushkar Chemicals & Fertilisers Ltd. financial statements.
Like other stocks, SHREEPUSHK shares are traded on stock exchanges, e.g. Nasdaq, Nyse, Euronext, and the easiest way to buy them is through an online stock broker. To do this, you need to open an account and follow a broker's procedures, then start trading. You can trade Shree Pushkar Chemicals & Fertilisers Ltd. stock right from TradingView charts — choose your broker and connect to your account.
Investing in stocks requires a comprehensive research: you should carefully study all the available data, e.g. company's financials, related news, and its technical analysis. So Shree Pushkar Chemicals & Fertilisers Ltd. technincal analysis shows the sell today, and its 1 week rating is neutral. Since market conditions are prone to changes, it's worth looking a bit further into the future — according to the 1 month rating Shree Pushkar Chemicals & Fertilisers Ltd. stock shows the buy signal. See more of Shree Pushkar Chemicals & Fertilisers Ltd. technicals for a more comprehensive analysis.
If you're still not sure, try looking for inspiration in our curated watchlists.
If you're still not sure, try looking for inspiration in our curated watchlists.