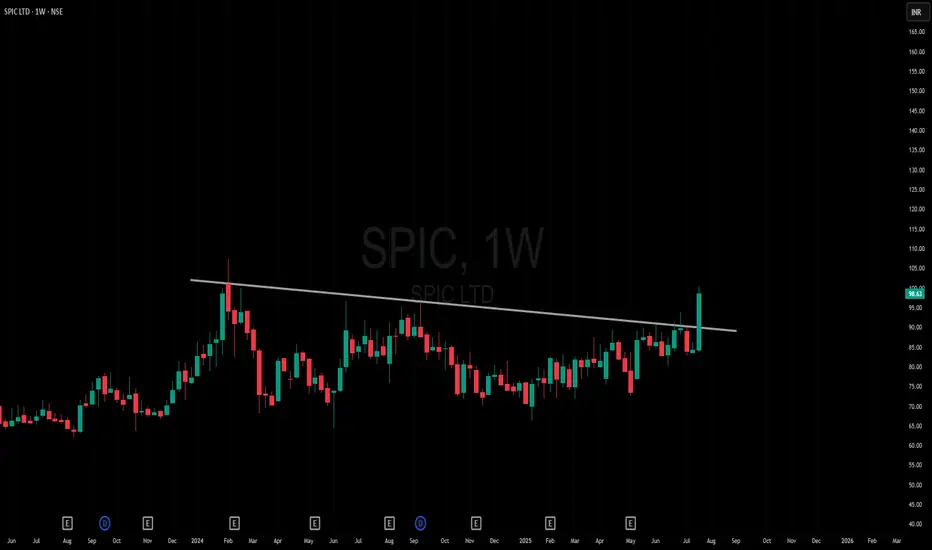
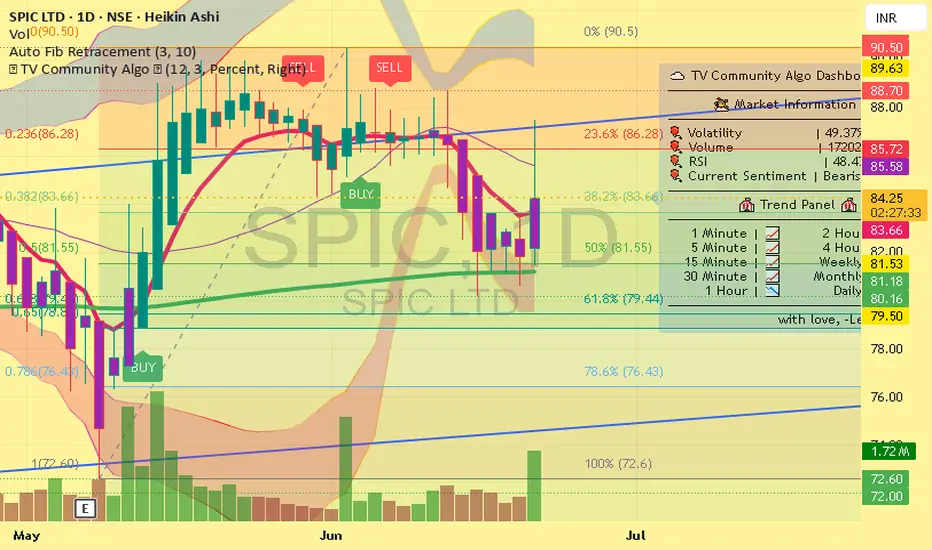
Amazing breakout on WEEKLY Timeframe - SPICCheckout an amazing breakout happened in the stock in Weekly timeframe, macroscopically seen in Daily timeframe. Having a great favor that the stock might be bullish expecting a staggering returns of minimum 25% TGT. IMPORTANT BREAKOUT LEVELS ARE ALWAYS RESPECTED!
NOTE for learners: Place the break
7.85 INR
1.56 B INR
4.56 B INR
100.29 M
About Southern Petrochemical Industries Corporation Limited
Sector
Industry
Website
Headquarters
Chennai
Founded
1969
ISIN
INE147A01011
FIGI
BBG000D057S3
Southern Petrochemical Industries Corp. Ltd. engages in the manufacture and sale of fertilizers. Its products and services include urea, organic fertilizers,bio-fertilizers and promoting enhanced cultivation methods, soil health management, integrated nutrient and pest management techniques. The company was founded on December 18, 1969 and is headquartered in Chennai, India.
Related stocks
buy SPIC for target 170buy SPIC with SL 79 for the target of 170 time horizon next 2 qtr , position built with strict sl , above 90 monthly closing may add fire in it, 3 yrs symtirical triangle breakout expected. early monsoon, israel iran clash, demand supply, gap can reason for it, and chart support it.
SPIC--compulsive buyA good fertilizer stock trading near to 200 days EMA . Low PE of 11.2 intrinsic value of 196 making rounded bottom with higher low and higher high with second inverse head and shoulder in making . we have a minimum target of 115-120 resistance on weekly chart if breaks out then higher target of

SPIC--BULLISH SET UPSPIC--DAY ABOVE 9,21,50 and 200 EMA bullish stock--inverse head and shoulder formation at breakout---level---trading on upper boundary of BB. book value 56 and EPS of 5.5

Key Support / Resistance Breakout - Swing TradeDisclaimer: I am not a Sebi registered adviser.
This Idea is publish purely for educational purpose only before investing in any stocks please take advise from your financial adviser.
Key Support & Resistance Breakout. Stock has give Breakout of Resistance level. Keep in watch list. Buy above the h

SPIC--ACCUMULATEparticular stock is making higher low continuously and might be in multi year bull run once breakouts of trendline you will see vertical rise .

"SPIC Ltd Ready for a Major Bullish Breakout – High Growth PotenSPIC Ltd is flashing strong bullish signals on the 1D timeframe, hinting at an upcoming breakout. This stock is primed for a significant uptrend, making it a top candidate for traders seeking substantial gains in the coming weeks. Don’t miss out on this high-potential opportunity—SPIC Ltd could be y

SPIC-BUYSPIC--heading toward 113-14 range once crosses 114 likely to make multi month high MARCH qtr was bad due to floods and renovation of plant inspite of it company declared a dividend .likely to make multi month highs in times to come.

SPIC LOOKING GOOD IN MONSOON Entry at 64to 66
Target 90Rs
This counter can easily reach at 90 Rs within 6 months.
Good level to invest

SPIC BREAKOUTAll time high Breakout.
Good Volume seen in Weekly chart.
Target 123 ,175 .
Disclaimer : This is not a Buy or Sell recommendation. Please consult your financial advisor before making any investments . This is for Educational purpose only.

See all ideas
Summarizing what the indicators are suggesting.
Oscillators
Neutral
SellBuy
Strong sellStrong buy
Strong sellSellNeutralBuyStrong buy
Oscillators
Neutral
SellBuy
Strong sellStrong buy
Strong sellSellNeutralBuyStrong buy
Summary
Neutral
SellBuy
Strong sellStrong buy
Strong sellSellNeutralBuyStrong buy
Summary
Neutral
SellBuy
Strong sellStrong buy
Strong sellSellNeutralBuyStrong buy
Summary
Neutral
SellBuy
Strong sellStrong buy
Strong sellSellNeutralBuyStrong buy
Moving Averages
Neutral
SellBuy
Strong sellStrong buy
Strong sellSellNeutralBuyStrong buy
Moving Averages
Neutral
SellBuy
Strong sellStrong buy
Strong sellSellNeutralBuyStrong buy
Displays a symbol's price movements over previous years to identify recurring trends.
Frequently Asked Questions
The current price of SPIC is 110.13 INR — it has decreased by −0.21% in the past 24 hours. Watch Southern Petrochemical Industries Corporation Limited stock price performance more closely on the chart.
Depending on the exchange, the stock ticker may vary. For instance, on NSE exchange Southern Petrochemical Industries Corporation Limited stocks are traded under the ticker SPIC.
SPIC stock has fallen by −11.84% compared to the previous week, the month change is a 26.25% rise, over the last year Southern Petrochemical Industries Corporation Limited has showed a 20.78% increase.
SPIC reached its all-time high on Sep 1, 2025 with the price of 118.32 INR, and its all-time low was 4.30 INR and was reached on Apr 1, 2003. View more price dynamics on SPIC chart.
See other stocks reaching their highest and lowest prices.
See other stocks reaching their highest and lowest prices.
SPIC stock is 2.75% volatile and has beta coefficient of 1.37. Track Southern Petrochemical Industries Corporation Limited stock price on the chart and check out the list of the most volatile stocks — is Southern Petrochemical Industries Corporation Limited there?
Today Southern Petrochemical Industries Corporation Limited has the market capitalization of 22.49 B, it has decreased by −2.96% over the last week.
Yes, you can track Southern Petrochemical Industries Corporation Limited financials in yearly and quarterly reports right on TradingView.
SPIC net income for the last quarter is 667.10 M INR, while the quarter before that showed 194.70 M INR of net income which accounts for 242.63% change. Track more Southern Petrochemical Industries Corporation Limited financial stats to get the full picture.
Yes, SPIC dividends are paid annually. The last dividend per share was 1.50 INR. As of today, Dividend Yield (TTM)% is 1.36%. Tracking Southern Petrochemical Industries Corporation Limited dividends might help you take more informed decisions.
Southern Petrochemical Industries Corporation Limited dividend yield was 2.47% in 2024, and payout ratio reached 26.17%. The year before the numbers were 2.13% and 27.03% correspondingly. See high-dividend stocks and find more opportunities for your portfolio.
As of Sep 11, 2025, the company has 1.24 K employees. See our rating of the largest employees — is Southern Petrochemical Industries Corporation Limited on this list?
EBITDA measures a company's operating performance, its growth signifies an improvement in the efficiency of a company. Southern Petrochemical Industries Corporation Limited EBITDA is 2.76 B INR, and current EBITDA margin is −514.73%. See more stats in Southern Petrochemical Industries Corporation Limited financial statements.
Like other stocks, SPIC shares are traded on stock exchanges, e.g. Nasdaq, Nyse, Euronext, and the easiest way to buy them is through an online stock broker. To do this, you need to open an account and follow a broker's procedures, then start trading. You can trade Southern Petrochemical Industries Corporation Limited stock right from TradingView charts — choose your broker and connect to your account.
Investing in stocks requires a comprehensive research: you should carefully study all the available data, e.g. company's financials, related news, and its technical analysis. So Southern Petrochemical Industries Corporation Limited technincal analysis shows the buy rating today, and its 1 week rating is buy. Since market conditions are prone to changes, it's worth looking a bit further into the future — according to the 1 month rating Southern Petrochemical Industries Corporation Limited stock shows the strong buy signal. See more of Southern Petrochemical Industries Corporation Limited technicals for a more comprehensive analysis.
If you're still not sure, try looking for inspiration in our curated watchlists.
If you're still not sure, try looking for inspiration in our curated watchlists.